


TOPICS
Energy Stores and Transfers
Open and Closed Systems
A SYSTEM consists of either a single object or a group of objects.
There are TWO types of system: An OPEN SYSTEM and a CLOSED SYSTEM.
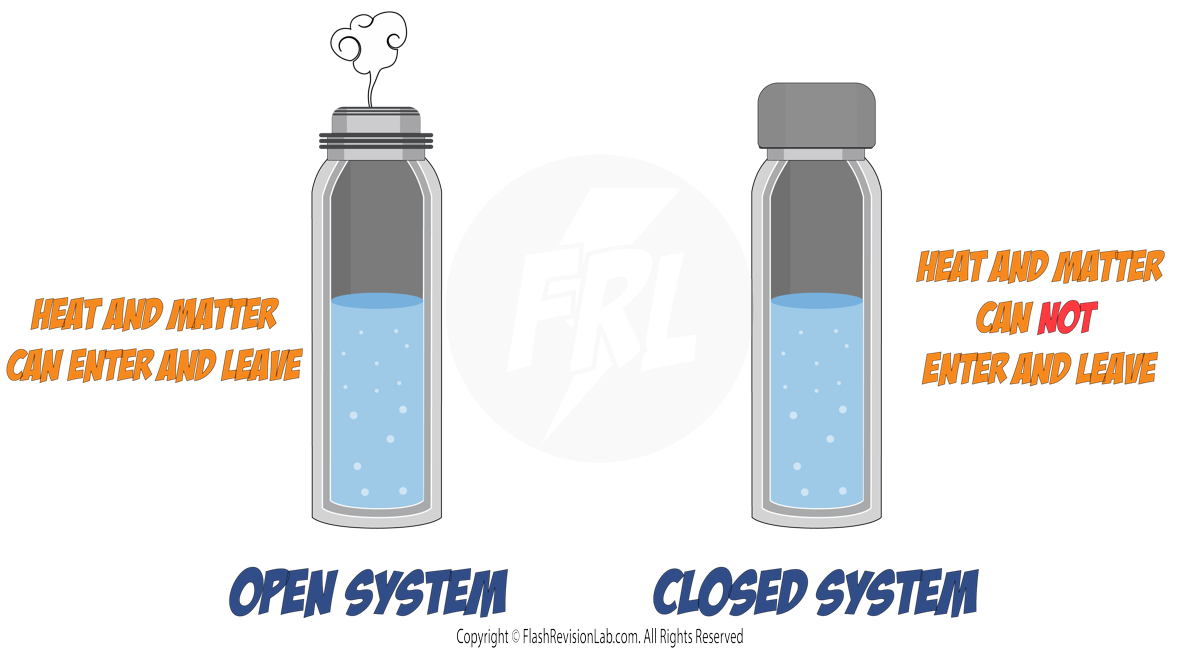
1. OPEN SYSTEMS
These can EXCHANGE energy and matter with their surroundings. Imagine you're making a cup of coffee. If you leave it, it COOLS down because the heat (energy) escapes – that's an open system.
2. CLOSED SYSTEMS
These are the opposite. They DON'T let energy or matter in or out. For example, a thermos flask that keeps your drink hot or cold – it's closed because it doesn't allow heat to escape or enter.
In a CLOSED SYSTEM, the total energy remains the same, even though it might change form inside the system.
Energy Stores
Energy is measured in JOULES. It follows the principle of CONSERVATION OF ENERGY, which tells us energy can NOT be created or destroyed, only transferred from one store to another.
Energy can be stored in different ways:
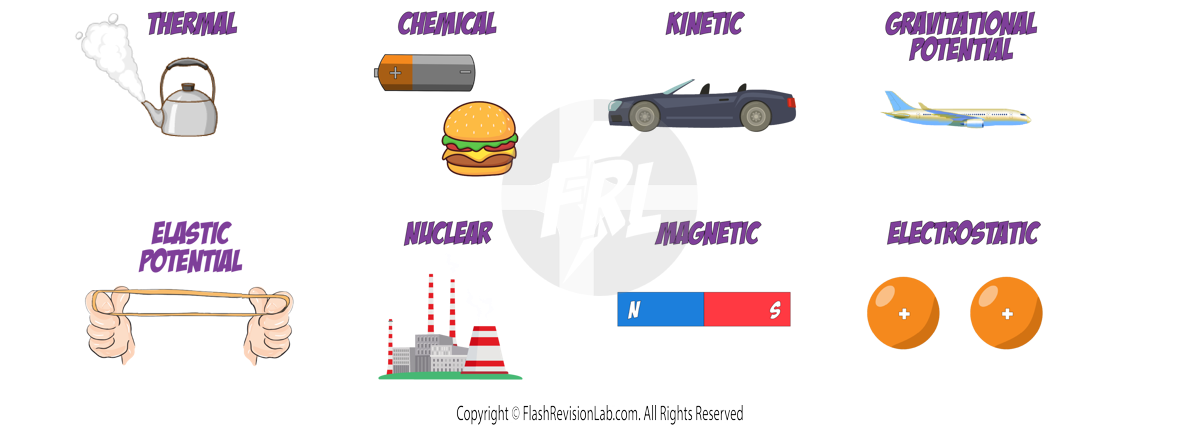
- THERMAL ENERGY: The HOTTER an object, the MORE energy in its thermal energy stores.
- CHEMICAL ENERGY: Releases energy due to a CHEMICAL REACTION. Found in food, batteries, and fuels.
- KINETIC ENERGY: Energy of MOVING objects.
- GRAVITATIONAL POTENTIAL ENERGY: Energy stored due to an object's height in a GRAVITATIONAL FIELD.
- ELASTIC POTENTIAL ENERGY: Stored when objects are STRETCHED or SQUASHED.
- NUCLEAR ENERGY: Released during NUCLEAR reactions.
- MAGNETIC ENERGY: Due to the attraction or repulsion between MAGNETS.
- ELECTROSTATIC ENERGY: Due to the attraction or repulsion between CHARGED PARTICLES.
Energy Transfers
Energy can move between these stores through different pathways.
There are FOUR types of these energy transfer pathways:
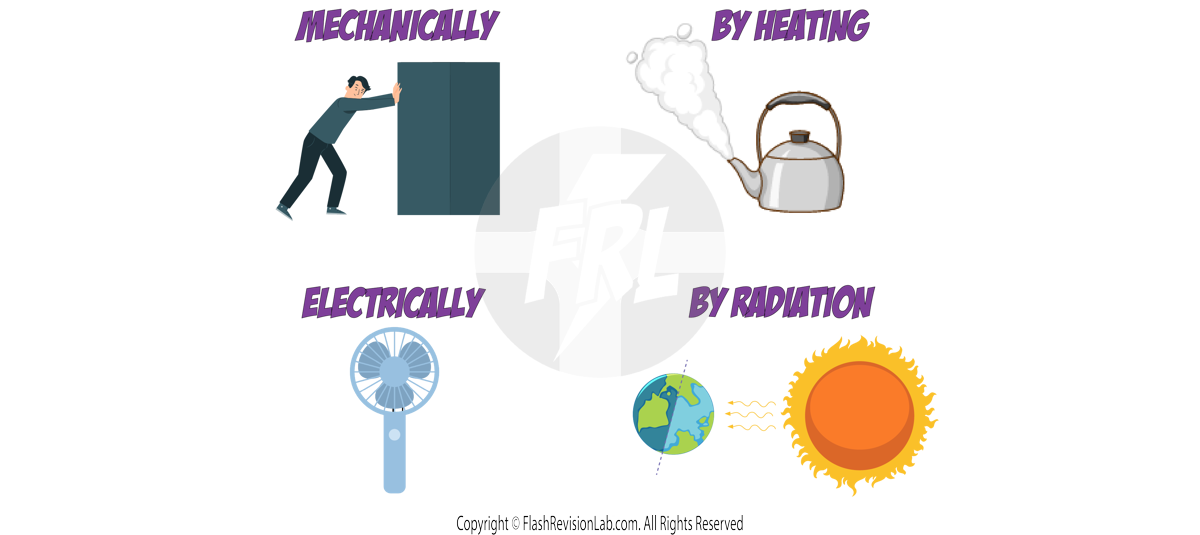
- MECHANICAL WORK: When FORCE is applied, like pushing a box.
- HEATING: Transfer of energy from a HOT object to a COLD object, like a kettle heating water.
- ELECTRIC WORK: When current flows in a circuit and transfers energy, like an electric fan.
- RADIATION: When energy is transferred in the form of a WAVE. Such as the Sun warming the Earth.
Examples of Energy Transfers
Understanding how energy is transferred in different scenarios can help explain everyday events:
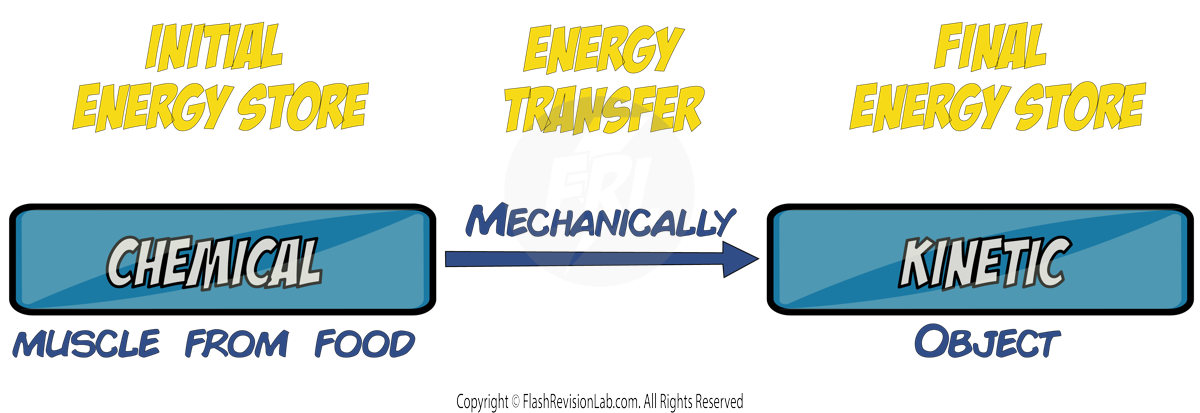
1. A Person Throwing a Ball Upwards:
- The energy in the CHEMICAL energy store of the person from their food is transferred MECHANICALLY (because a force is applied to the ball) to the KINETIC energy store of the ball.

- As the ball rises, it slows down because the energy in its KINETIC energy store is being transferred MECHANICALLY to its GRAVITATIONAL POTENTIAL energy store because the object is getting HIGHER.

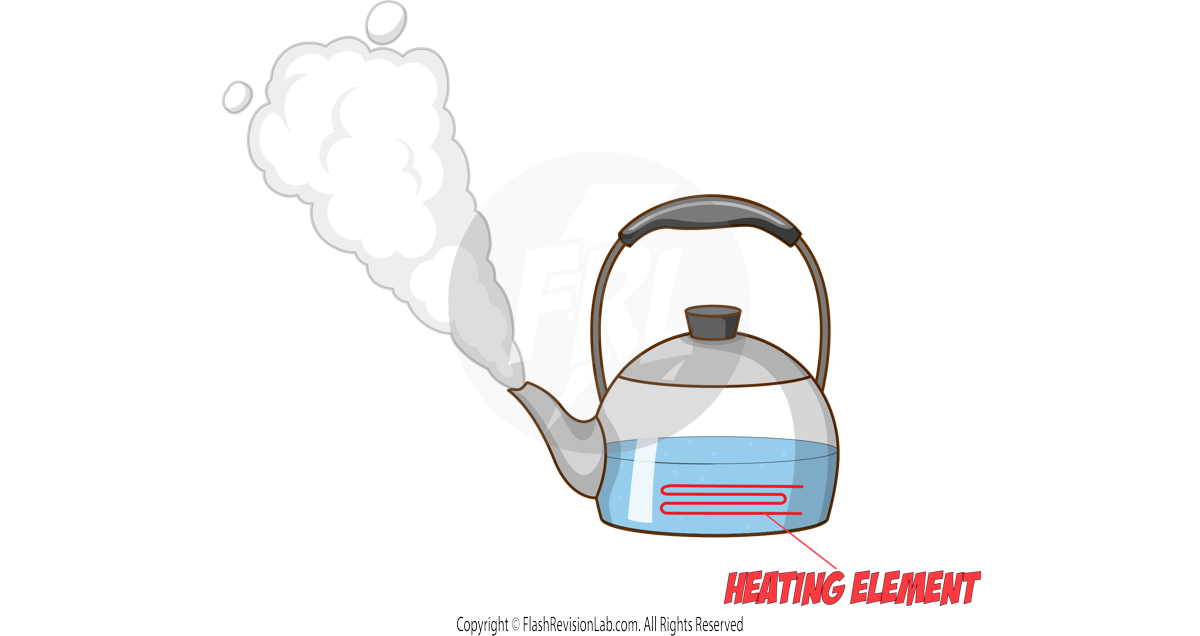
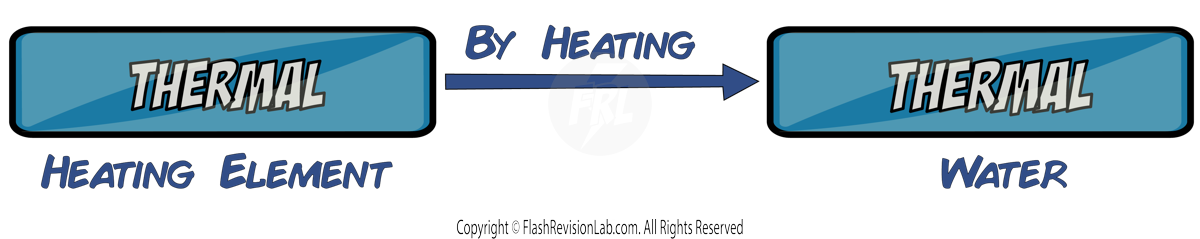
2. A Kettle Boiling Water:
Initially, the heating element in the kettle is HOT and the water is COLD. Energy is transferred from the THERMAL energy store of the heating element by HEATING to the thermal energy store of the water, causing it to get hotter.
3. A Car Accelerating with a Constant Force:
The energy in the CHEMICAL energy store of the car from the petrol in it reacts in the engine and transfers energy MECHANICALLY to the KINETIC energy store of the car.


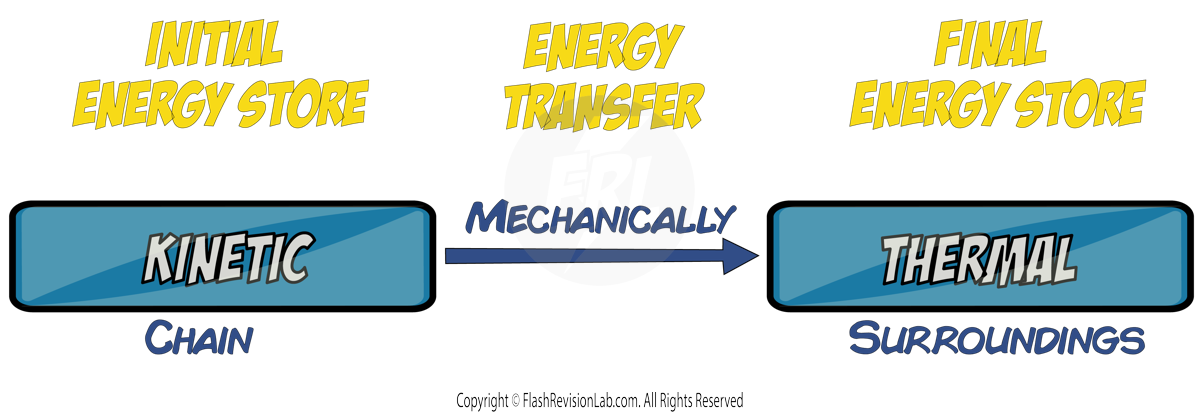
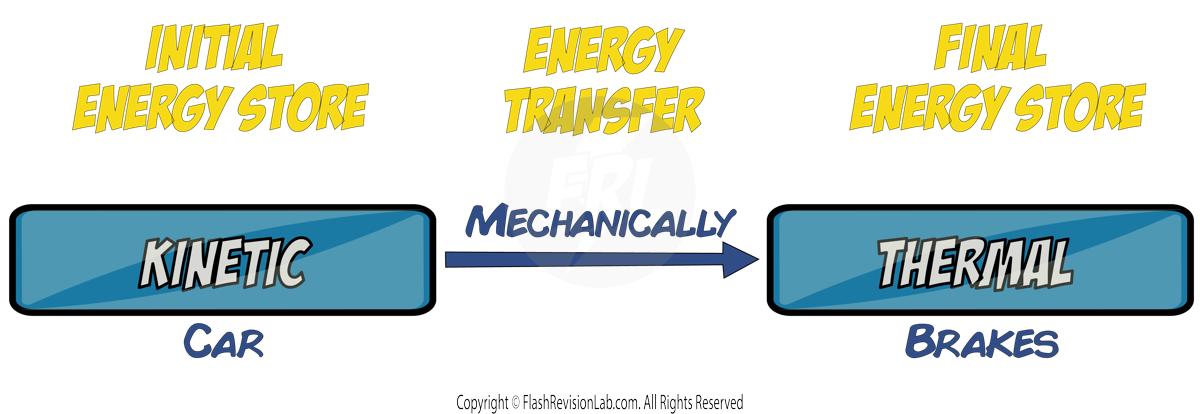
4. A Car Braking:
Friction between the brakes and wheels causes WORK to be done, which will cause energy in the KINETIC energy store to be transferred MECHANICALLY to the THERMAL energy store of the surroundings such as the road and the air.

5. A Car Crashing:
If a car was to crash into a wall, most of the energy from its KINETIC energy store is transferred MECHANICALLY to the THERMAL energy store of the wall as there is a FORCE acting on it from the car.

Changes in Energy
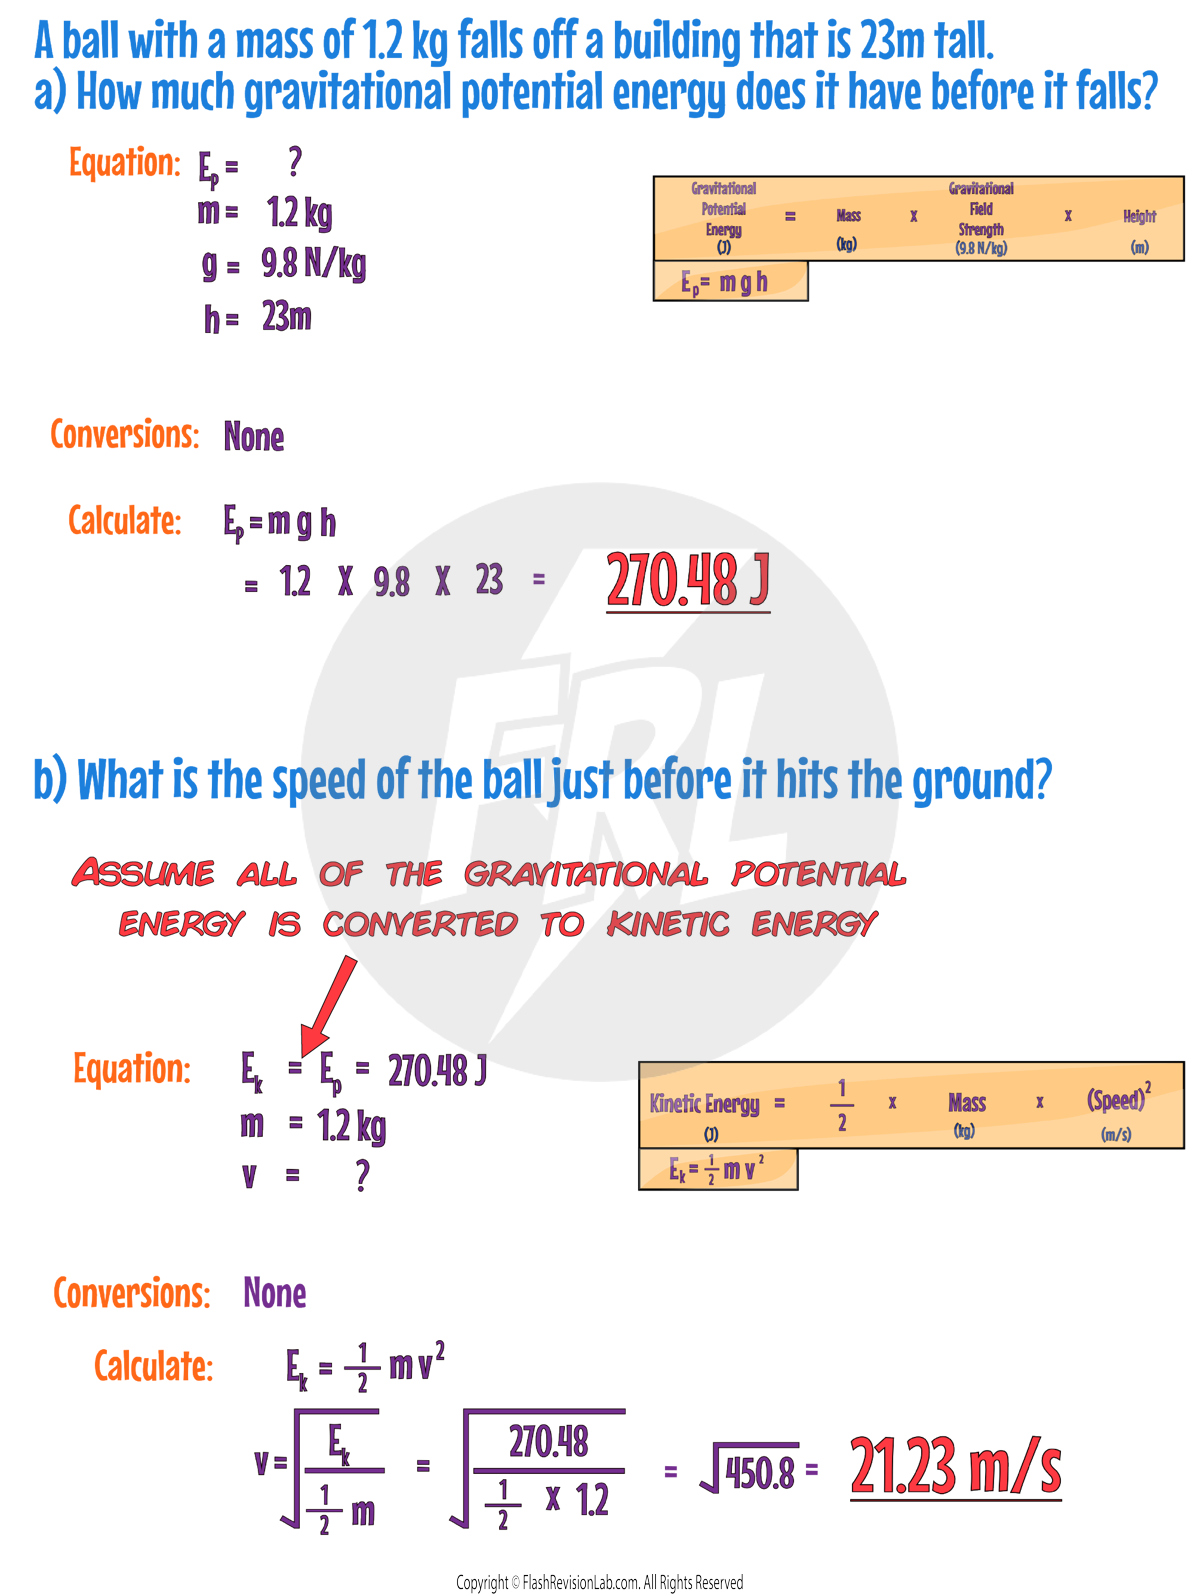
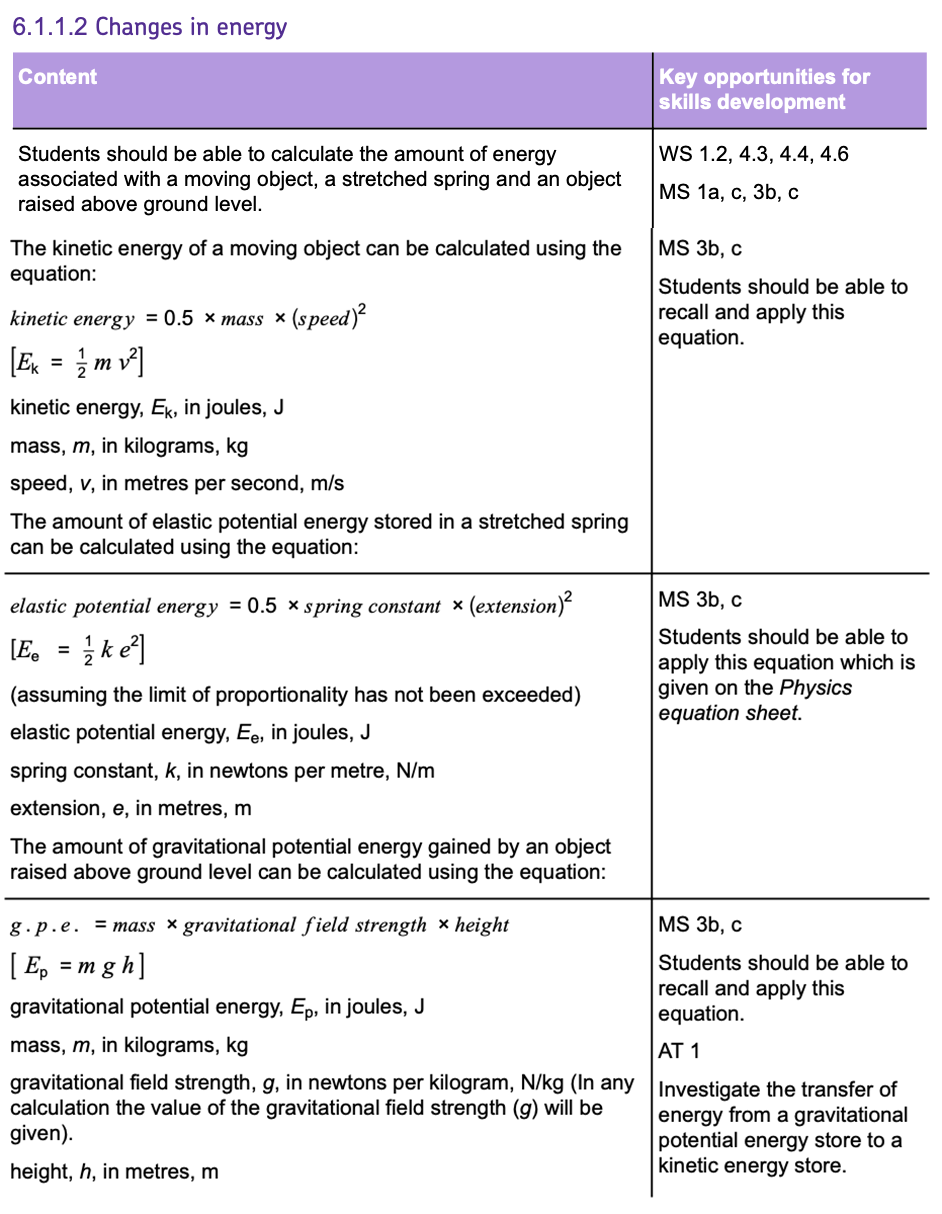
KINETIC ENERGY
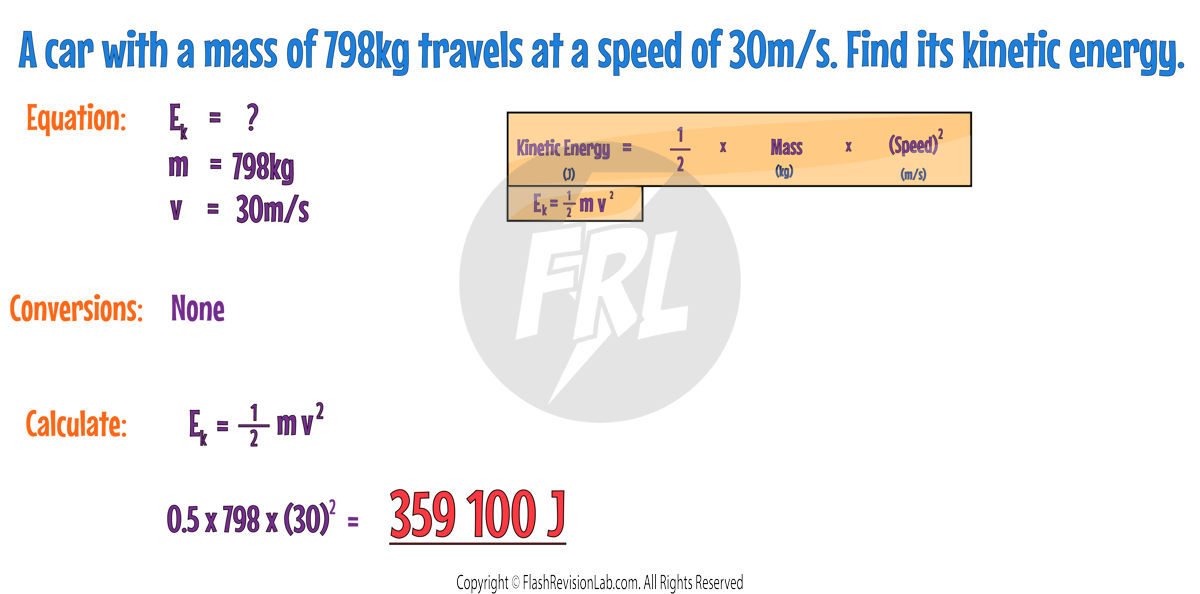
Kinetic Energy (KE) is the energy that a MOVING object has. You can calculate the Kinetic Energy of an object using the formula:
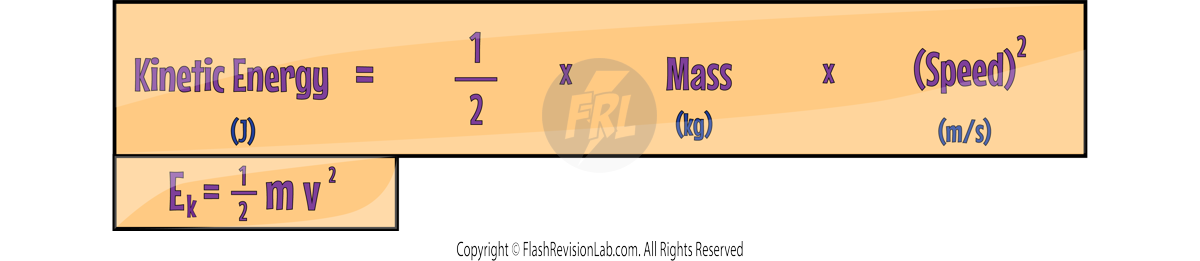
- Kinetic Energy is measured in Joules (J).
- Mass is measured in Kilograms (kg).
- Speed is measured in Metres per Second (m/s).
ELASTIC POTENTIAL ENERGY
Elastic Potential Energy (EPE) is the energy stored in elastic materials as the result of being STRETCHED or COMPRESSED. Elastic Potential Energy can be calculated with the formula:
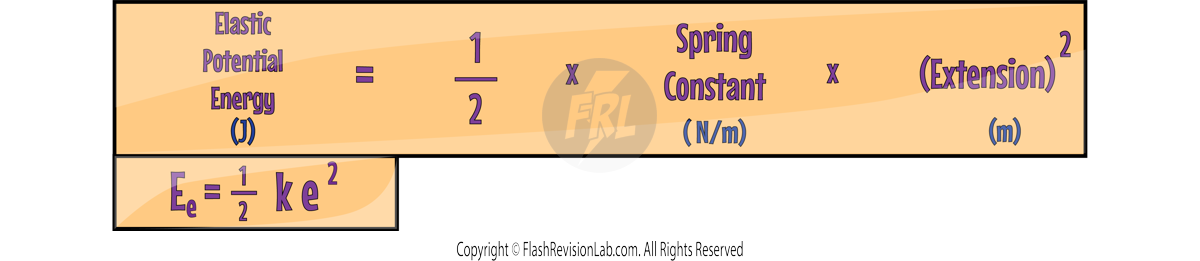
- Elastic Potential Energy is also measured in Joules (J).
- Spring Constant (k) measures how stiff the object being stretched is and is measured in Newtons per Metre (N/m).
- Extension (e) is how much the object is stretched or compressed and is measured in Metres (m).
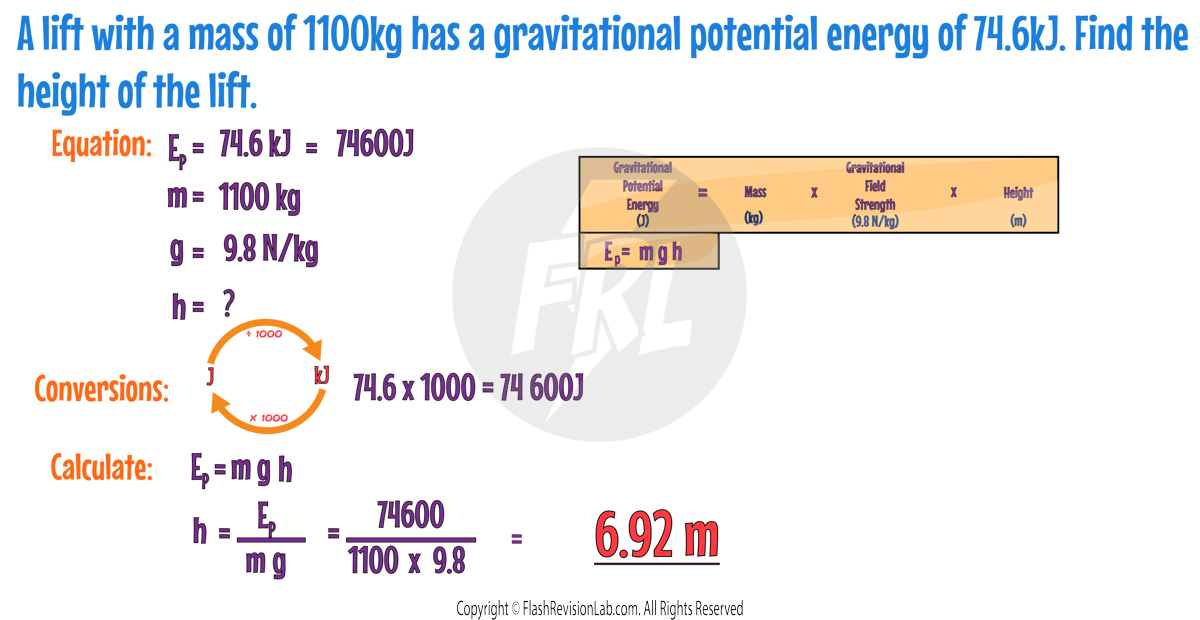
GRAVITATIONAL POTENTIAL ENERGY
Gravitational Potential Energy (GPE) is the energy held by an object because it is in a gravitational field and above ground level. The HIGHER up the object is, the GREATER the GPE. The formula to find the Gravitational Potential Energy is:
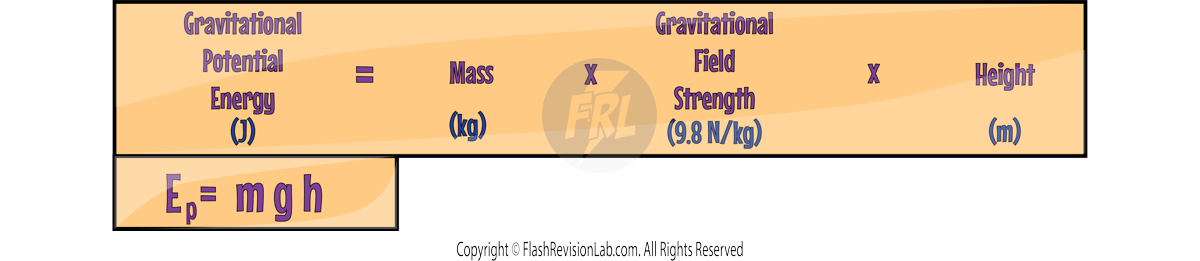
- GPE is in Joules (J).
- Mass is in Kilograms (kg).
- Gravitational Field Strength (g) is the strength of gravity, which on Earth is 9.8 Newtons per Kilogram (N/kg).
- Height is measured in Metres (m).
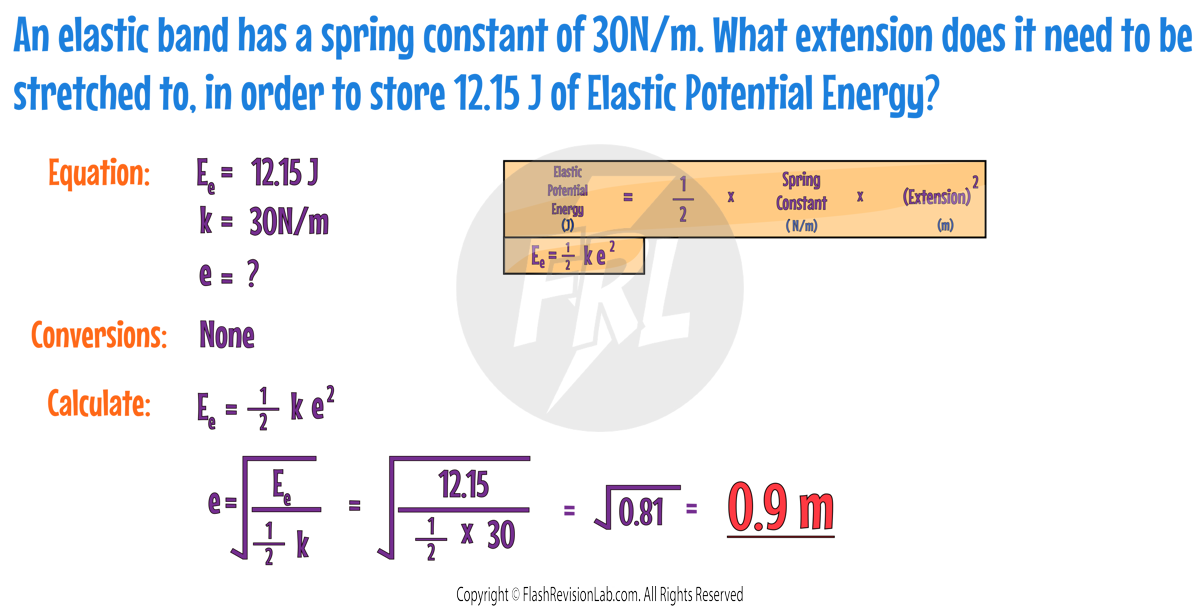
Here is an example combining more than one equation:
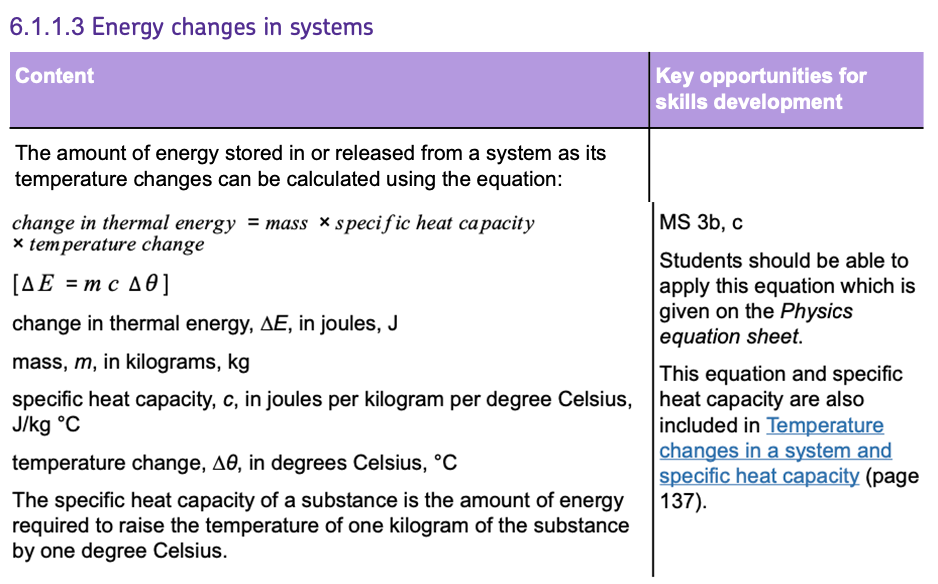
Energy Changes in Systems
Whenever you heat up or cool down an object, there is a CHANGE IN ENERGY.
The amount of energy STORED or RELEASED from a system as its temperature changes can be calculated by knowing the SPECIFIC HEAT CAPACITY.
SPECIFIC HEAT CAPACITY
Different materials need different amounts of energy to change their temperature.
The SPECIFIC HEAT CAPACITY (SHC) is a property that tells us how much heat energy (in joules) is needed to raise the temperature of 1 kilogram of a substance by 1 degree Celsius (°C).
It's a property of a material that tells you how easy it is to HEAT UP or COOL DOWN.
Here's a simple way to understand it:
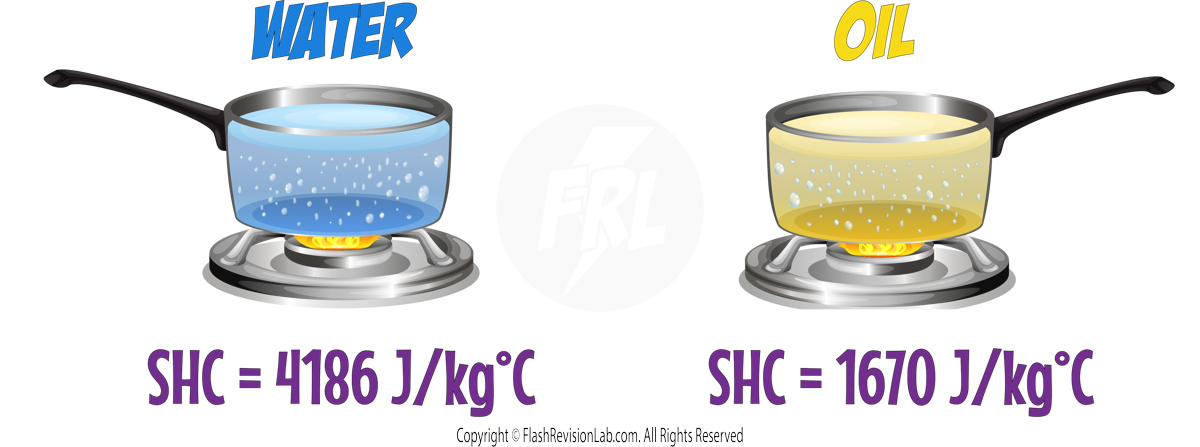
- Water has a SPECIFIC HEAT CAPACITY of 4186 J/kg°C. This means it takes 4186 Joules to heat 1 kg of water by 1°C.
- Oil has a lower SPECIFIC HEAT CAPACITY of 1670 J/kg°C, so it needs LESS energy to heat up.
- This means the oil heats up and cools down more easily than water.
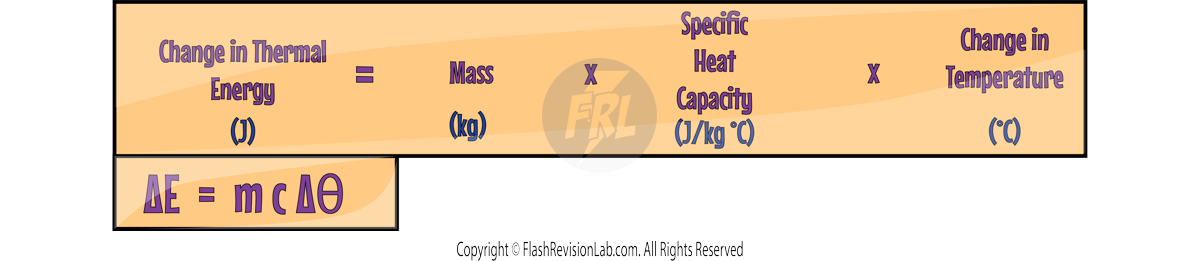
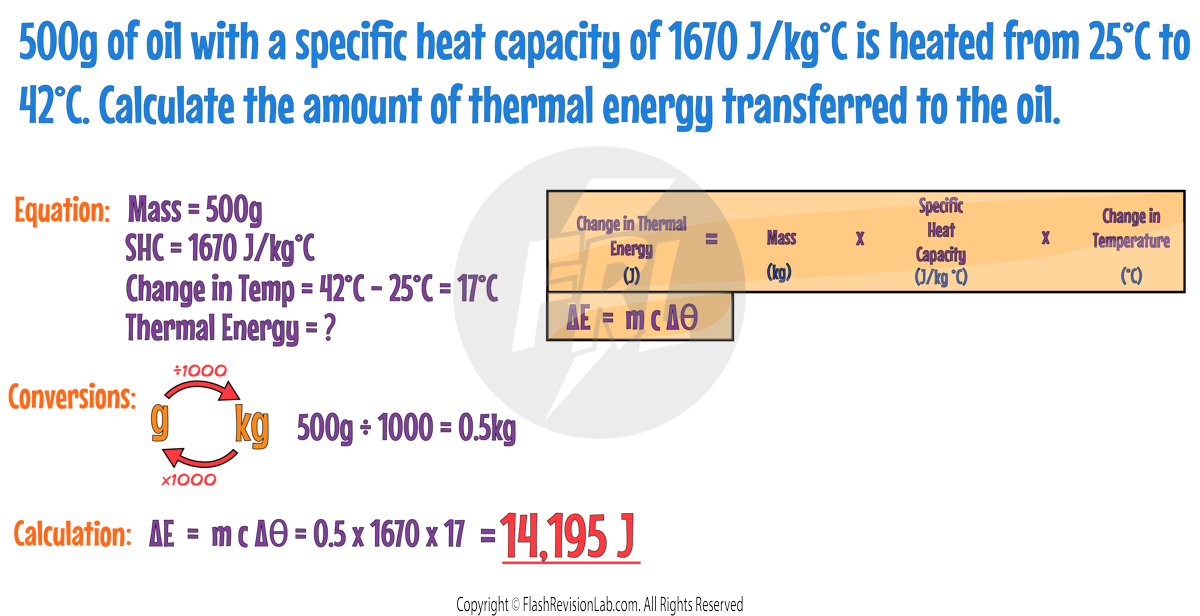
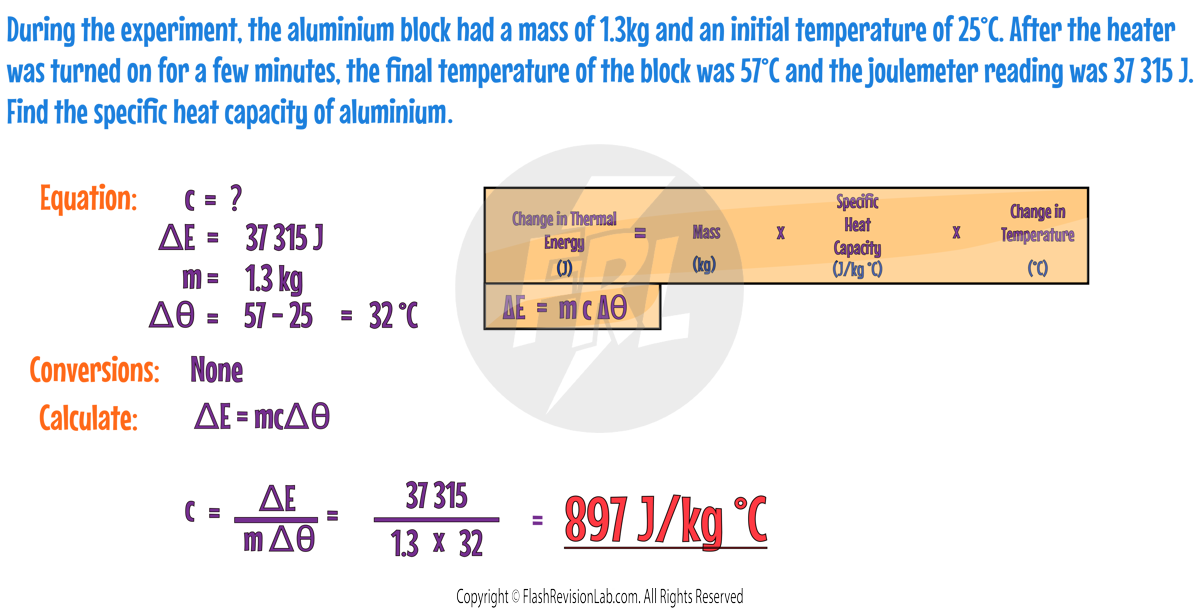
CALCULATING THERMAL ENERGY
To calculate the change in thermal energy of a system, you can use the formula:
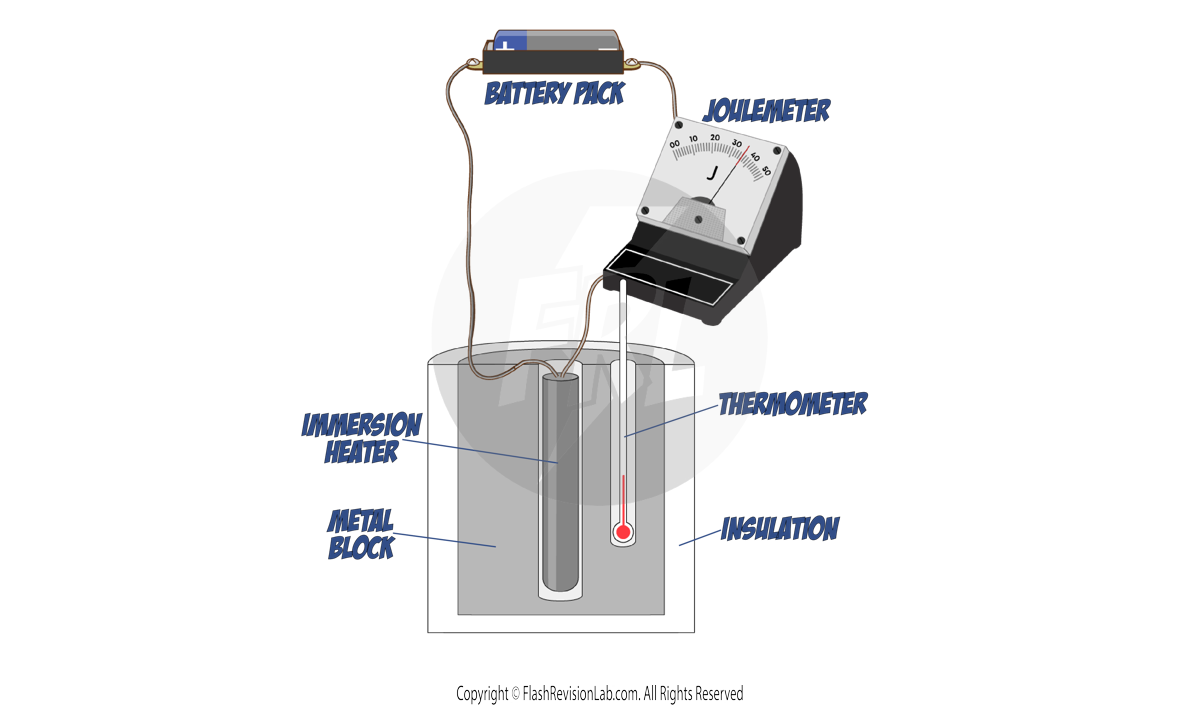
Required Practical: Specific Heat Capacity
This experiment shows you how to measure the SPECIFIC HEAT CAPACITY of a substance like aluminium.
EQUIPMENT NEEDED
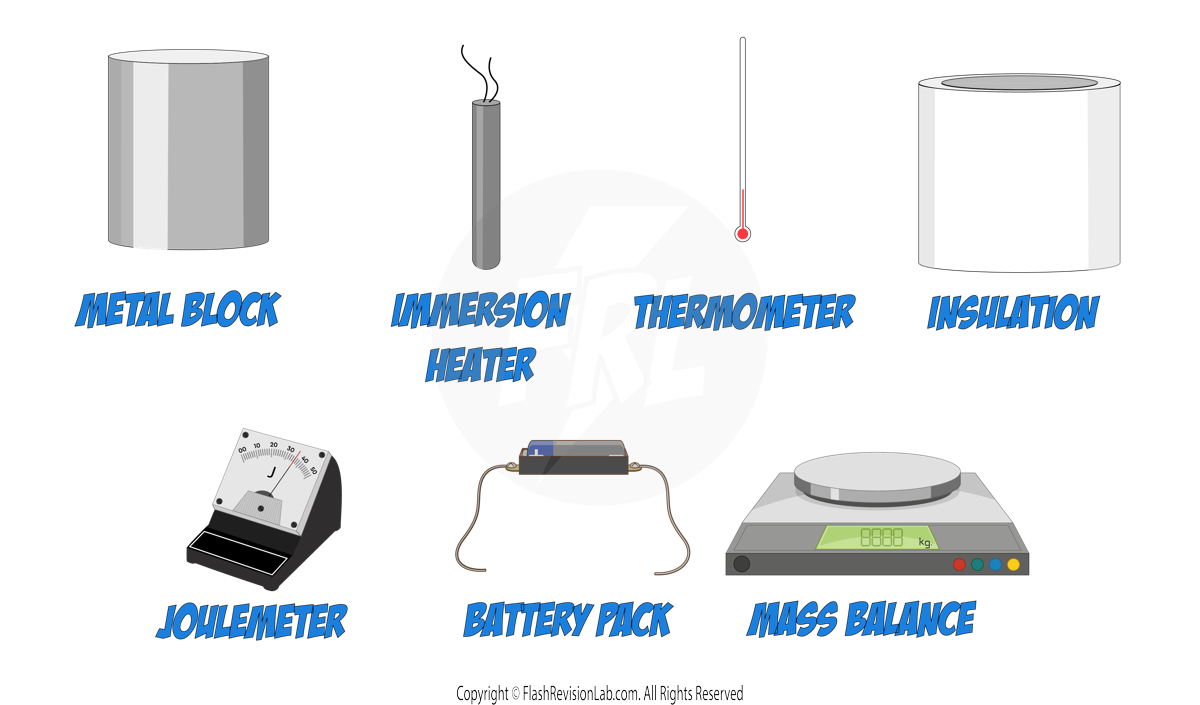
- METAL BLOCK: Made of the material you are testing, like aluminium, with holes for the heater and thermometer.
- IMMERSION HEATER: To provide heat to the metal block.
- THERMOMETER: To measure the temperature of the metal block.
- INSULATION: To minimise heat loss from the metal block.
- JOULEMETER: To measure the amount of energy used.
- MASS BALANCE: To measure the mass of the metal block.
- BATTERY PACK: To supply power to the immersion heater.
PROCEDURE
- MEASURING MASS:
- Use the MASS BALANCE to measure the mass of the metal block. Record the value.
- SETTING UP THE EXPERIMENT:
- Place the metal block into insulation and insert both the IMMERSION HEATER and THERMOMETER into the appropriate holes in the block.
- Connect the IMMERSION HEATER to the BATTERY PACK and the JOULEMETER.
- HEATING AND MEASURING:
- Turn on the IMMERSION HEATER to start heating the metal block.
- Record the initial temperature from the THERMOMETER and the initial energy from the JOULEMETER.
- CALCULATING SPECIFIC HEAT CAPACITY:
- Once you have finished heating, turn OFF the heater.
- Record the final temperature and energy readings.
- Use the SPECIFIC HEAT CAPACITY equation.
Here's an example of a calculation you can do after this experiment:
You can do a similar experiment for finding out the specific heat capacity of a liquid.

Use a polystyrene cup with a lid to minimise heat lost to the surroundings, to make calculations more ACCURATE.
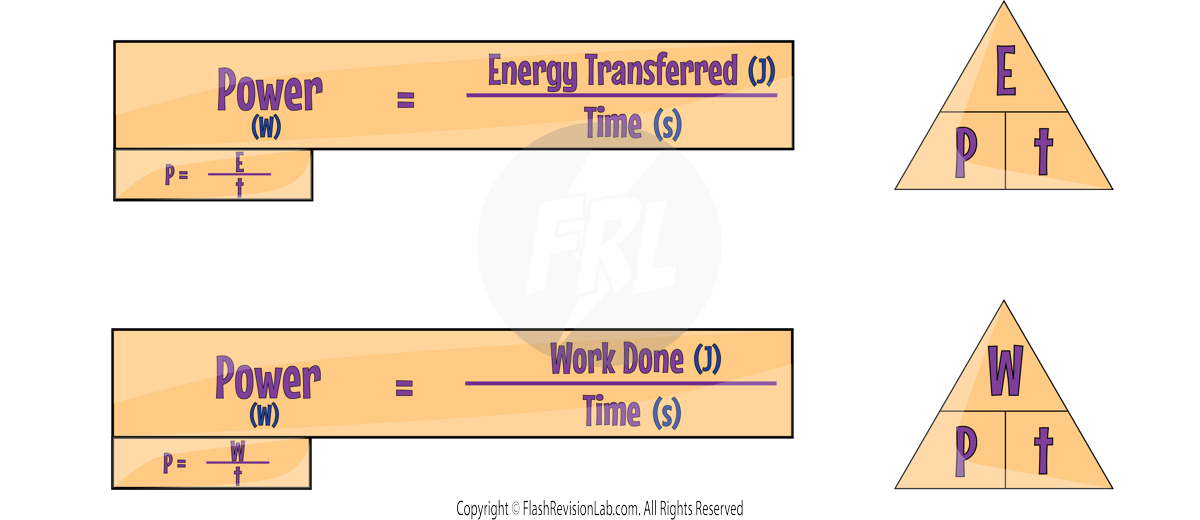
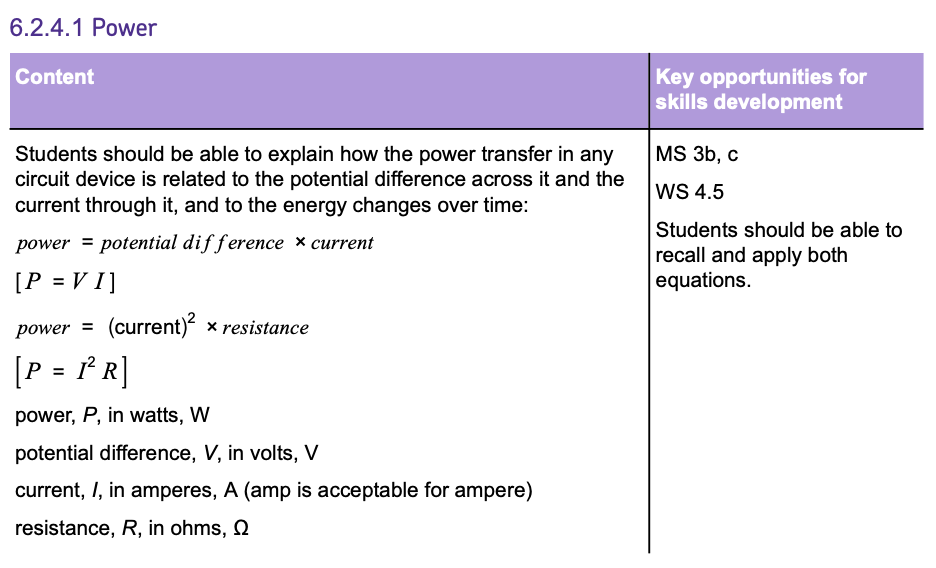
Power
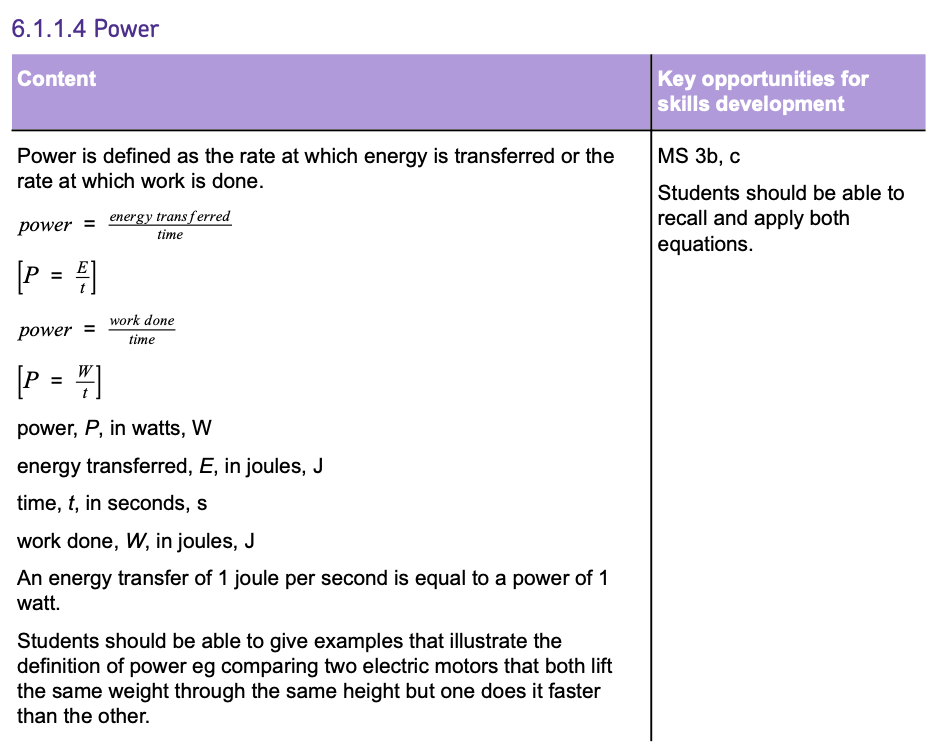
POWER is the RATE at which energy is being TRANSFERRED or WORK is being done.
The equations for power can be written as:
UNITS:
- Power, denoted by P, is measured in Watts (W).
- Energy Transferred, denoted by E, is measured in Joules (J).
- Work Done, denoted by W, is measured in Joules (J).
- Time, denoted by t, is measured in Seconds (s).
One Watt is the power from an energy transfer of one Joule per second.
If a device is rated at 1 Watt, it means that it transfers energy at a rate of 1 Joule per second.
PRACTICAL APPLICATION
- Comparing two devices, like electric motors, is a good way to understand POWER.
- Let's say we have a 8W and 2W motor lifting a 1kg weight up a height of 1m:
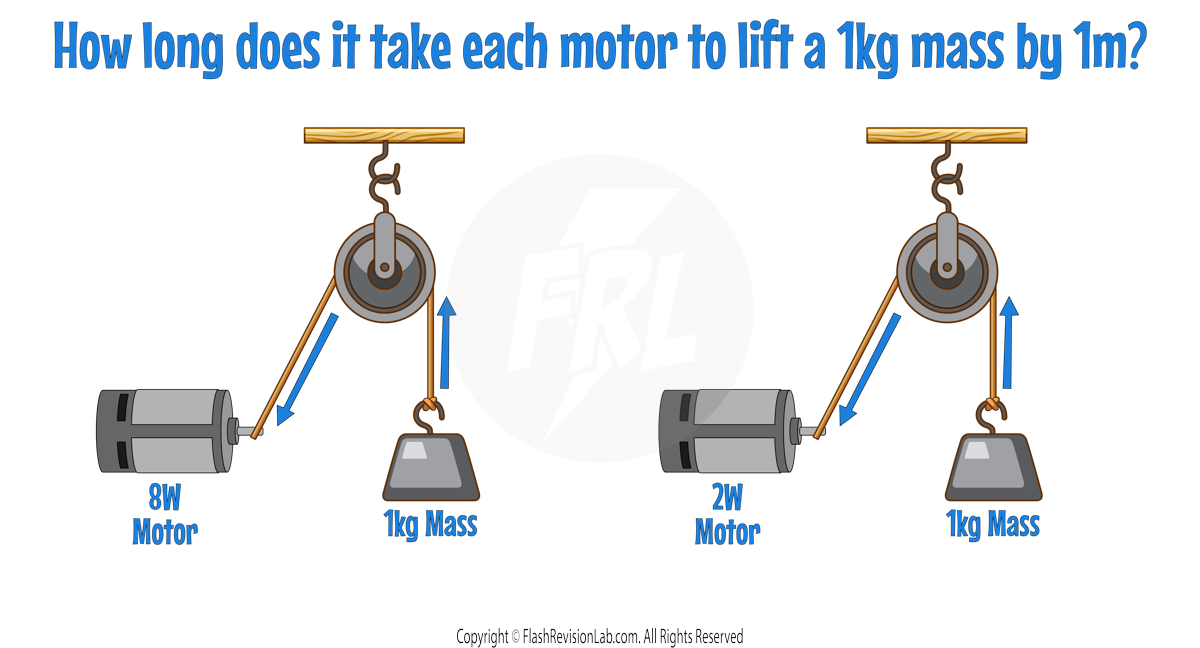
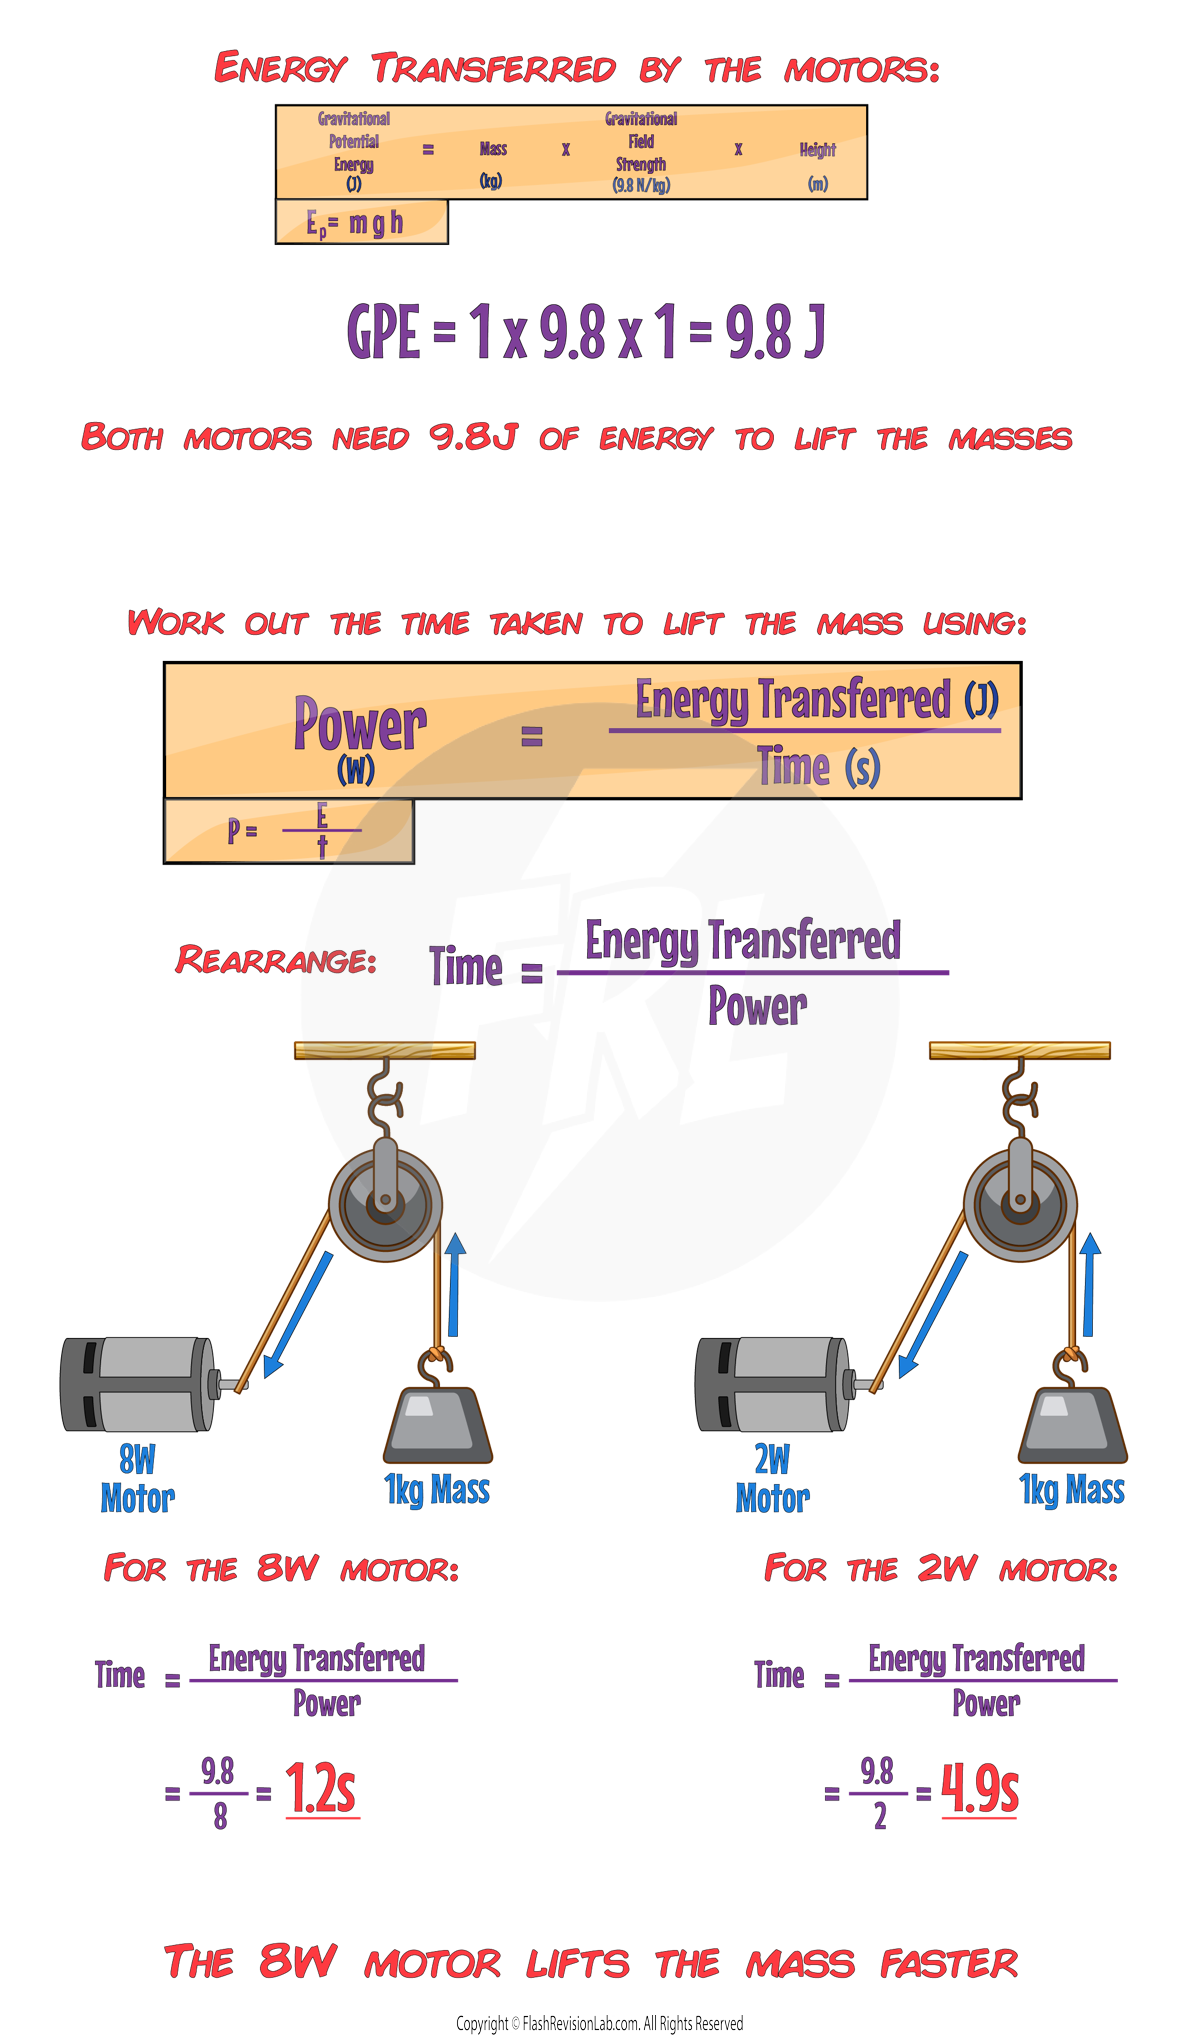
- If both devices lift the same weight to the same height, the one that does it faster has a HIGHER POWER because it TRANSFERS energy at a FASTER rate.
Energy Transfer in a System
The principle of CONSERVATION OF ENERGY states that energy cannot be created or destroyed, only transferred between different ENERGY STORES.
Energy Dissipation
However, not all energy transfers are useful. DISSIPATION of energy refers to energy that is wasted or not usefully employed by a device.
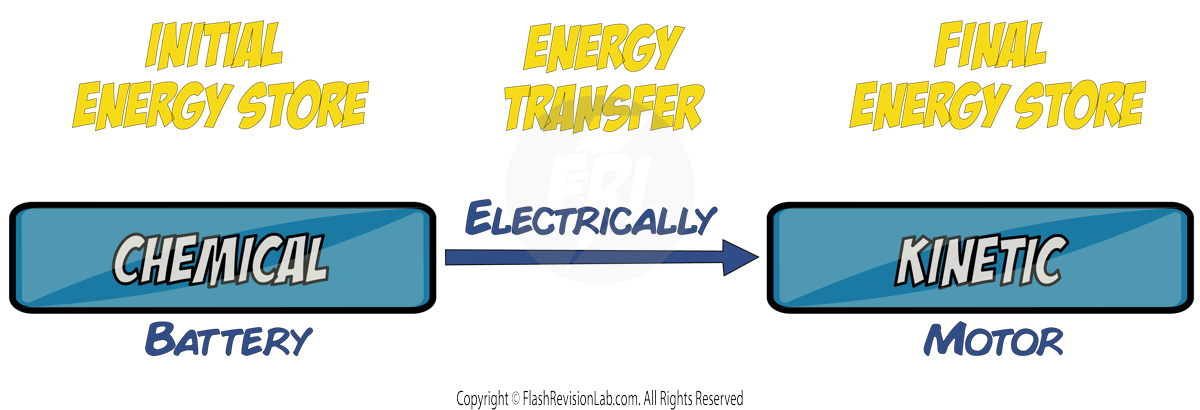
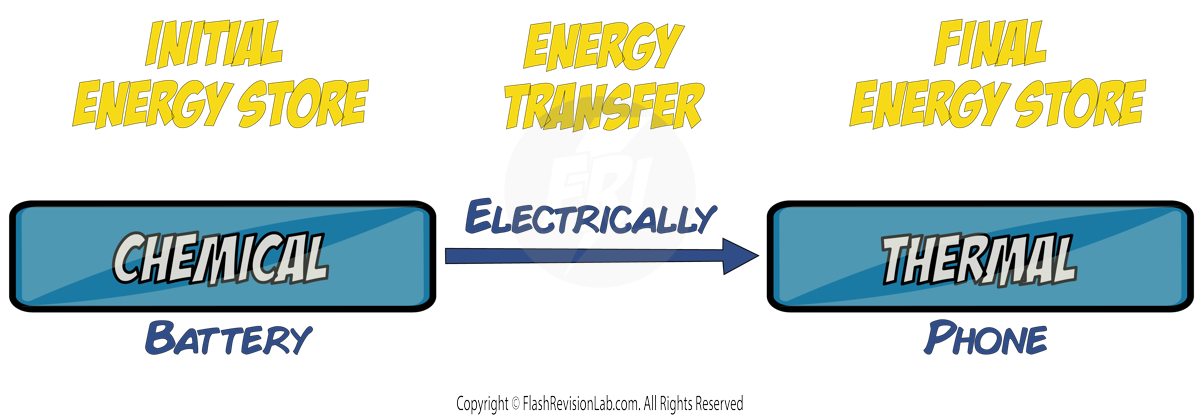
An example of a beneficial transfer is when your phone rings and VIBRATES.

Energy moves from the CHEMICAL energy store of the battery, ELECTRICALLY, to the KINETIC energy store of the phone's motor, causing it to vibrate.
But sometimes a phone gets WARM during use. This is because energy is moving from the battery's CHEMICAL store, ELECTRICALLY, to the THERMAL energy store of the phone itself – this is NOT useful to the phone, and wastes energy. This is an example of DISSIPATION of energy.
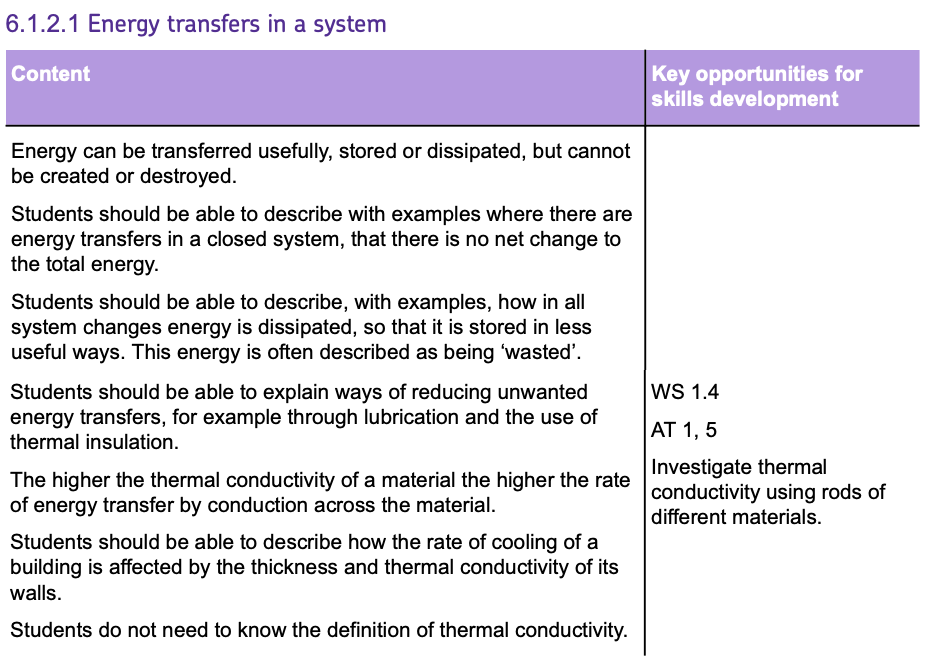
Reducing Unwanted Energy Transfers
To maximise efficiency and minimise costs, it's important to reduce unwanted energy transfers, especially the DISSIPATION of heat. This is often seen in houses, where heat loss can lead to higher bills.
To reduce these unwanted losses, you can install following in your house:
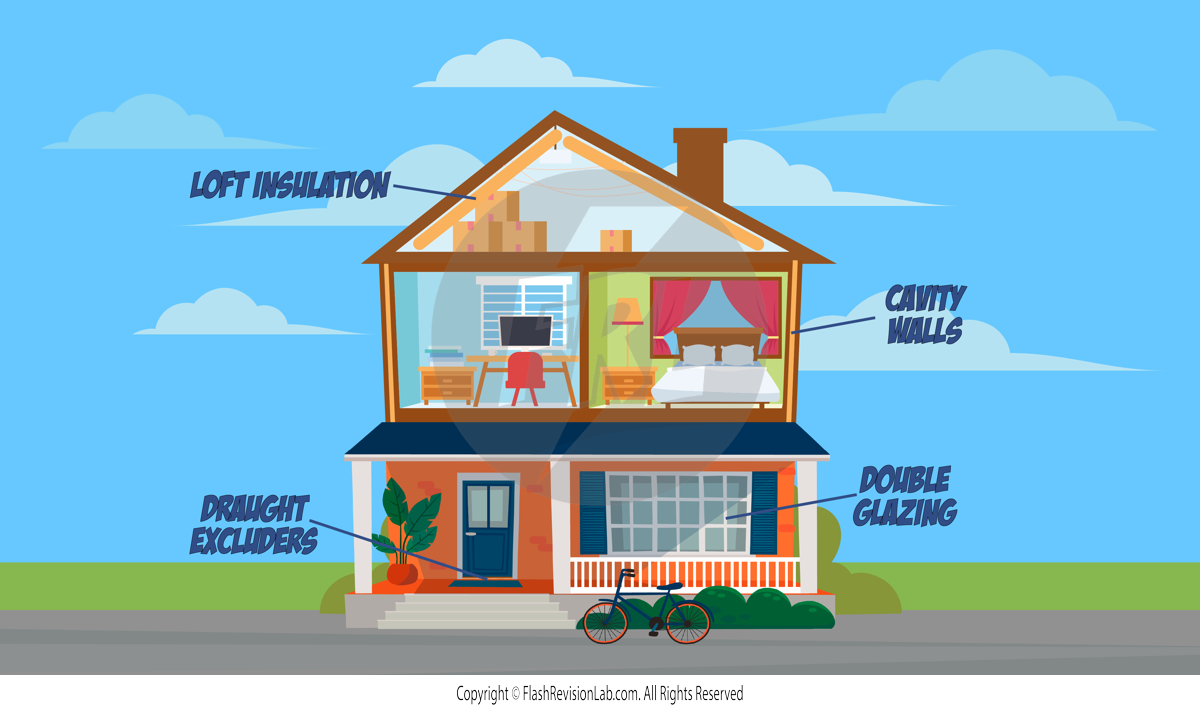
1. CAVITY WALLS:
- THERMAL CONDUCTIVITY is a measure of how well a material conducts heat. If a material has high thermal conductivity, it means heat can pass through it quickly. This is why metals, which have high thermal conductivity, feel cold to the touch; they are transferring heat away from your hand rapidly.
- When it comes to buildings, the rate at which a building loses heat is influenced by the THICKNESS of the walls and their THERMAL CONDUCTIVITY. Thick walls with low thermal conductivity are better at keeping heat inside, which is why insulation is so important in homes.
- If the walls are thin or made of materials with high thermal conductivity, the building will cool down quickly because heat escapes faster.
- To reduce heat losses even more, houses are constructed with two separate walls and an air gap between them, reducing energy transfer by CONDUCTION as air has a LOW CONDUCTIVITY. Filling this gap with INSULATION FOAM (which has an even lower conductivity) increases this effect even more.
2. LOFT INSULATION:
Made from materials with low thermal conductivity, loft insulation reduces energy loss through both CONDUCTION and CONVECTION.
CONVECTION occurs when liquids and gases are able to MOVE and transfer heat.
3. DOUBLE GLAZING WINDOWS:
By having two layers of glass with trapped gas between them, these windows lessen energy loss due to CONDUCTION and CONVECTION.
4. DRAUGHT EXCLUDERS:
Placed around doors and windows, they are designed to prevent hot air from escaping, thus reducing CONVECTION losses.
Minimising Frictional Forces
Another way to reduce unwanted energy transfers is by minimising FRICTIONAL FORCES.
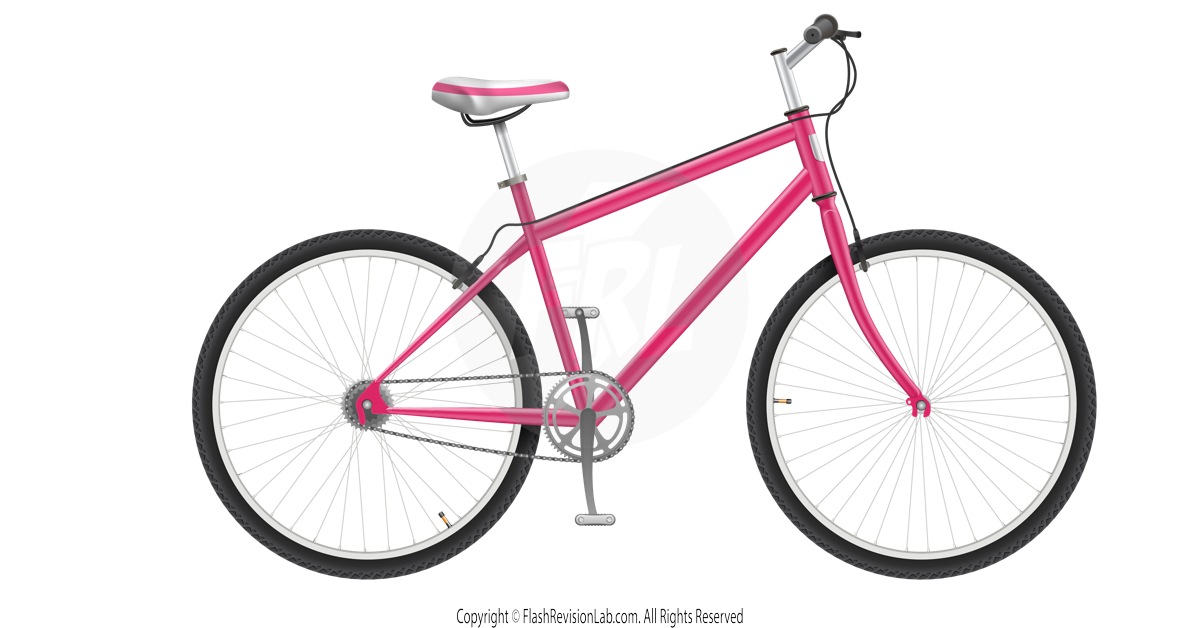
Take the example of a BICYCLE. As you ride, the chain moves over sprockets. This movement causes FRICTION between the chain links and the sprockets.
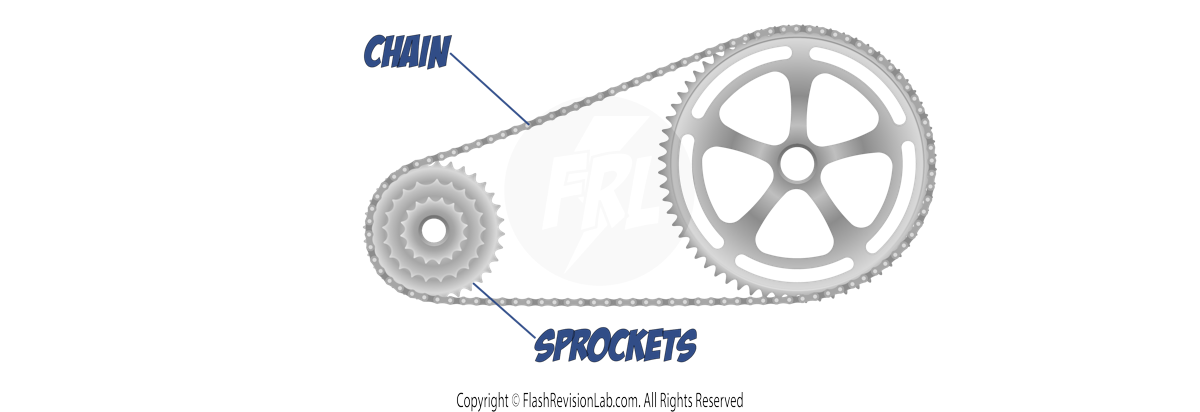
Friction converts some of the KINETIC energy, which should be moving the bike forward, into THERMAL ENERGY. That's energy not being used as intended and is, therefore, wasted.
To combat this, you can LUBRICATE the chain with oil. Lubrication reduces friction and allows for a smoother movement of the chain over the sprockets. This means more of the kinetic energy is used to propel the bike forward, making your ride more EFFICIENT.
Efficiency
When a device or object is going through an energy change, some of the energy that is inputted is TRANSFERRED USEFULLY and some is DISSIPATED or wasted.
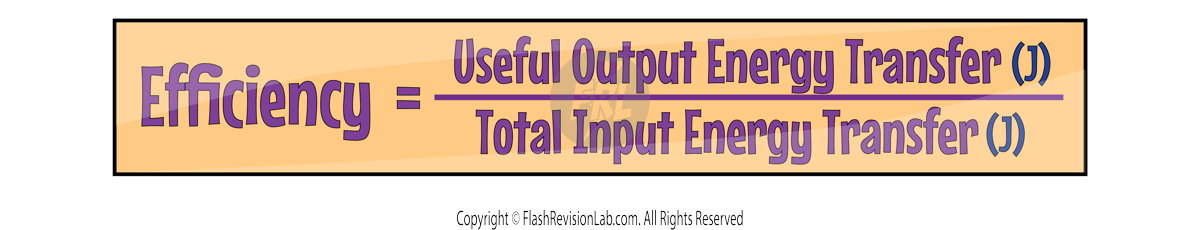
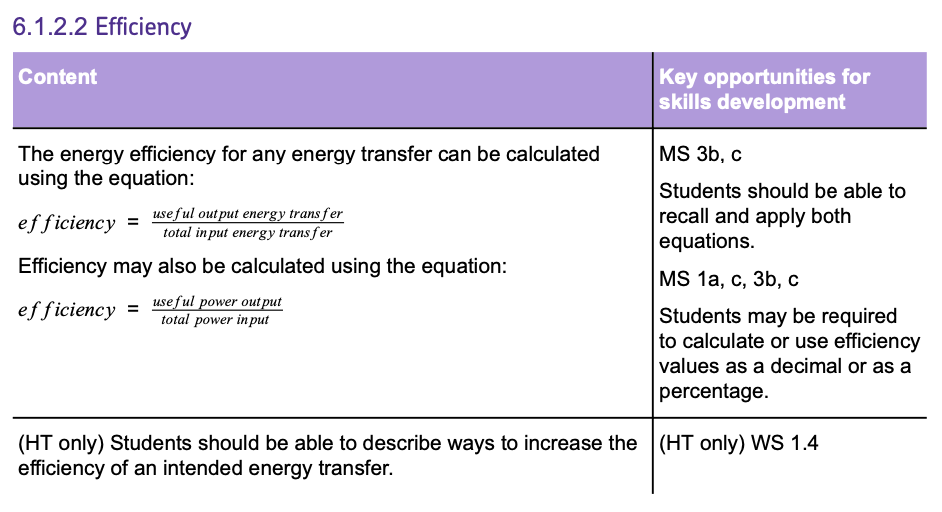
Efficiency is a ratio of the amount of useful energy that’s given out to the total amount of energy that was originally put in. The equation for this is:
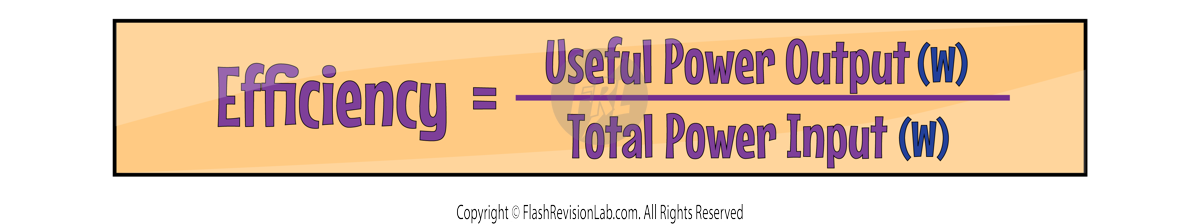
You can also rewrite the equation using power instead of energy to give you:
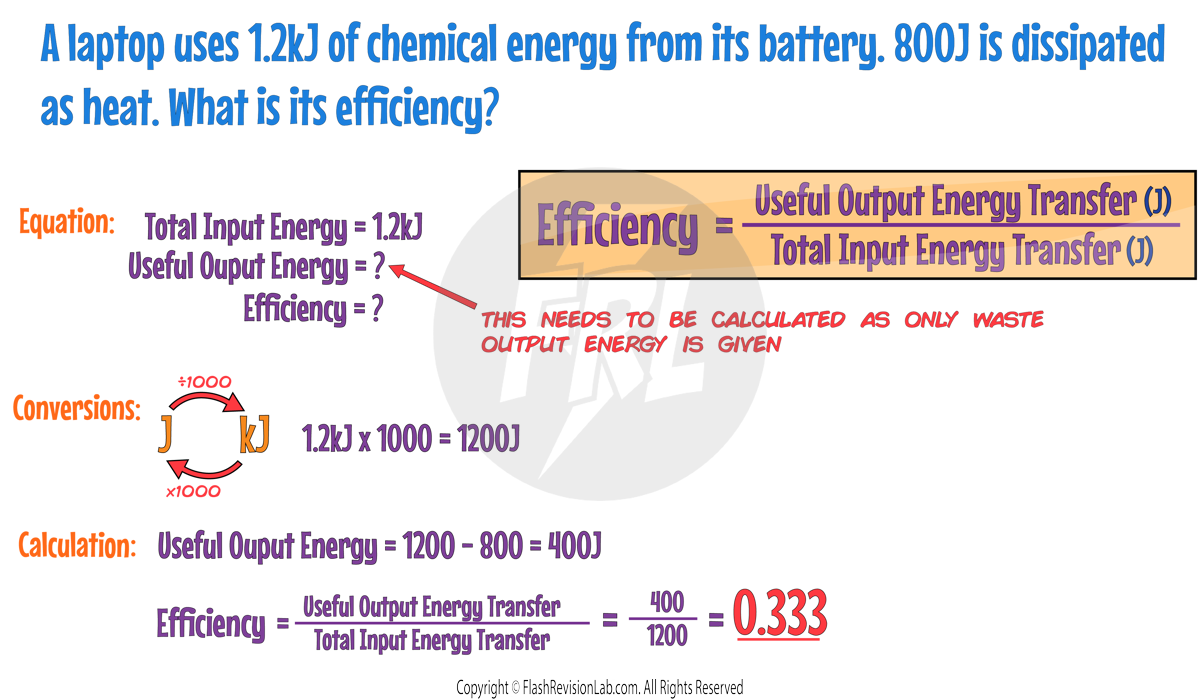
You can convert efficiency into percentages by multiplying by 100. For this example, this would give:
0.333 x 100 = 33.3%
Improving Efficiency
- The efficiency of a device can be improved by REDUCING wasted energy transfers.
- They waste energy mainly due to:
- Friction between their moving parts
- Air resistance
- Electrical resistance
- Sound
- Most of these lead to THERMAL energy being dissipated into the SURROUNDINGS. If you can minimise these, you can IMPROVE the EFFICIENCY of a device.
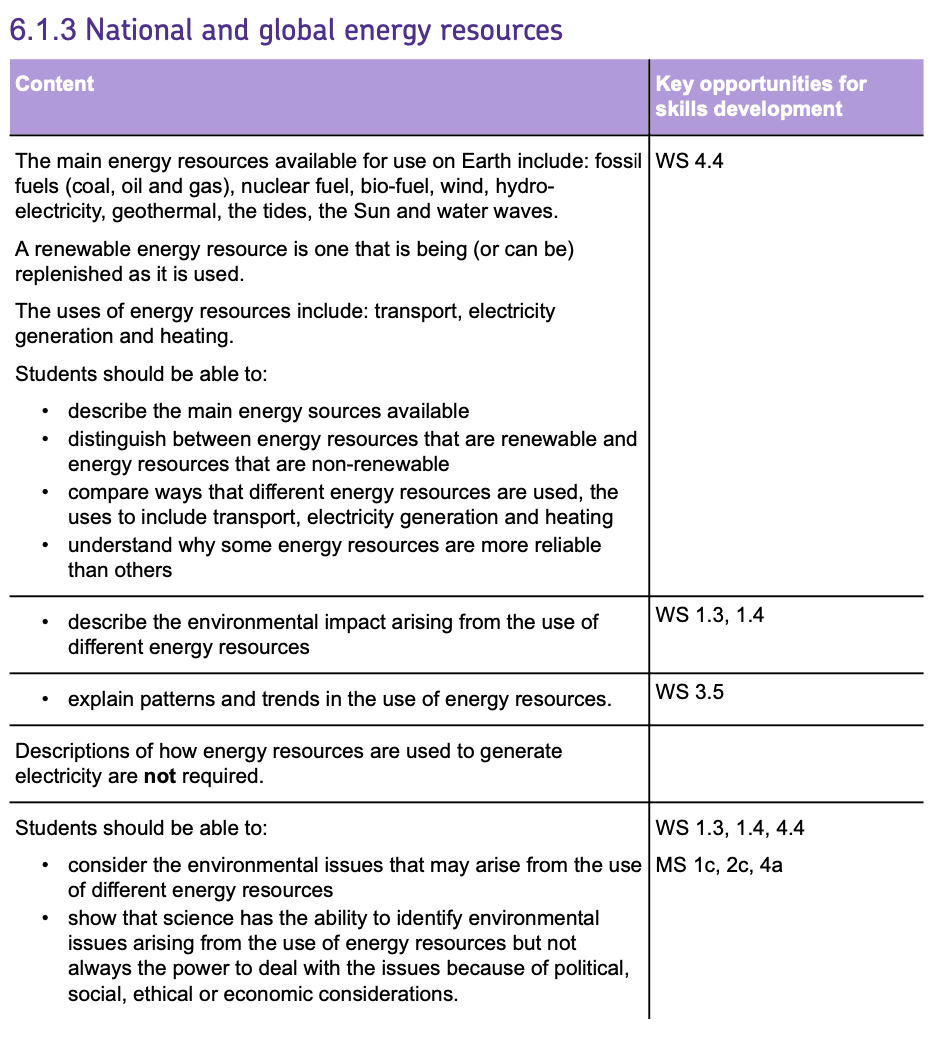
Energy Resources
Energy resources are used to GENERATE ELECTRICITY.
There are TWO types of ENERGY RESOURCES:
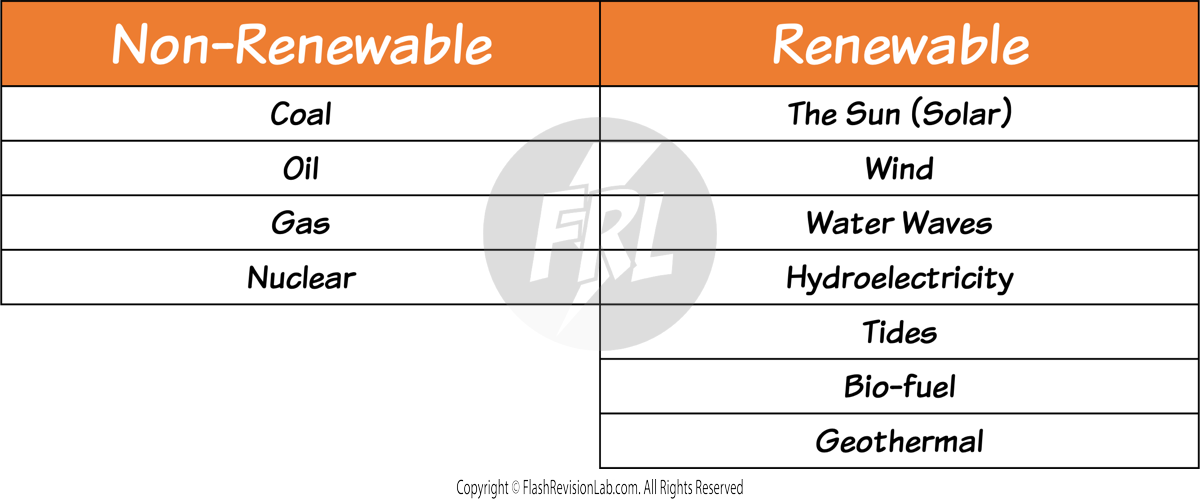
1. NON-RENEWABLE RESOURCES
- These are resources that we have a FINITE amount of, and will eventually RUN OUT of.
- They currently provide the majority of energy in the world.
- Their use usually results in ENVIRONMENTAL DAMAGE.
2. RENEWABLE RESOURCES
- These are resources that are REPLENISHABLE (will not run out).
- They do NOT produce much energy compared to NON-RENEWABLE resources.
- They have MINIMAL impact on the environment, however are generally less reliable than NON-RENEWABLE resources.
NON-RENEWABLE RESOURCES
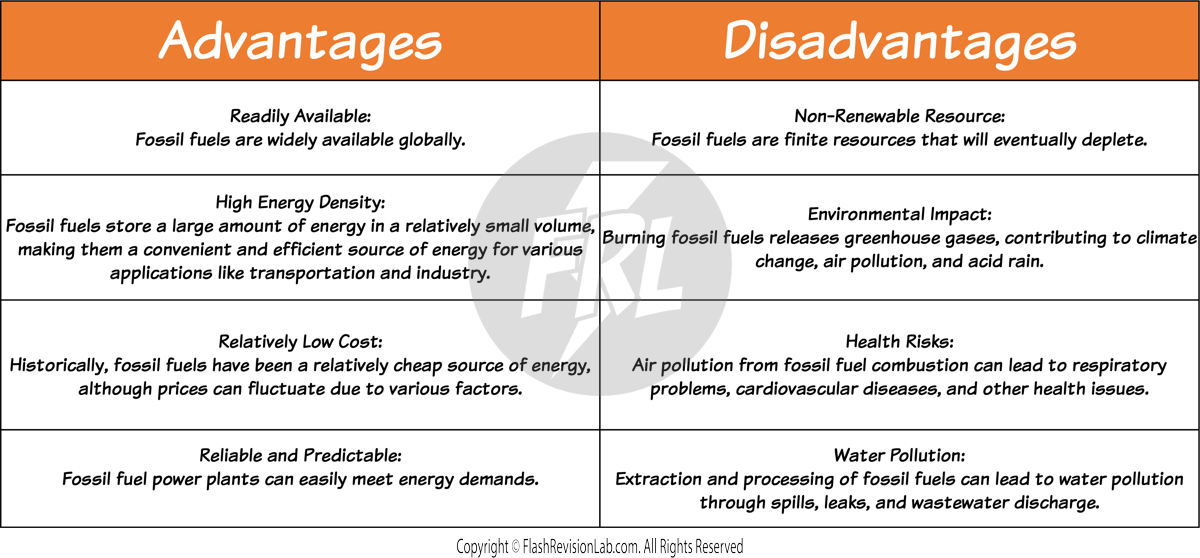
FOSSIL FUELS

FOSSIL FUELS are energy sources formed from the ancient remains of living organisms. They include COAL, OIL, and NATURAL GAS.
These fuels continue to be a major energy source worldwide due to their HIGH ENERGY CONTENT and ease of EXTRACTION.
Fossil fuels are burned for energy, which can then be used to GENERATE ELECTRICITY.
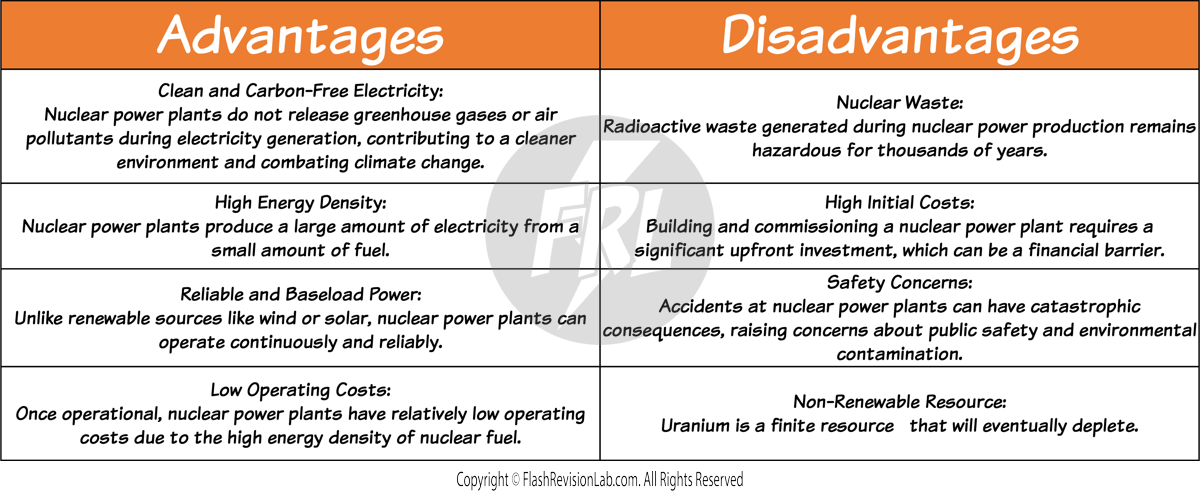
NUCLEAR FUEL

NUCLEAR POWER uses energy from atoms, particularly uranium or plutonium, through a process called nuclear fission.
This process releases a considerable amount of energy, and is then used to heat water, producing steam that drives turbines to generate electricity.
RENEWABLE RESOURCES
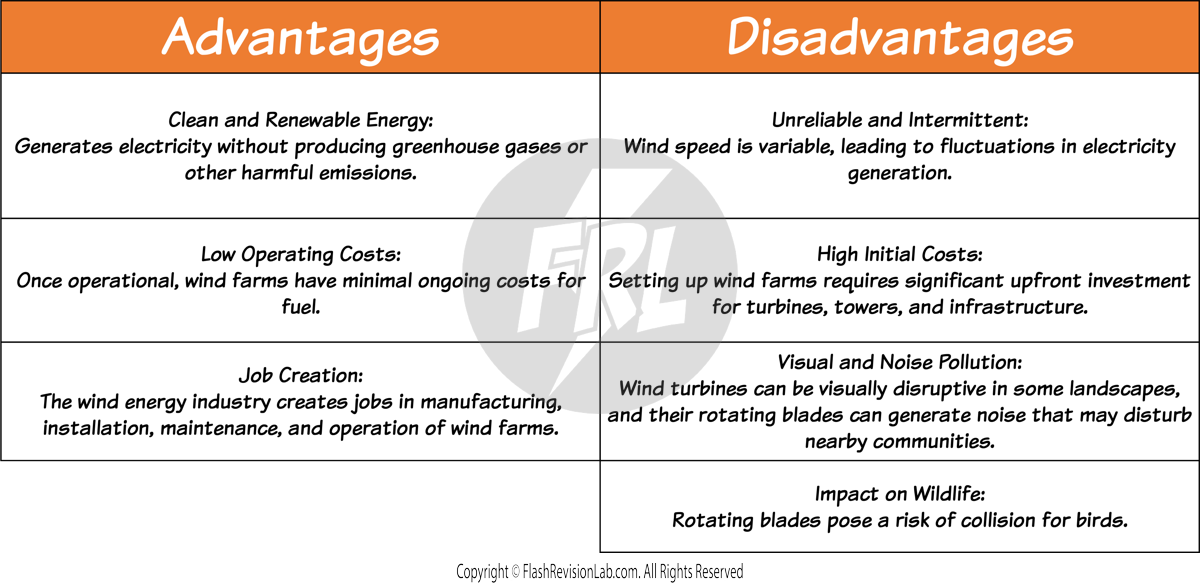
WIND POWER

Wind turbines use the kinetic energy from the wind to generate electricity. As the wind blows, it turns the blades of the turbine, which spins a generator inside the turbine's housing.
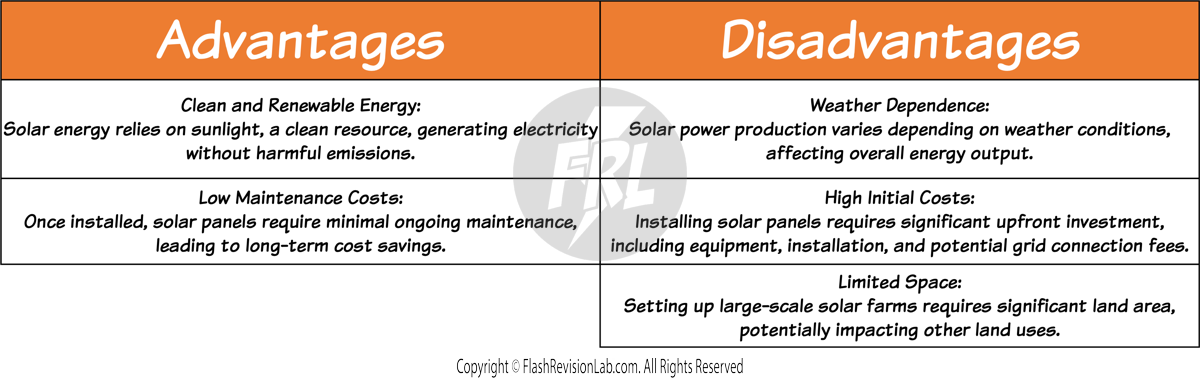
SOLAR CELLS

Solar cells, or photovoltaic cells in solar panels convert sunlight directly into electricity.
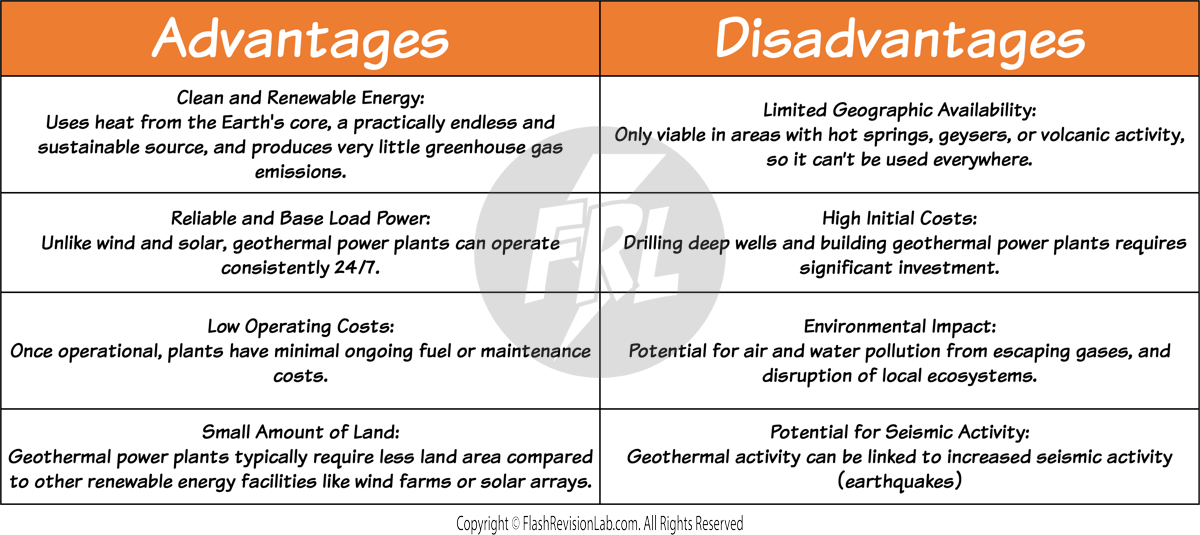
GEOTHERMAL POWER
Geothermal energy harnesses heat from the Earth's interior. Water or other fluids are pumped down to the hot regions, become heated, then return to the surface as steam or hot water. This steam rotates a turbine connected to a generator, producing electricity.
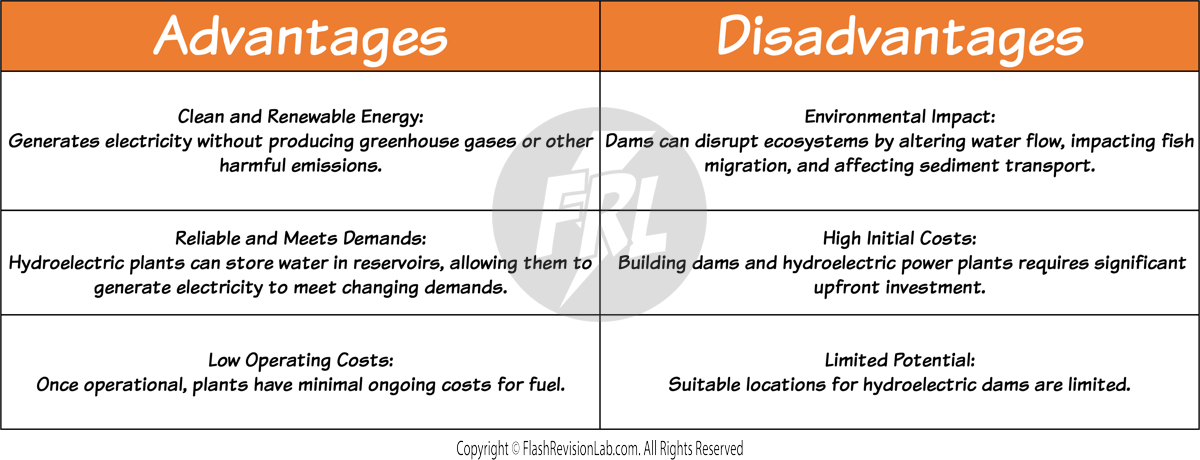
HYDRO-ELECTRIC POWER

This involves flooding a valley for the creation of large water reservoirs behind dams.
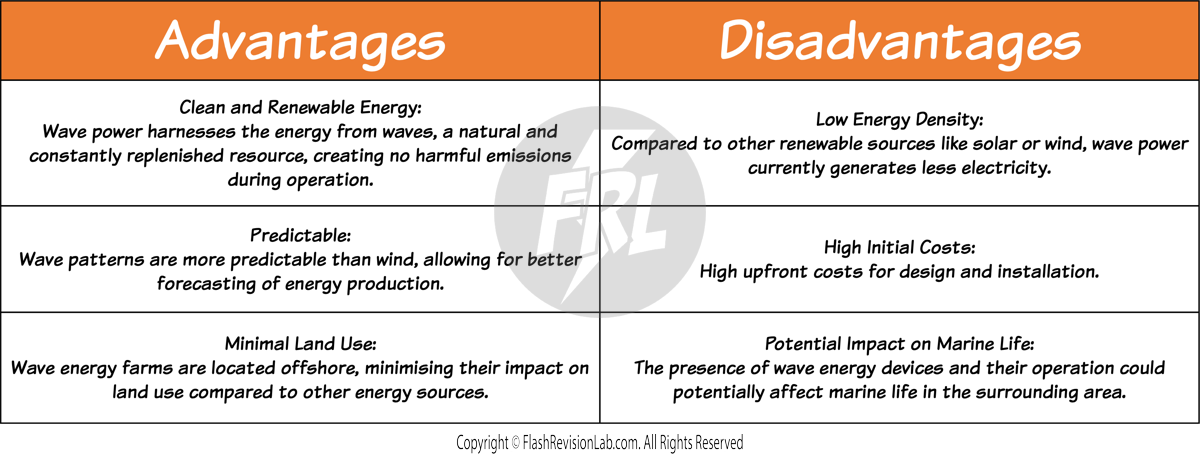
WAVE POWER

This method utilises small wave-powered turbines located around coasts.
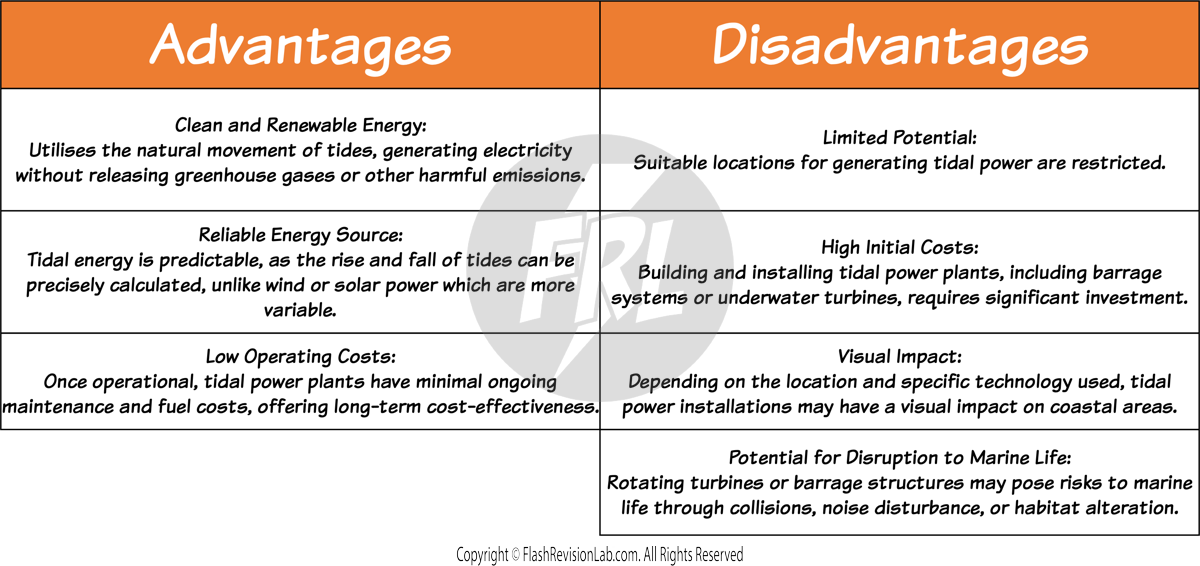
TIDAL BARRAGES

The tides of the oceans go up and down due to the gravitational pull of the Moon and Sun.
Tidal barrages are constructed across rivers, with turbines turning by using the energy from tidal movements.
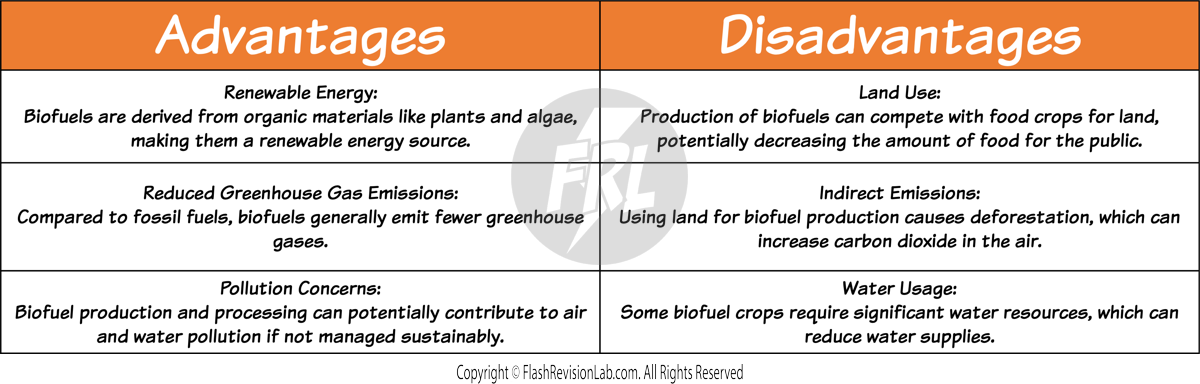
Bio-Fuel

Made from plants and waste, bio-fuels are renewable energy resources that can be produced from organic material.
They are considered CARBON NEUTRAL because the plants they're made from absorb CO2 as they grow, which is then released when burned. This means there is no overall increase in CO2 in the atmosphere.
Energy for Transport and Heating
Energy resources are not just used for electricity generation. They can also be used for TRANSPORT and HEATING.
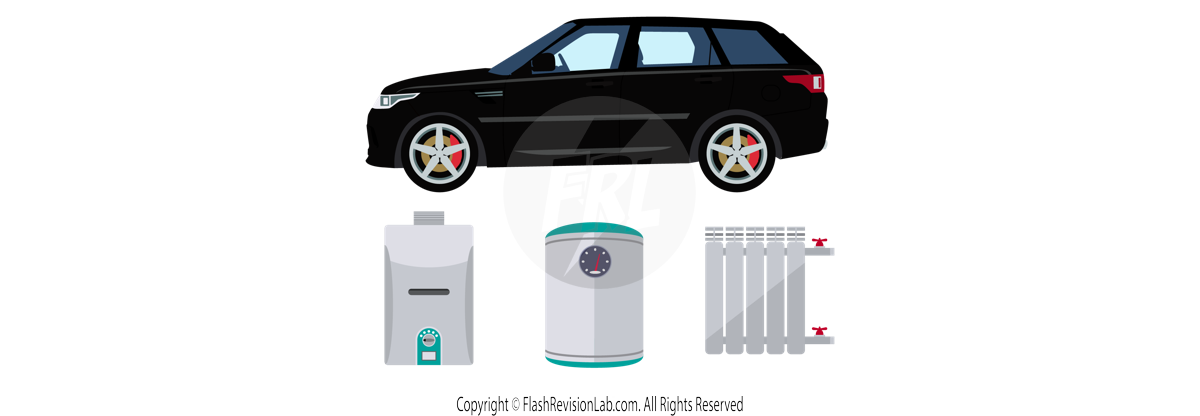
USING ENERGY FOR TRANSPORT
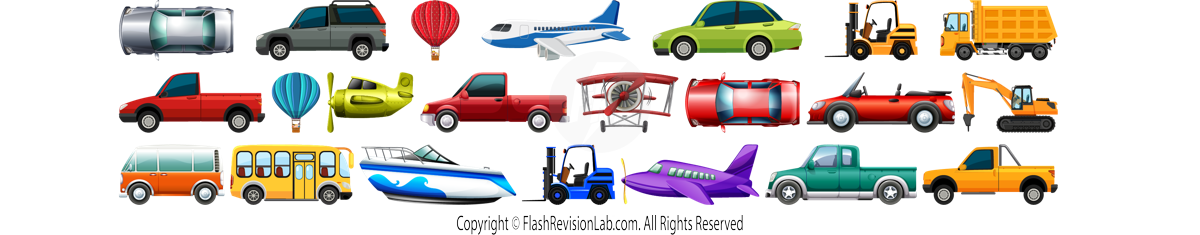
- NON-RENEWABLE: Vehicles predominantly run on PETROL and DIESEL, derived from OIL.
- RENEWABLE: Vehicles can use BIO-FUEL or a mix of bio-fuel and petrol or diesel. Electric trains and cars use electricity that can be generated from renewable sources.
USING ENERGY FOR HEATING

- NON-RENEWABLE: The most common non-renewable resource for heating is NATURAL GAS, used in BOILERS to warm water, which then heats homes through RADIATORS.
- RENEWABLE: GEOTHERMAL sources can heat water for use in radiators. SOLAR water heaters use the Sun's energy, and heat pumps use heat from the ground or air, both of which are powered by renewable energy.
SCIENCE & ENVIRONMENTAL CHALLENGES

SCIENCE plays a crucial role in pinpointing environmental problems caused by energy use. Scientists use RESEARCH and MONITORING to uncover how different energy resources affect the planet. They can detect issues like pollution and suggest ways to lessen these effects.
For instance, CARBON CAPTURE TECHNOLOGY is a method to trap CO2 emissions from factories before they reach the atmosphere, helping to combat GLOBAL WARMING. Similarly, science can propose safer ways to handle NUCLEAR WASTE, which remains hazardous for thousands of years, to prevent soil and water contamination.
Yet, solving environmental problems isn’t just about having the scientific know-how. It involves navigating through various other factors:
-
POLITICAL: Governments need to create and enforce LAWS that protect the environment. This means they might limit harmful emissions or support CLEAN ENERGY PROJECTS.
-
SOCIAL: People have to back efforts to use energy wisely and support green initiatives. Public opinion can push for changes like RECYCLING PROGRAMMES or buying ELECTRIC CARS.
-
ETHICAL: It's about being FAIR. It's not right if one country gets all the clean energy while another suffers pollution. Or if future generations inherit a damaged earth because of our energy choices today.
-
ECONOMIC: Environmental solutions must be COST-EFFECTIVE. If a green technology is too expensive, it won’t be used widely. Economies need solutions that are AFFORDABLE to make a lasting change.
Science gives us the tools to identify and fix environmental issues from energy use. However, for these solutions to work, they need to be backed by supportive policies, public approval, moral responsibility, and economic practicality.
Circuit Components and Their Symbols
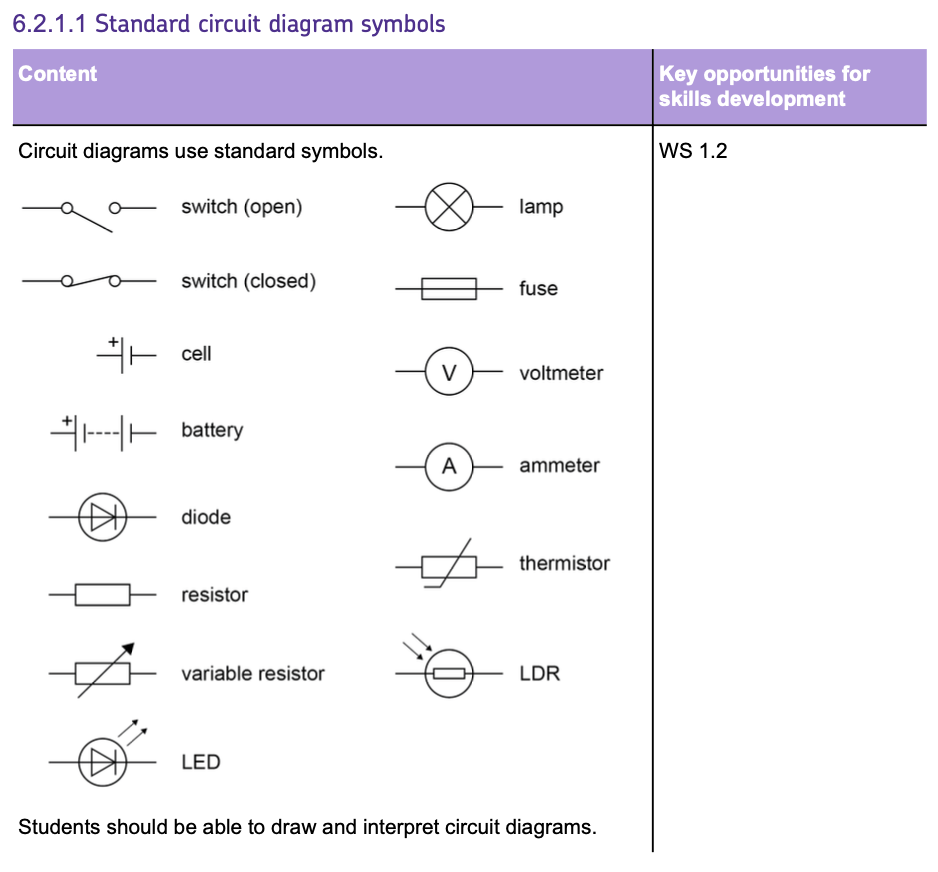
Components are used in constructing electrical circuits.
Here’s every circuit symbol that can come up in your exams:
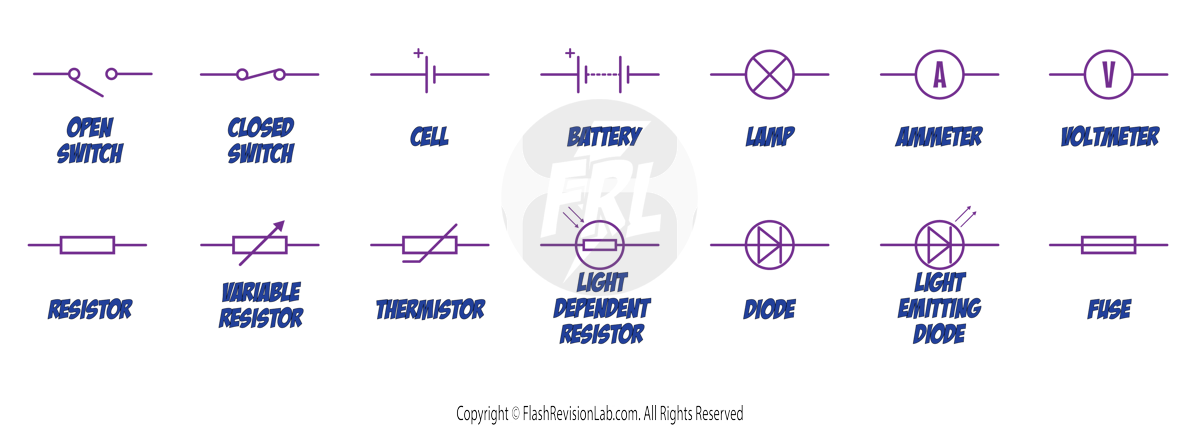
- OPEN SWITCH: Makes the circuit NOT complete and current cannot flow.
- CLOSED SWITCH: COMPLETES the circuit and allows current to pass.
- CELL: Indicates a single cell battery that provides the potential difference (voltage) needed for the current to flow.
- BATTERY: A combination of cells, supplying electricity to the circuit.
- LAMP: Illuminates when current passes through it.
- AMMETER: Used to MEASURE the CURRENT flowing through a circuit; it is always connected in SERIES.
- VOLTMETER: MEASURES the POTENTIAL DIFFERENCE (voltage) across a component and is connected in PARALLEL.
- RESISTOR: Indicates a component that opposes the flow of current, introducing RESISTANCE to the circuit.
- VARIABLE RESISTOR: A resistor whose RESISTANCE can be ADJUSTED. It is used to CONTROL CURRENT flow.
- THERMISTOR: A temperature-dependent resistor, meaning its RESISTANCE CHANGES with TEMPERATURE.
- LIGHT DEPENDENT RESISTOR (LDR): A resistor that CHANGES its RESISTANCE based on the LIGHT INTENSITY it's exposed to.
- DIODE: Allows CURRENT to flow in only ONE DIRECTION, ensuring components are protected from reverse current.
- LIGHT EMITTING DIODE (LED): Emits LIGHT when current flows through it and also allows current to flow in only ONE DIRECTION.
- FUSE: Acts as a SAFETY device that breaks the circuit if the CURRENT becomes too HIGH.
Electrical Charge and Current
ELECTRICAL CHARGE (Q)
A circuit works when CHARGE is allowed to FLOW through it.
Usually these charges are free moving ELECTRONS or IONS.
Units: COULOMBS (C)
ELECTRIC CURRENT (I)
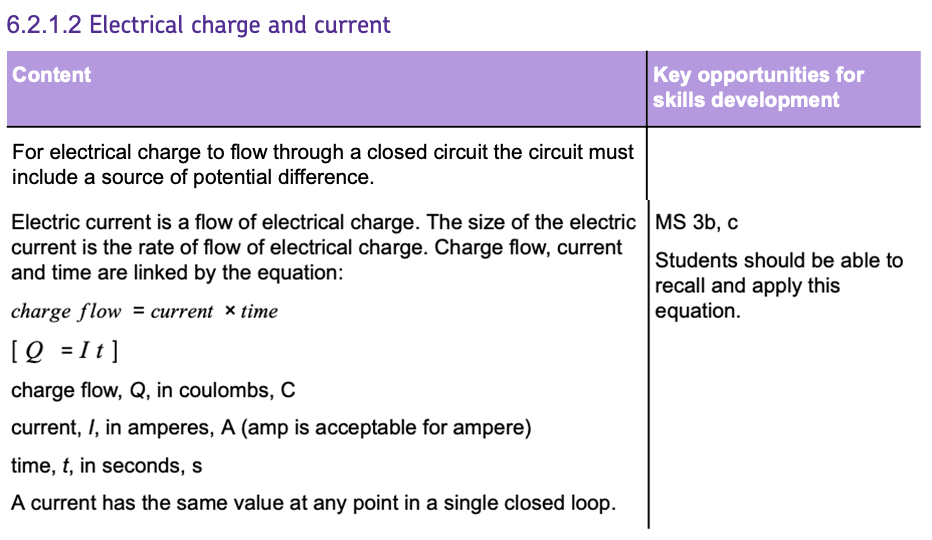
ELECTRIC CURRENT is the FLOW of electric CHARGE, quantified by the amount of charge passing a point in the circuit over time.
One of the key characteristics of current in a single closed loop is that it has the SAME VALUE at any point in the loop.
Units: AMPERES (A)
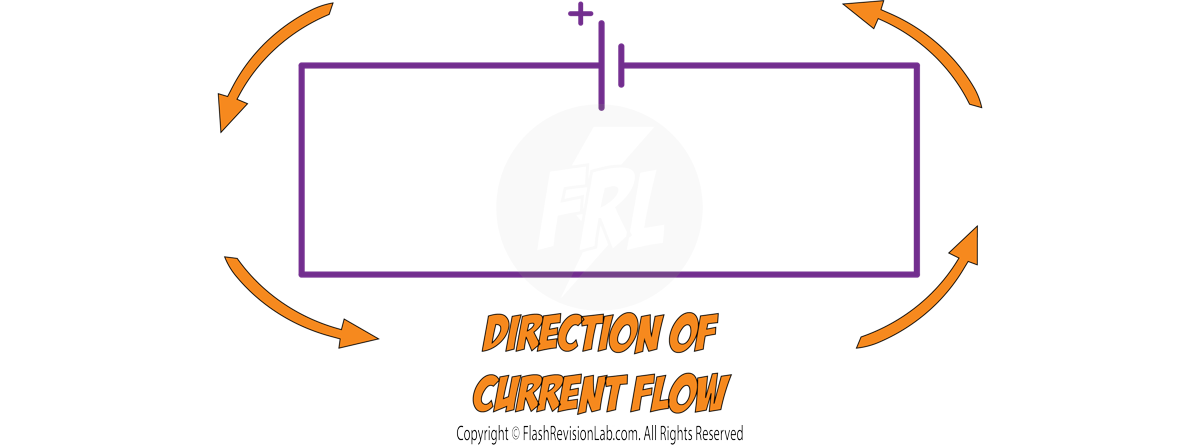
Current always flow AWAY from the POSITIVE side of the cell (the LONGER line)
The relationship between charge flow, current, and time is expressed by the equation:
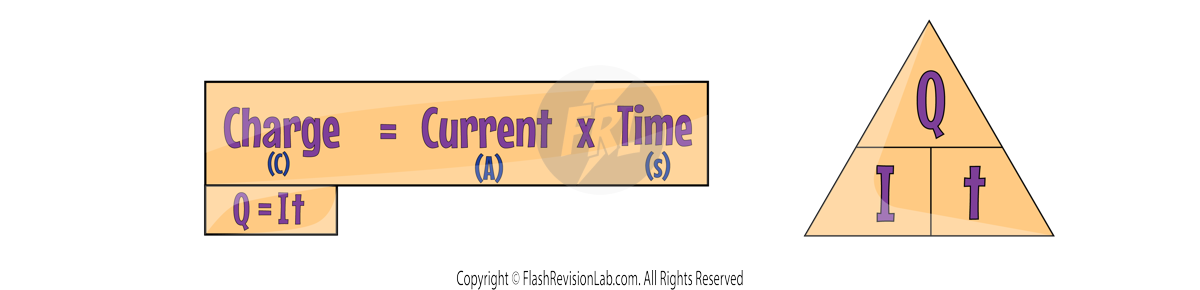
Where:
- Charge flow (Q) is in Coulombs (C).
- Current (I) is in Amperes (A); "Amp" is also acceptable.
- Time (t) is in Seconds (s).
Current, Resistance, and Potential Difference
POTENTIAL DIFFERENCE (V)
Also known as VOLTAGE, potential difference is the measure of ENERGY per unit of CHARGE, transferred between two points in a circuit.
Simply put, this is the driving force that PUSHES the current around the circuit.
Units: VOLTS (V).
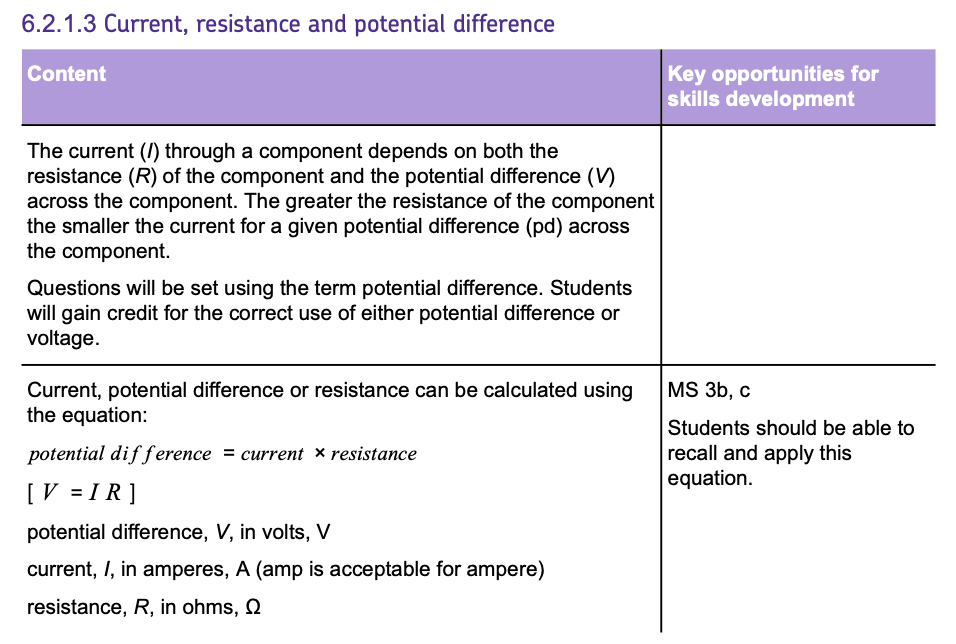
RESISTANCE (R)
RESISTANCE in a circuit SLOWS down the flow of CURRENT.
The HIGHER the resistance in a circuit, the LOWER the current, if the potential difference stays the same.
Units: OHMS (Ω).
OHM'S LAW
The relationship between current, resistance, and potential difference can be understood by OHM'S LAW, which states that the CURRENT is DIRECTLY PROPORTIONAL to the POTENTIAL DIFFERENCE.
A conductor that obeys this law is known as an OHMIC CONDUCTOR.
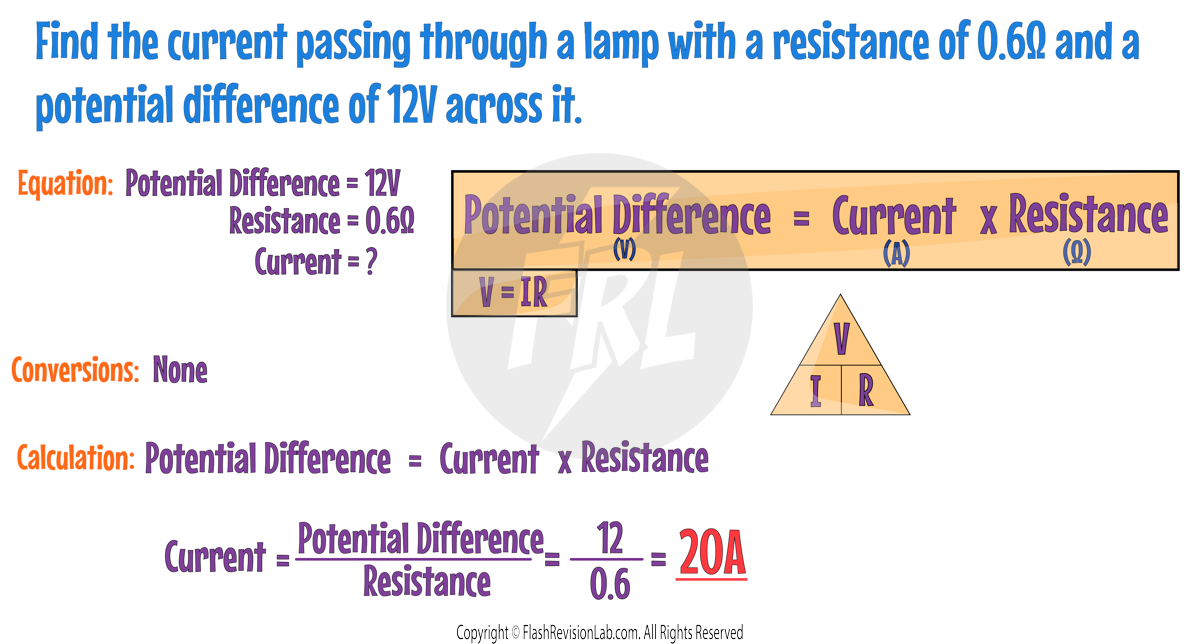
Here's the fundamental formula you'll need:
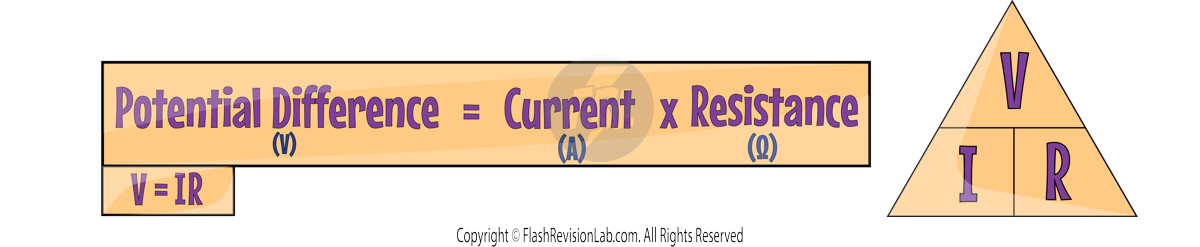
- V is the potential difference in Volts (V).
- I is the current in Amperes (A).
- R is the resistance in Ohms (Ω).
Required Practical: Investigating Resistance
These experiments can be carried out to see how RESISTANCE (R) in an electrical circuit is influenced by factors like the LENGTH OF THE WIRE and the COMBINATION OF RESISTORS in the circuit.
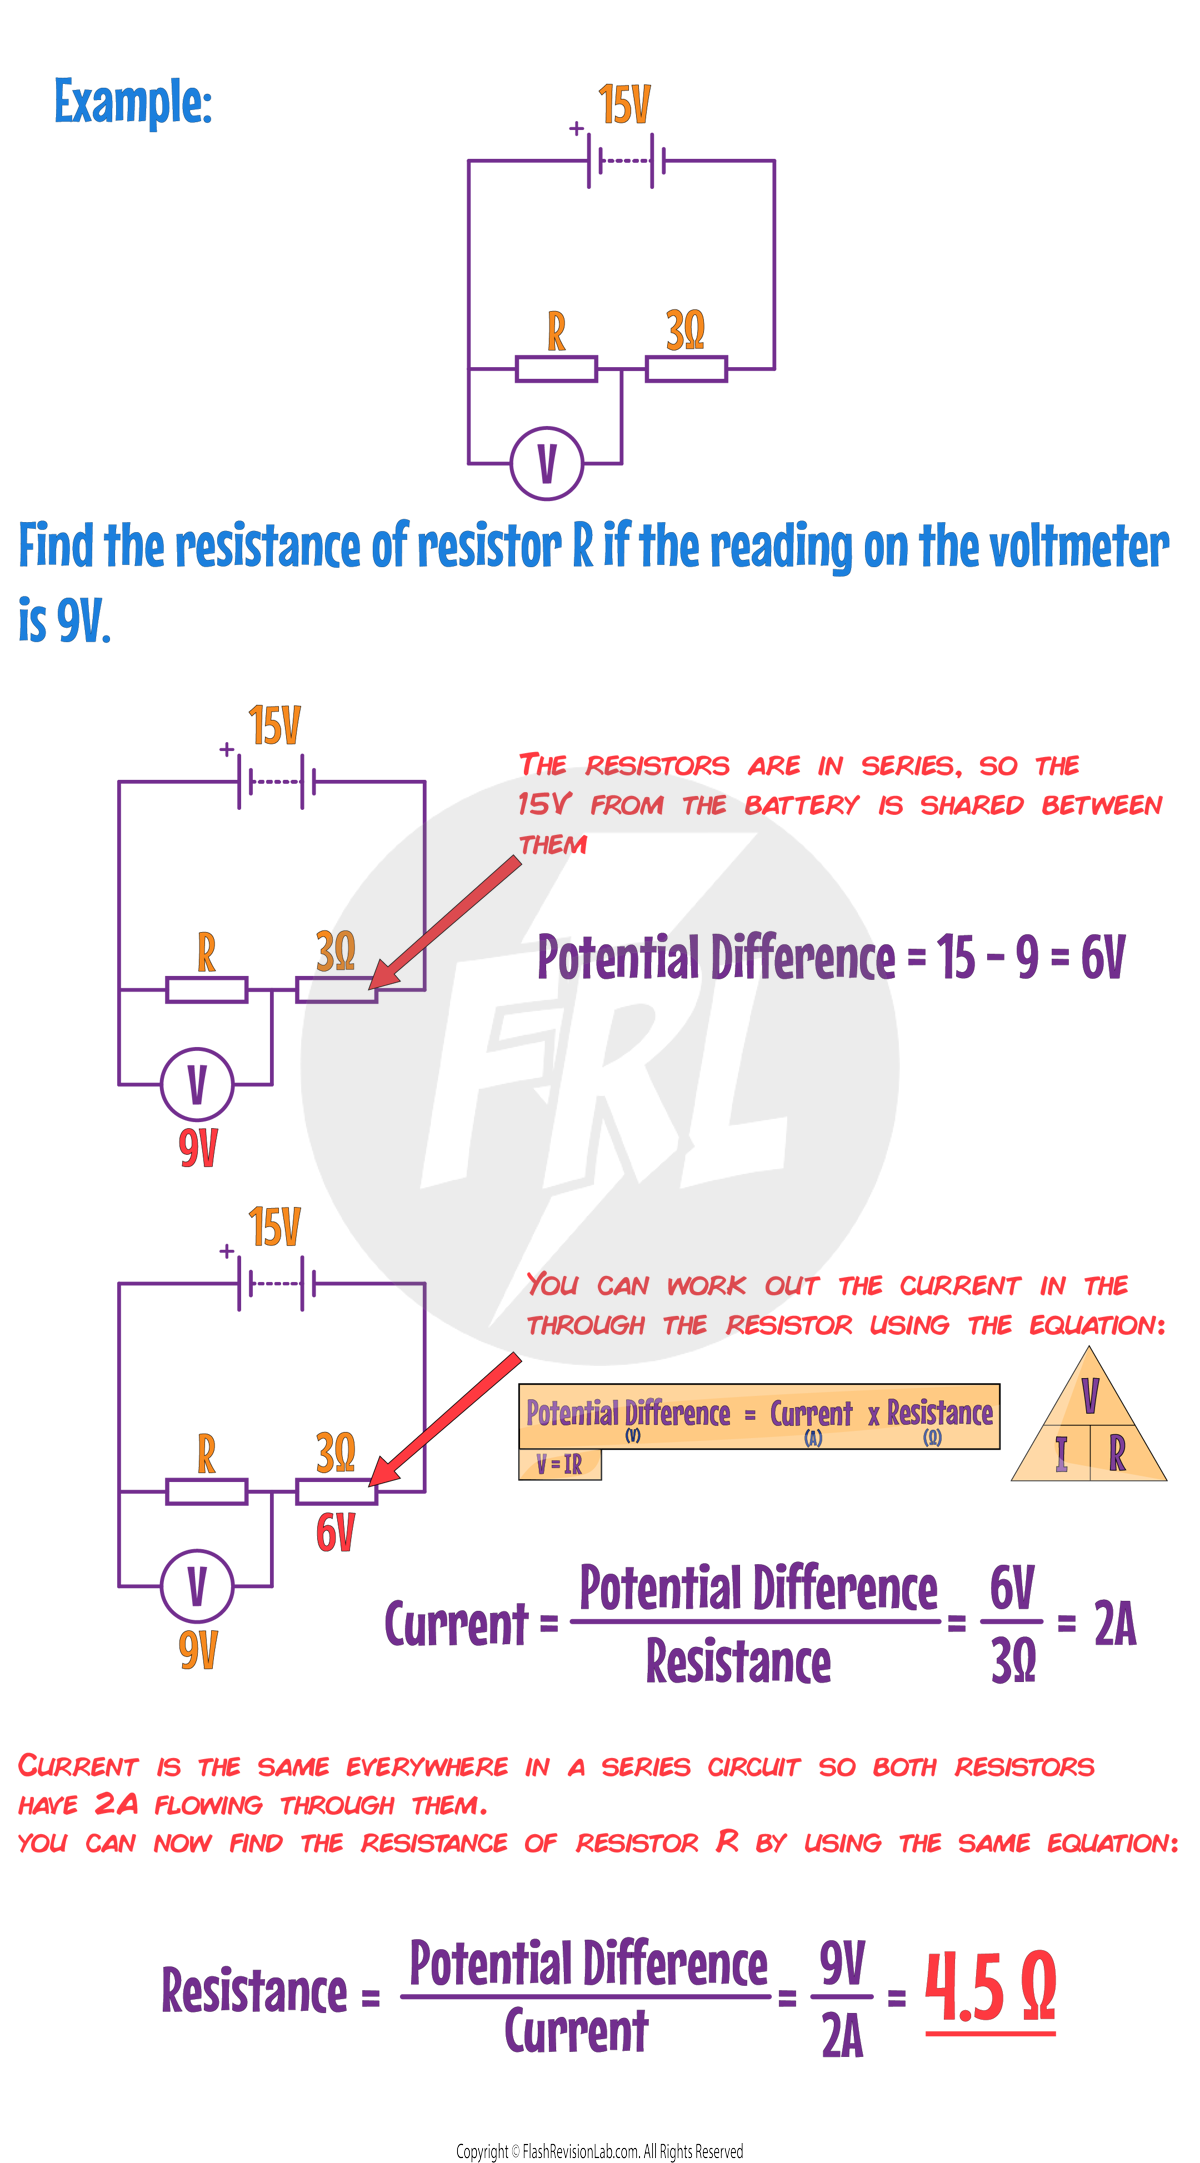
Calculating Resistance
You can calculate the resistance in a circuit by using AMMETERS AND VOLTMETERS:

Measures CURRENT (I) in AMPERES (A).
Always connect the ammeter in SERIES with the component.

Measures POTENTIAL DIFFERENCE (V) in VOLTS (V).
Always connect the voltmeter in PARALLEL across the component.
Once you have CURRENT and POTENTIAL DIFFERENCE values, you can use the following equation to find RESISTANCE:
There are TWO experiments you can carry out in this practical:
1. INVESTIGATING RESISTANCE AND LENGTH OF WIRE
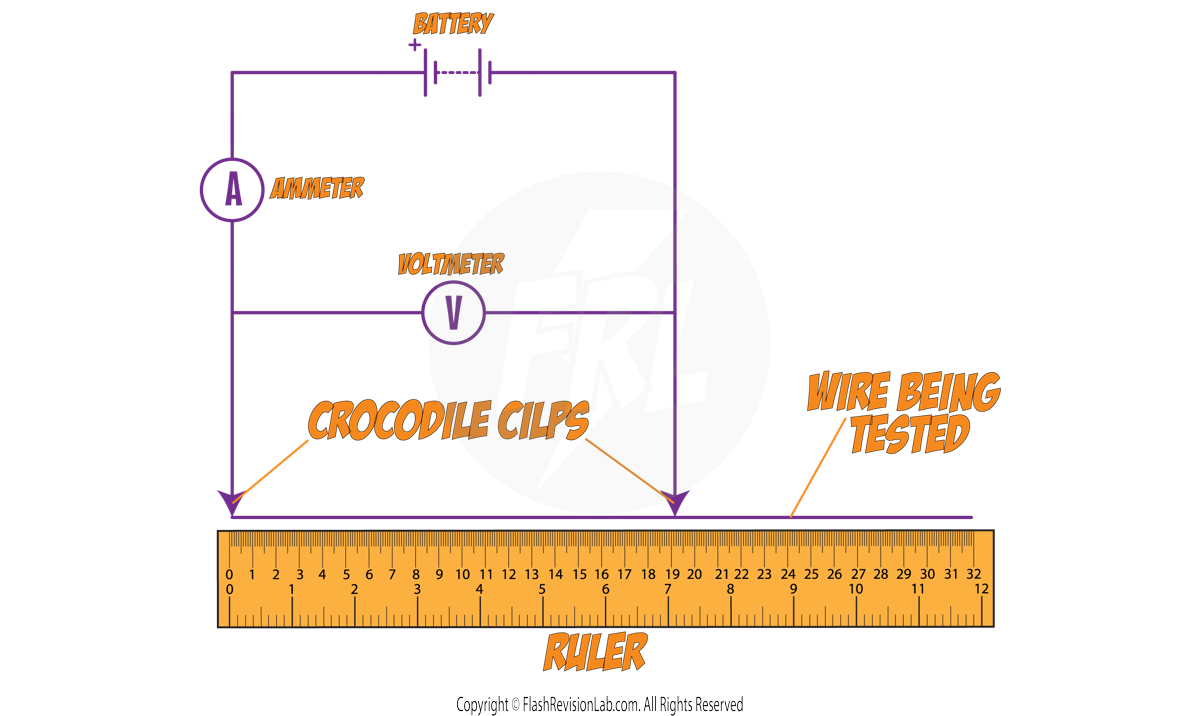
Method:
- Connect a crocodile clip to the wire at 0 cm on the ruler.
- Connect a second crocodile clip at a set length on the wire being investigated, e.g. 5 cm.
- Note the current (I) and potential difference (V).
- Move the second clip to a new length, e.g., 10 cm, and record again.
- Repeat for various lengths and record all measurements.
- Use the formula V = I × R to calculate RESISTANCE.
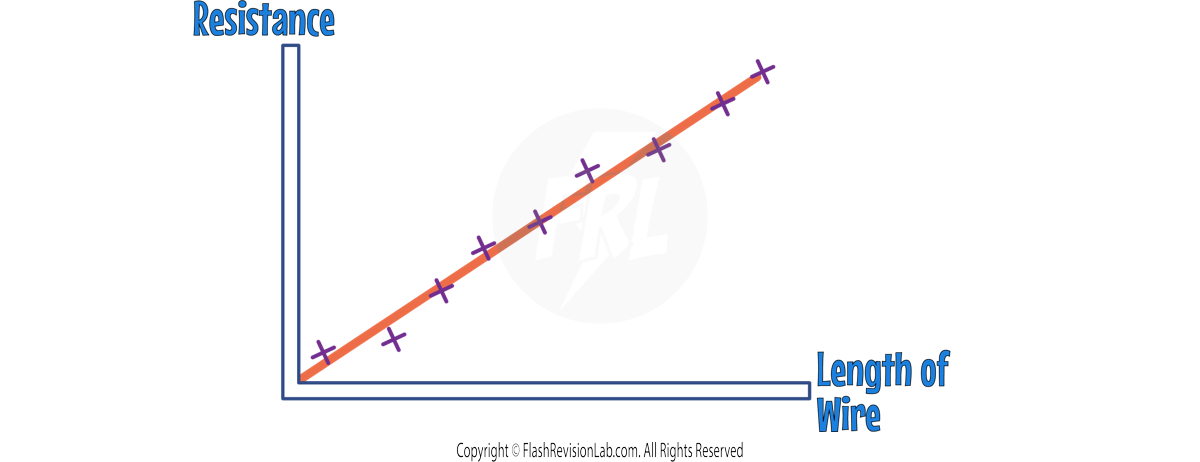
- Plot a graph of resistance against wire length and draw a LINE OF BEST FIT.
Ensure that the circuit is DISCONNECTED between readings, as the wire would warm up and affect the resistance readings.
2. INVESTIGATING COMBINATIONS OF RESISTORS IN SERIES AND PARALLEL
The number of resistors, and their arrangement can affect the TOTAL resistance in the circuit.
To investigate how resistors in SERIES and in PARALLEL affect the overall resistance, you can set up the following 3 circuits:
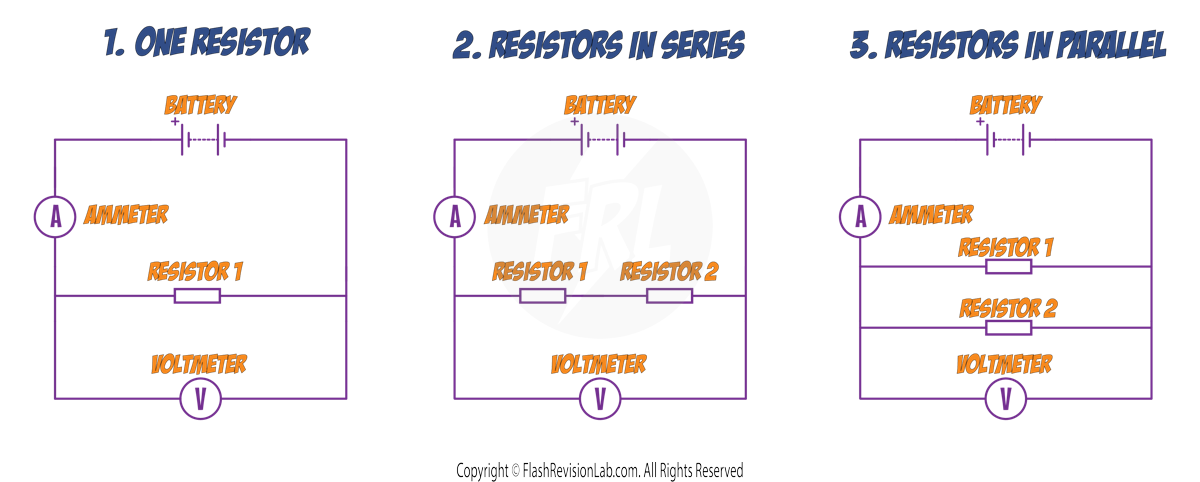
Method
1. For the FIRST circuit, note down the AMMETER and VOLTMETER values, and use the formula to work out the RESISTANCE of RESISTOR 1.
2. Repeat this method for RESISTOR 2.
3. Connect the SECOND CIRCUIT and work out the resistance.
4. Connect the THIRD CIRCUIT and work out the resistance.
Results
In Series:
- The resistance of the combined resistors in SERIES is equal to the SUM of the two individual resistances.
- This is because the electrons flow through just ONE path through both resistors, so the current does too.
In Parallel
- The resistance of the combined resistors in PARALLEL is LESS than the sum of the two individual resistances.
- This is because the electrons are SPLIT between the different paths (or 'loops') but the resistors still have the SAME POTENTIAL DIFFERENCE across them.
Resistors and I-V Graphs
RESISTORS are components in an electrical circuit that change the CURRENT (I) flowing through due to their RESISTANCE (R).
For some RESISTORS, the RESISTANCE remains CONSTANT but in others it can CHANGE as the current changes.
The resistance of many COMPONENTS such as lamps, diodes, thermistors and LDRs is NOT constant; it also changes with the current through the component.
You can use I-V graphs to see how RESISTANCE changes with current in a component.
I-V GRAPHS
There are THREE types of I-V graphs you need to know:
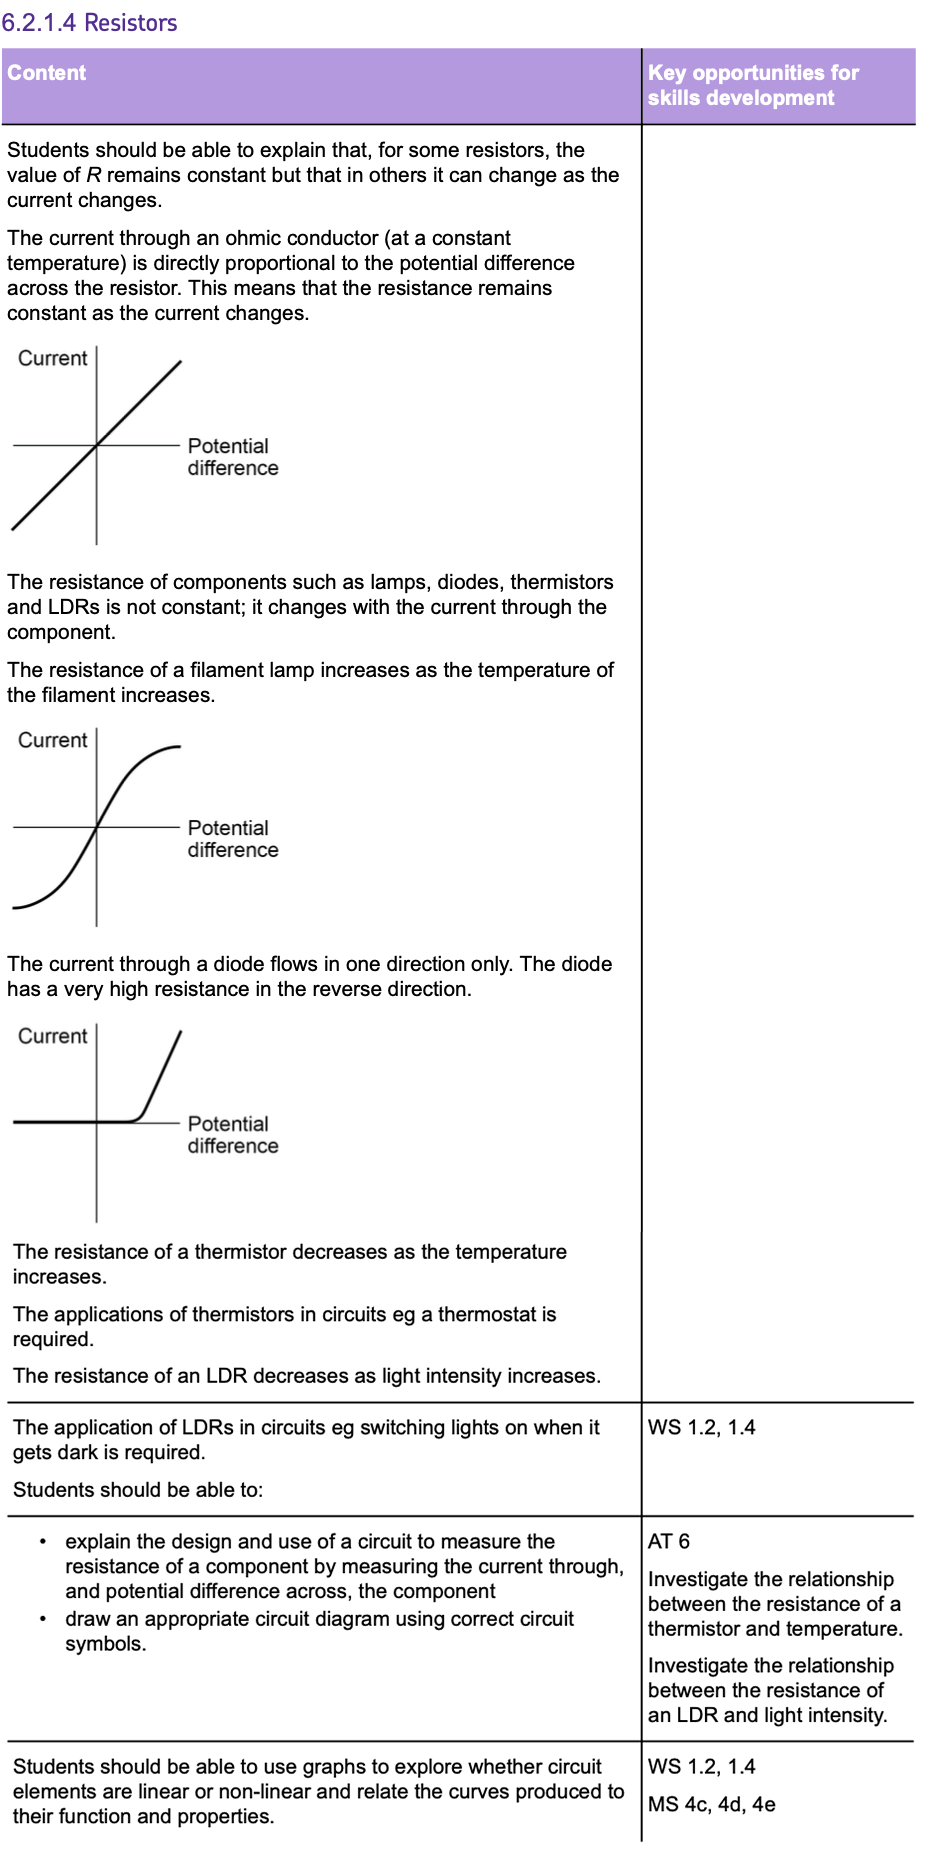
1. OHMIC CONDUCTORS
The CURRENT through an ohmic conductor (at a constant temperature) is DIRECTLY PROPORTIONAL to the POTENTIAL DIFFERENCE across the resistor.
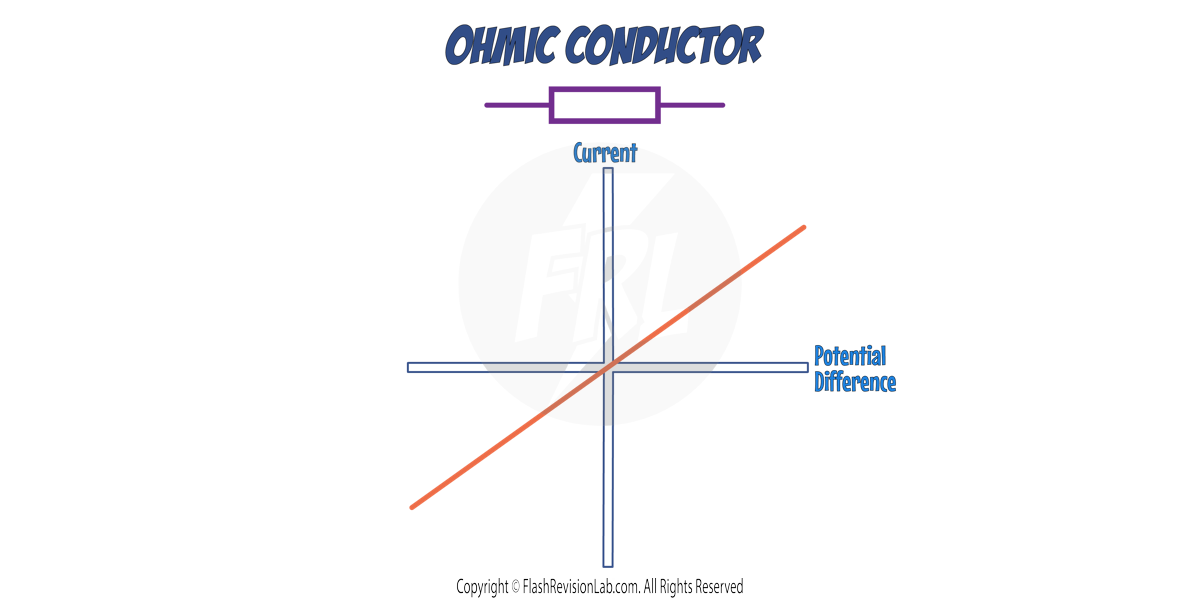
This is shown on the graph as a STRAIGHT LINE through the ORIGIN.
This means that the RESISTANCE remains CONSTANT as the current changes.
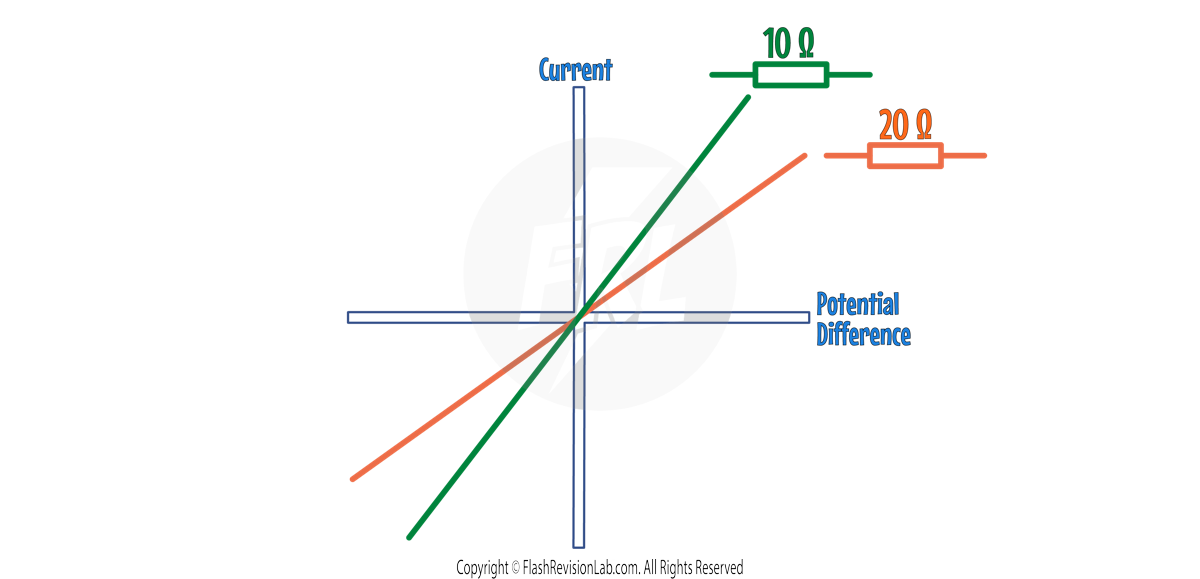
The STEEPER the line, the LOWER the RESISTANCE.
2. FILAMENT LAMP
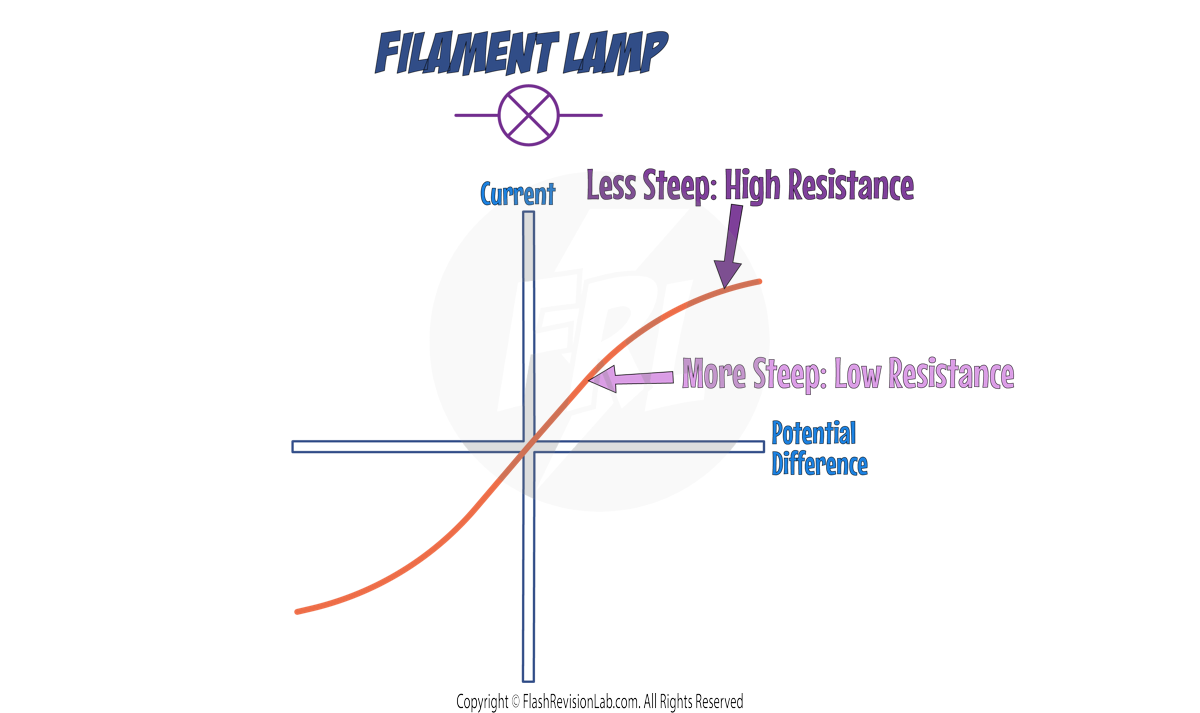
At low potential differences, there is a straight portion on the graph which means the resistance is CONSTANT; the graph curves at higher potential differences.
As the potential difference INCREASES, the gradient (steepness) of line DECREASES, which shows that RESISTANCE is INCREASING.
This is because the FILAMENT in the bulb gets HOTTER, which happens as more current passes through it.
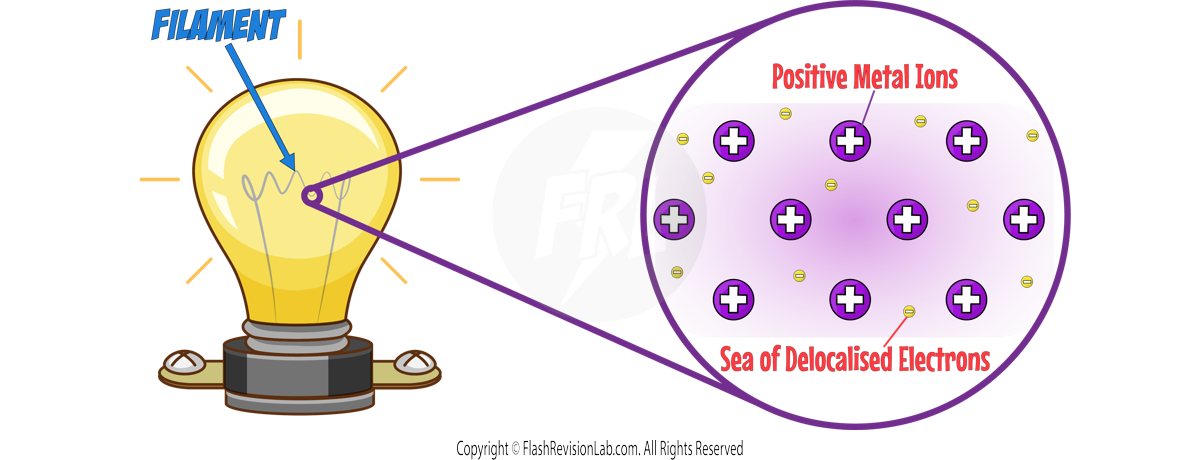
The filament is a METAL which means it contains METAL IONS and DELOCALISED ELECTRONS in its structure.
When the temperature of the filament INCREASES, the metal ions VIBRATE leading to MORE COLLISIONS between the IONS and ELECTRONS which INCREASES RESISTANCE.
3. DIODE
Diodes allow current to flow in only ONE DIRECTION, and have a HIGH RESISTANCE in the opposite direction.
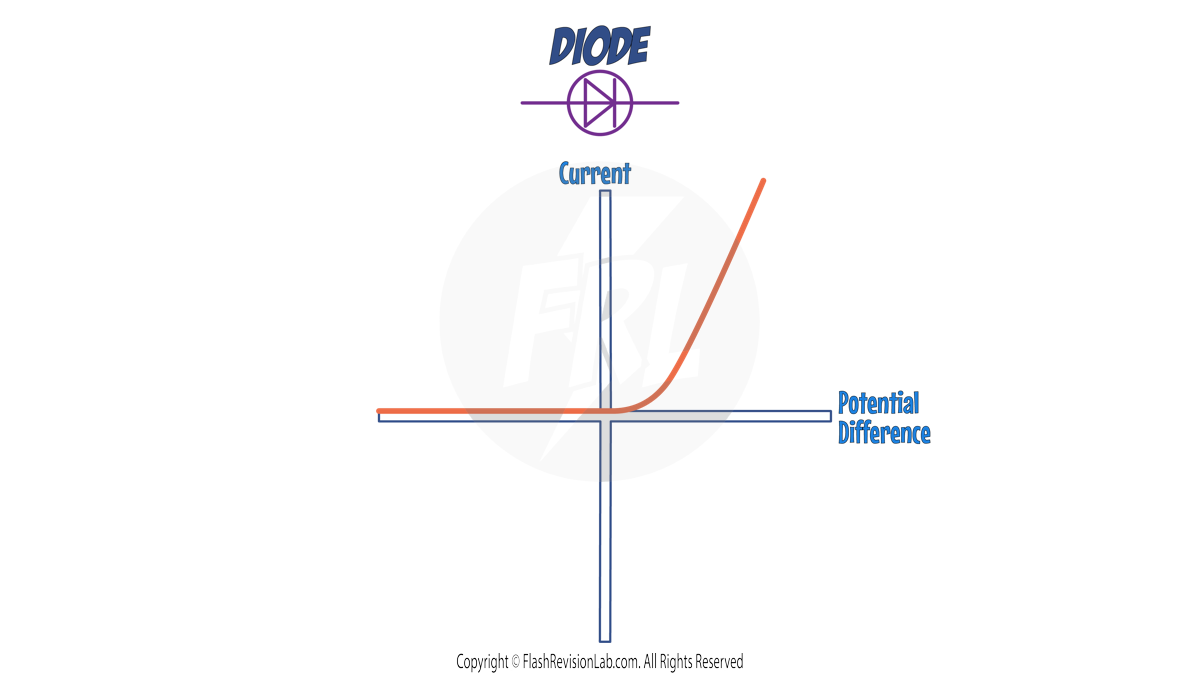
On an I-V graph, current flowing in the CORRECT direction is shown by a sharp increase in current on the POSITIVE AXIS (Right hand side of the graph)
When the diode is connected in the OPPOSITE DIRECTION (left hand side of the graph), the graph is FLAT at 0, indicating NO CURRENT flowing.
OTHER GRAPHS
1. LIGHT-DEPENDENT RESISTORS (LDRs)

An LDR is a resistor whose resistance varies according to the LIGHT INTENSITY of the surroundings:
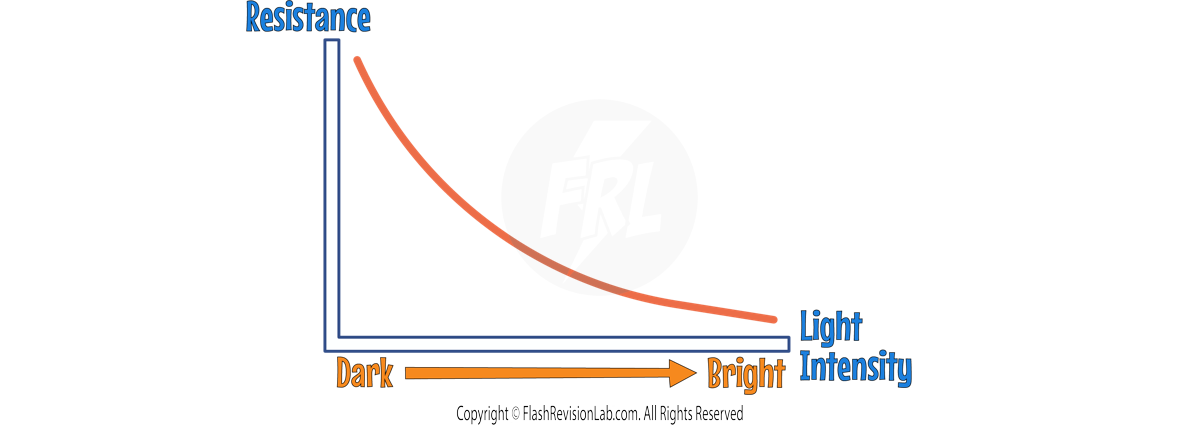
- In BRIGHT LIGHT, the resistance of an LDR decreases, allowing more CURRENT (I) to pass through.
- In DARKNESS, the resistance increases, reducing the current flow.
- LDRs are widely used in devices that react to light conditions, such as AUTOMATIC NIGHT LIGHTS, OUTDOOR LIGHTING, and BURGLAR DETECTORS.
2. THERMISTORS

A THERMISTOR is a resistor that changes its resistance according to the TEMPERATURE of the surroundings:
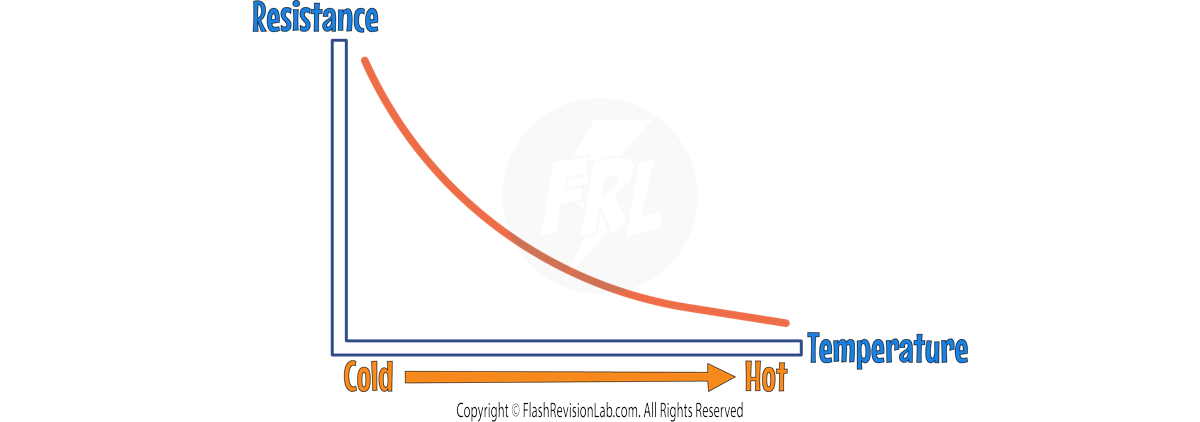
- When it's HOT, the resistance of a thermistor decreases, letting more current through.
- In COOL environments, the resistance increases, reducing the current.
- Thermistors are integral in TEMPERATURE DETECTORS, such as CAR ENGINE SENSORS and ELECTRONIC THERMOSTATS.
Required Practical: I-V Graphs
This practical investigates the I-V CHARACTERISTICS of different components.
I-V characteristics are GRAPHS that show how the CURRENT (I) through a component changes with the POTENTIAL DIFFERENCE (V) applied to it (also know as I-V Graphs).
TYPES OF I-V CHARACTERISTICS:
- LINEAR COMPONENTS (like a fixed resistor) show a STRAIGHT LINE on the graph, indicating that current and potential difference are DIRECTLY PROPORTIONAL.
- NON-LINEAR COMPONENTS (like a filament lamp or a diode) show a CURVED LINE, meaning the relationship between current and potential difference is NOT proportional.
METHOD
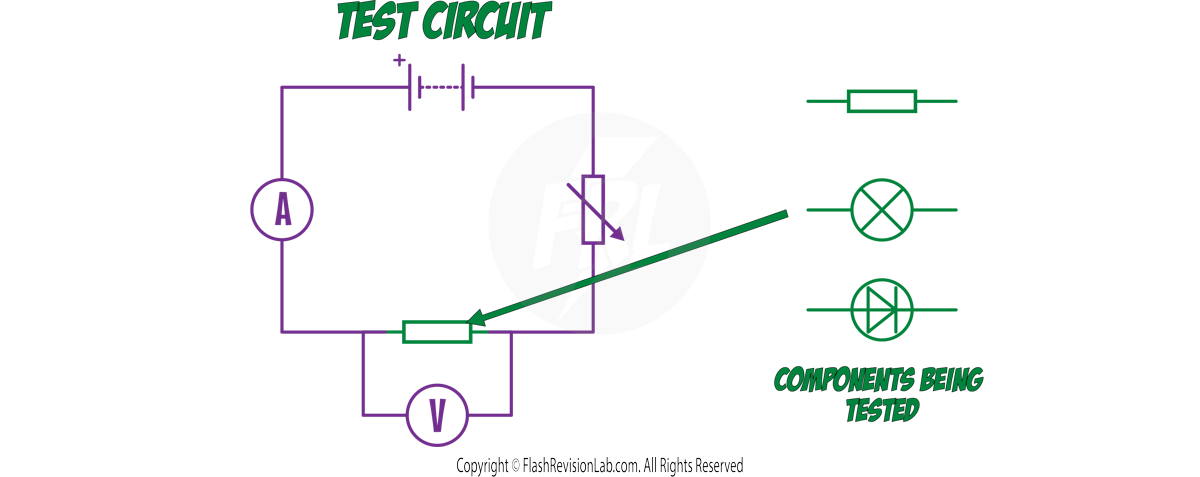
- Build the TEST CIRCUIT with a VARIABLE RESISTOR to CONTROL current, an AMMETER in series to measure CURRENT, a VOLTMETER in parallel to measure POTENTIAL DIFFERENCE and the COMPONENT being tested.
- Change the variable resistor to alter the CURRENT flowing through and the POTENTIAL DIFFERENCE across the component.
- Record READINGS from both the ammeter and voltmeter as you adjust the variable resistor. Take multiple readings to ensure accuracy and calculate an average.
- SWAP the connections to the battery to reverse the current's direction. This checks the component’s behaviour in both directions.
- PLOT a graph of current against voltage to visualise the component's I-V characteristics.
GRAPH ANALYSIS:
The graph you get will be different depending on the component being tested:
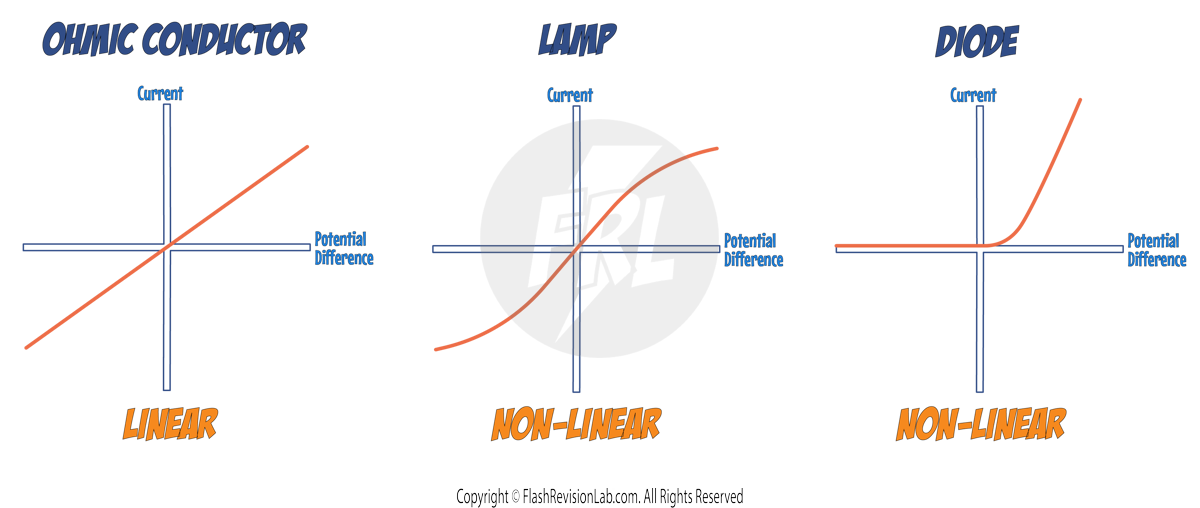
- The graph for an OHMIC CONDUCTOR (like a resistor) will be a straight line.
- The graph for a FILAMENT LAMP will start to curve as the current increases due to the filament heating up.
- The graph for a DIODE will show current flow in one direction and very little in the opposite direction.

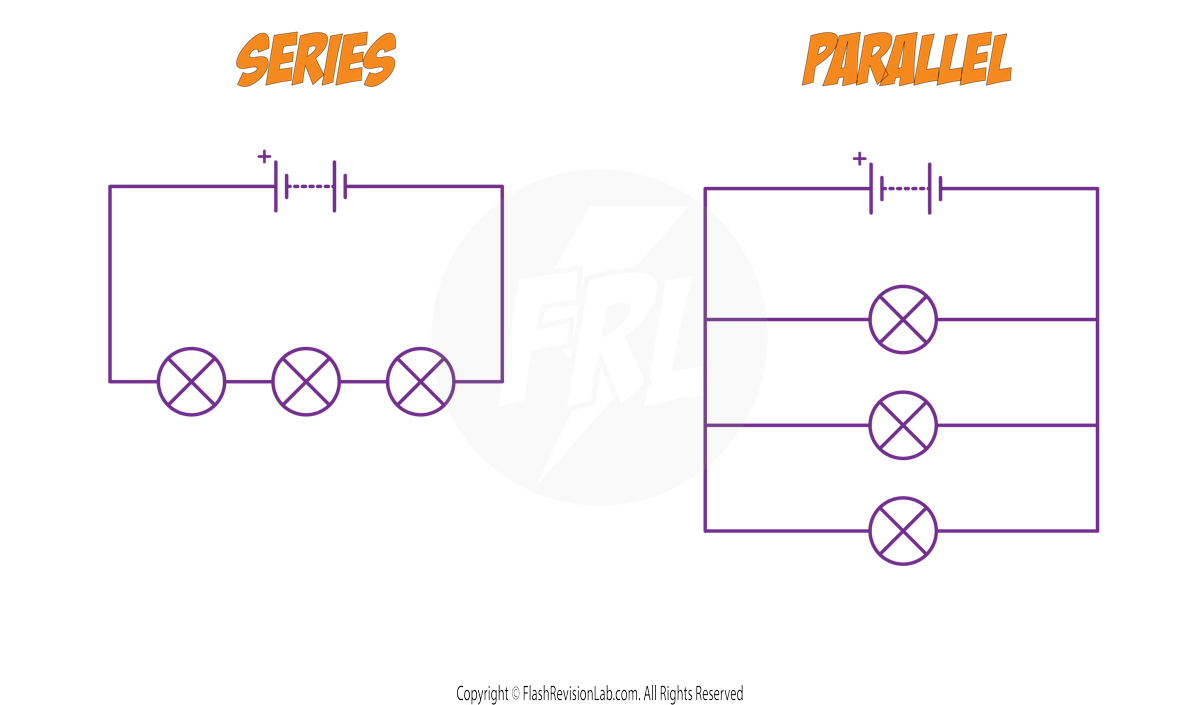
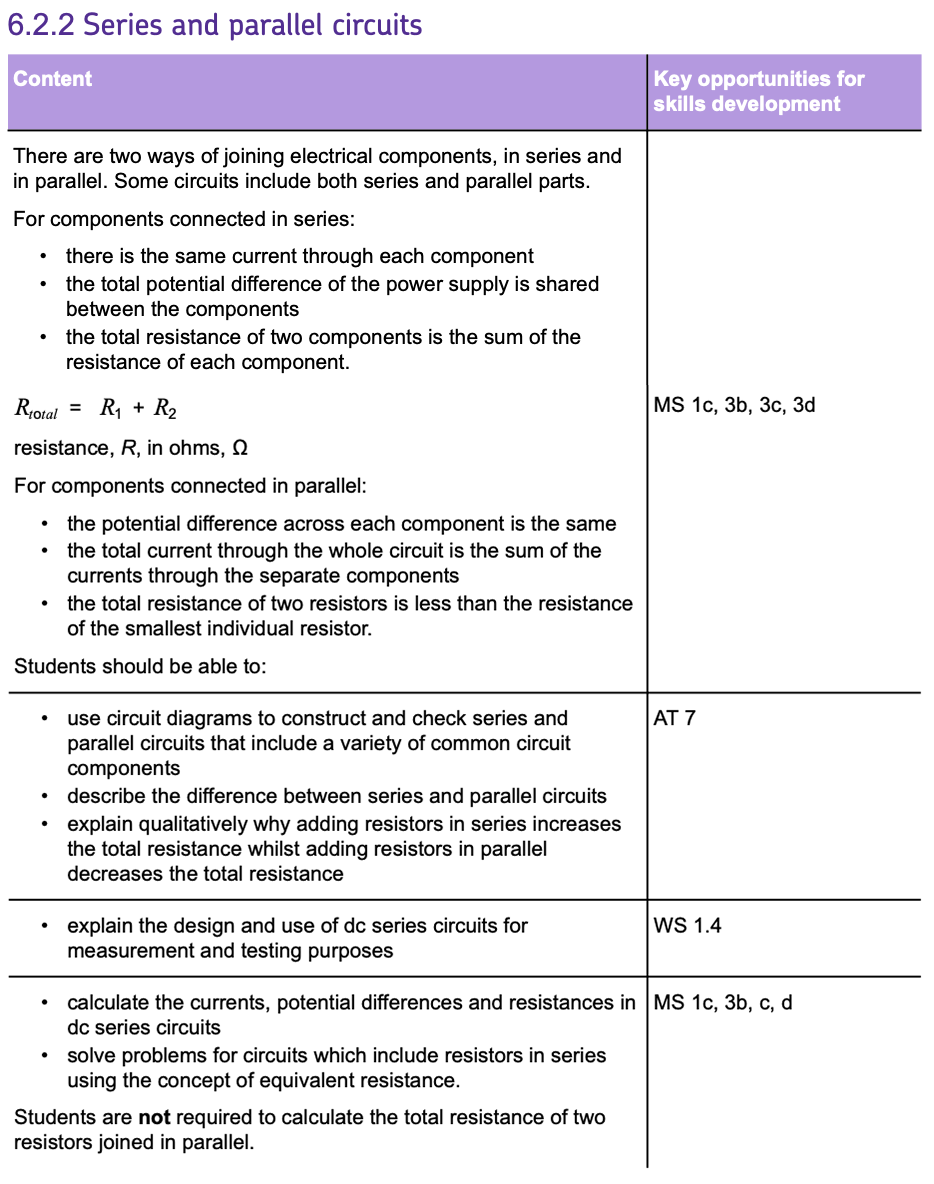
Series and Parallel Circuits
There are two ways of joining components in circuits, in SERIES and in PARALLEL. Here are the differences between the two:
COMPONENT CONNECTION
SERIES Circuits: Components are connected in ONE LOOP.
PARALLEL Circuits: Components are connected in MULTIPLE LOOPS.
CURRENT
SERIES Circuits: The CURRENT is the SAME through each component.
PARALLEL Circuits: The CURRENT through the whole circuit is the SUM of the currents through the separate components.
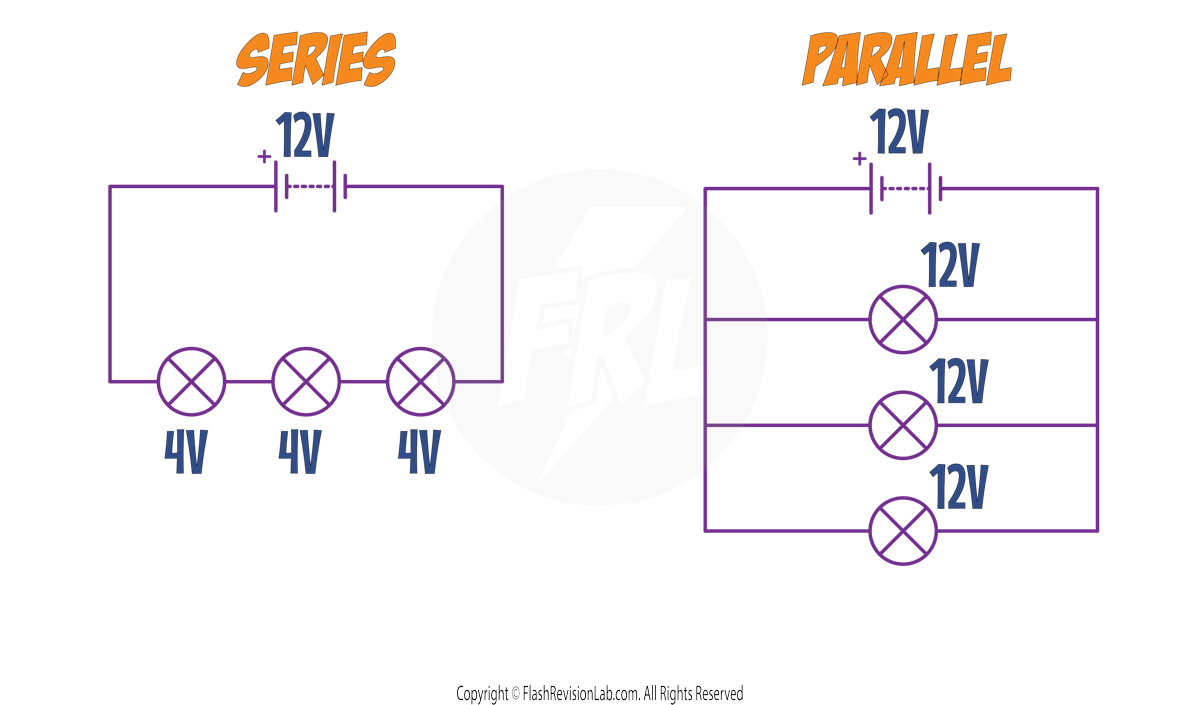
POTENTIAL DIFFERENCE
SERIES Circuits: The POTENTIAL DIFFERENCE supplied by the battery is SHARED between the components.
PARALLEL Circuits: The POTENTIAL DIFFERENCE across each component is the SAME.
RESISTANCE
SERIES Circuits: The TOTAL RESISTANCE is calculated by ADDING the resistance of each component. The formula is:

Increasing the number of resistors IN SERIES increases the overall resistance, as the current now has MORE resistors to pass through.
PARALLEL Circuits: The TOTAL RESISTANCE of resistors in parallel is LESS THAN the SMALLEST individual resistor.
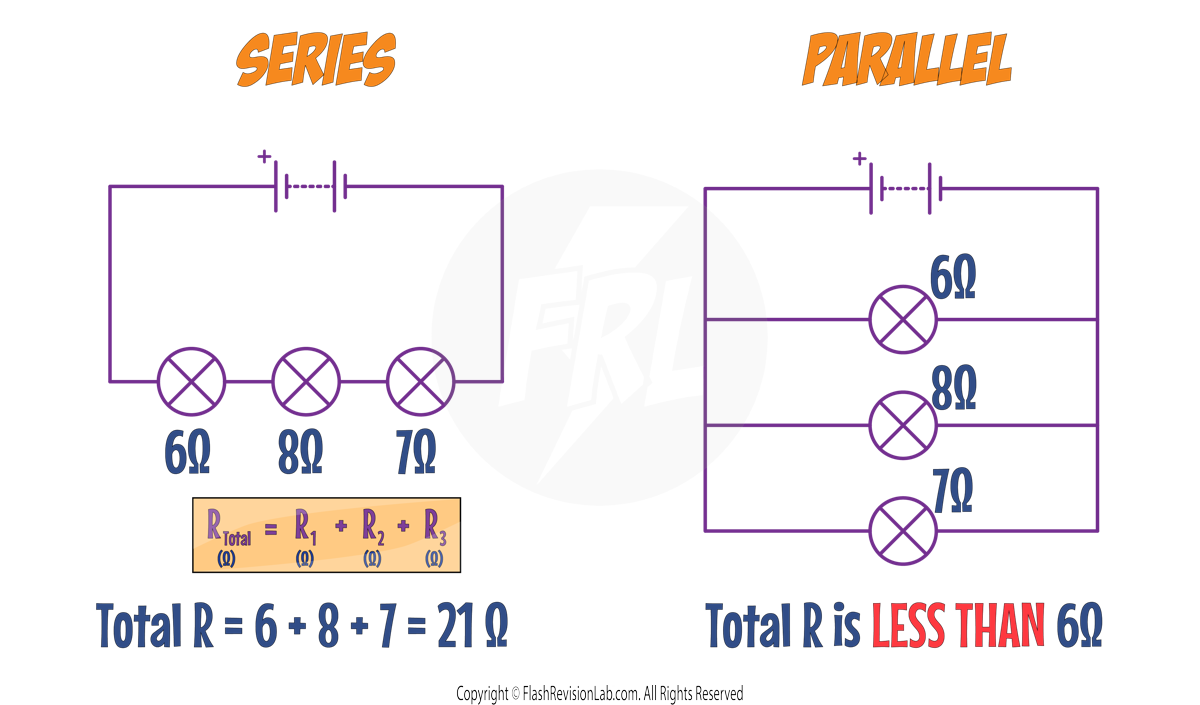
This happens because each resistor added in parallel creates an EXTRA PATH along which the current can flow.
This means there is a LARGER TOTAL CURRENT that can flow through the circuit.
This means there is a LOWER TOTAL RESISTANCE in the circuit.
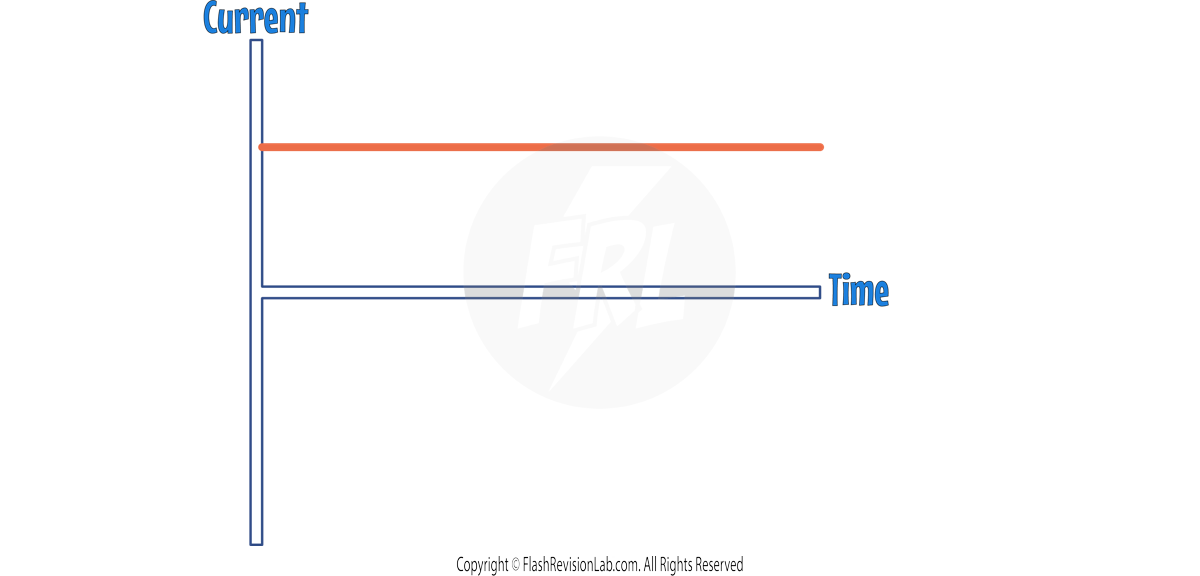
Direct and Alternating Current:
- DIRECT CURRENT (DC) is electrical current flowing in ONE direction.
- Direct current is usually found in BATTERY POWERED devices.
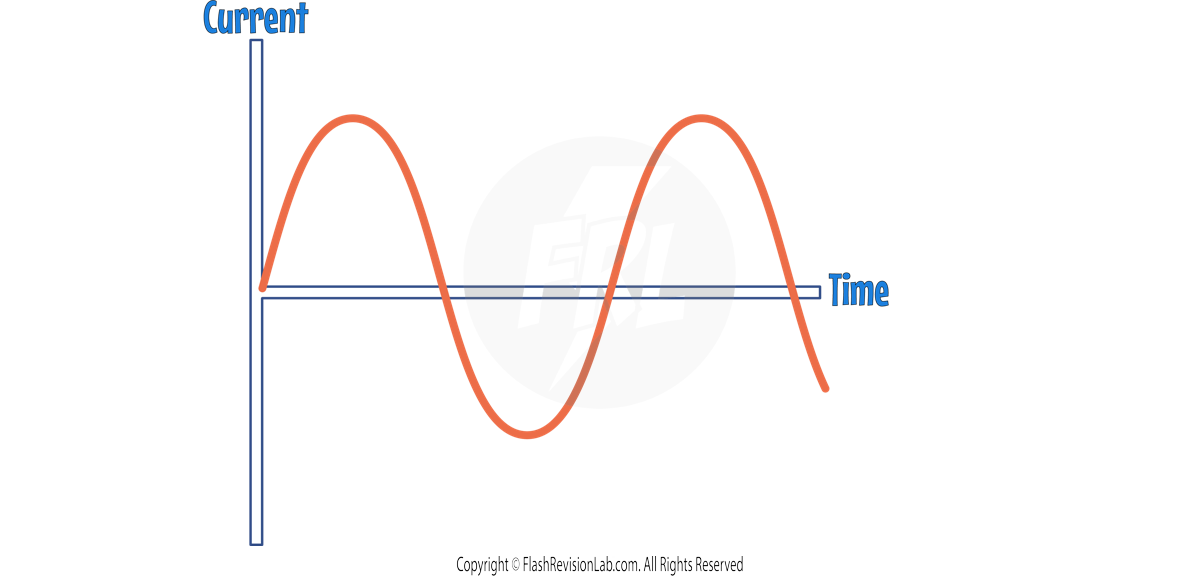
- ALTERNATING CURRENT (AC) is current that changes direction from positive to negative periodically.
- An example of AC is the UK MAINS SUPPLY (Current from sockets in the home).
Mains Electricity
Electrical appliances are usually connected with a THREE-CORE CABLE, consisting of:
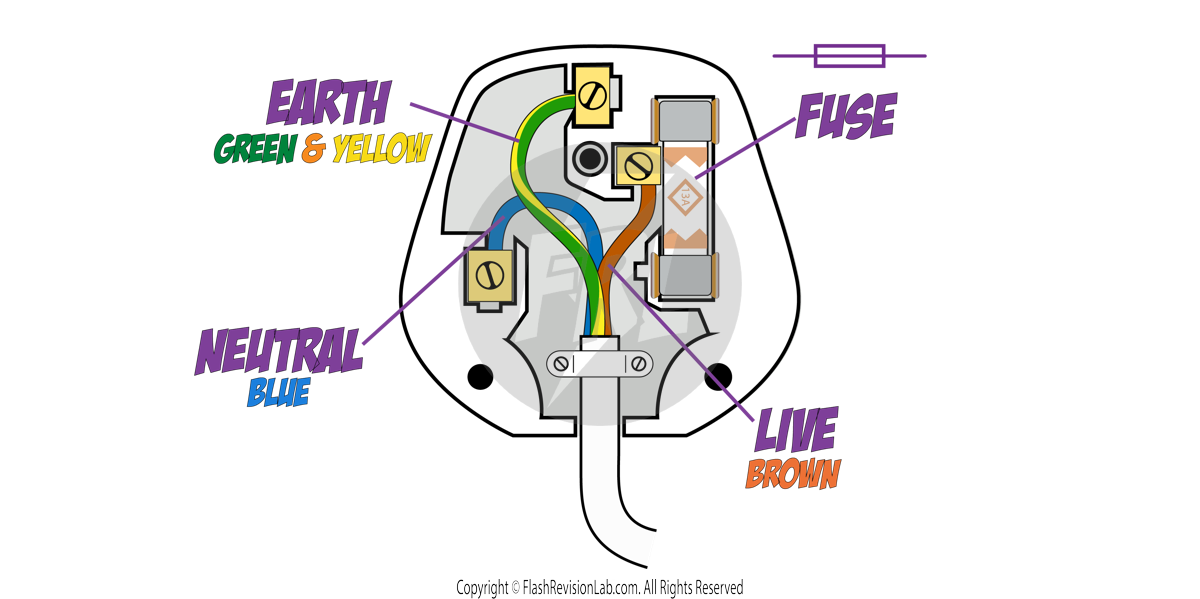
- LIVE WIRE – BROWN: Carries the ALTERNATING POTENTIAL DIFFERENCE from the supply and is always connected to the FUSE. This wire has an electric potential of 230V.
- NEUTRAL WIRE – BLUE: Completes the circuit and is approximately at the EARTH POTENTIAL: an electric potential of 0V.
- EARTH WIRE – GREEN AND YELLOW: Is used for SAFETY, to stop the appliance from becoming live. This also has an electric potential of 0V, and it only carries a current if there is a FAULT.
SAFETY ASPECTS
The potential difference between the wire can be calculated by finding the difference between electric potentials:
E.g. The potential difference between the LIVE WIRE (230V) and EARTH WIRE (0V) is:
230 V – 0V = 230V.
This means connecting the LIVE WIRE to the EARTH WIRE can pose serious dangers due to the LARGE potential difference of 230V. This can result in a LARGE CURRENT which can create a FIRE.

E.g. The potential difference between the LIVE WIRE and A HUMAN.
The human body has an electric potential of 0V so:
230 V – 0V = 230V.
The live wire may be dangerous even when a switch in the mains circuit is open as it has an potential of 230V so there will be a POTENTIAL DIFFERENCE of 230V across your body, which can cause CURRENT to flow through you, leading to DEATH.

THE EARTH WIRE
- The EARTH WIRE in an electrical system is crucial for SAFETY. It normally carries no electricity during regular appliance operation.
- The ELECTRIC POTENTIAL of the EARTH WIRE is 0V because it's connected to the ground, making it the same electric potential as the Earth.
- METAL CASES on electrical appliances can be a safety hazard. If the LIVE WIRE inside the appliance touches the metal case, the case could become LIVE.
- Touching a LIVE metal case can lead to ELECTROCUTION. The EARTH WIRE helps to prevent this by providing a safe path for the electricity.
- The EARTH WIRE offers a LOW RESISTANCE PATH to the Earth, which is important if a fault occurs.
- When a fault happens, the EARTH WIRE allows current to flow to the ground, creating a surge of current in the EARTH WIRE and potentially also in the LIVE WIRE.
- This surge can trigger a FUSE to melt and break the circuit, which stops the flow of electricity and makes the appliance safe to touch.
Electrical Power
POWER is the rate at which energy is transferred or converted. In an electrical circuit, POWER is calculated as the product of POTENTIAL DIFFERENCE and CURRENT:
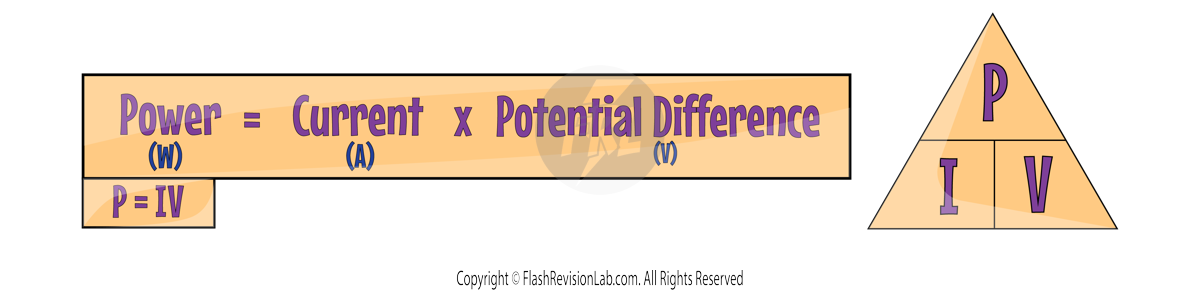
This formula tells you how much energy is used per second when a current flows through a component at a certain potential difference.
There's another way to calculate POWER if you know the RESISTANCE of a component and the CURRENT flowing through it:
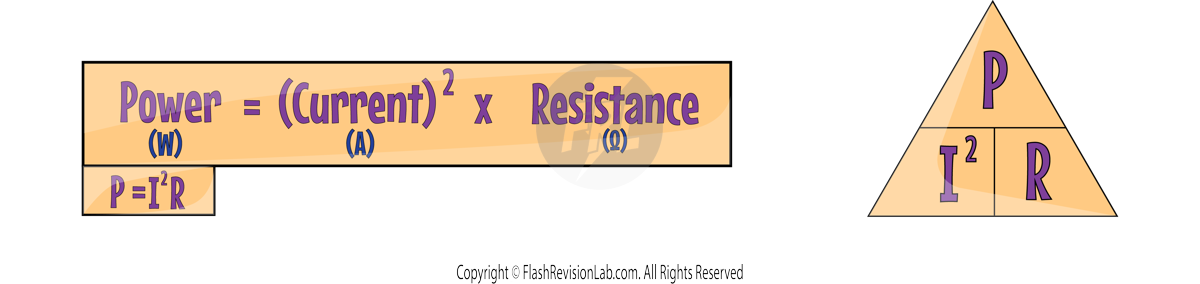
This shows that POWER also depends on the square of the CURRENT and the RESISTANCE the current encounters.
- Power is measured in Watts (W)
- Potential Difference (Voltage) is measured in Volts (V).
- Current is measured in Amperes (A).
- Resistance is measured in Ohms (Ω).
Electrical Energy Transfers
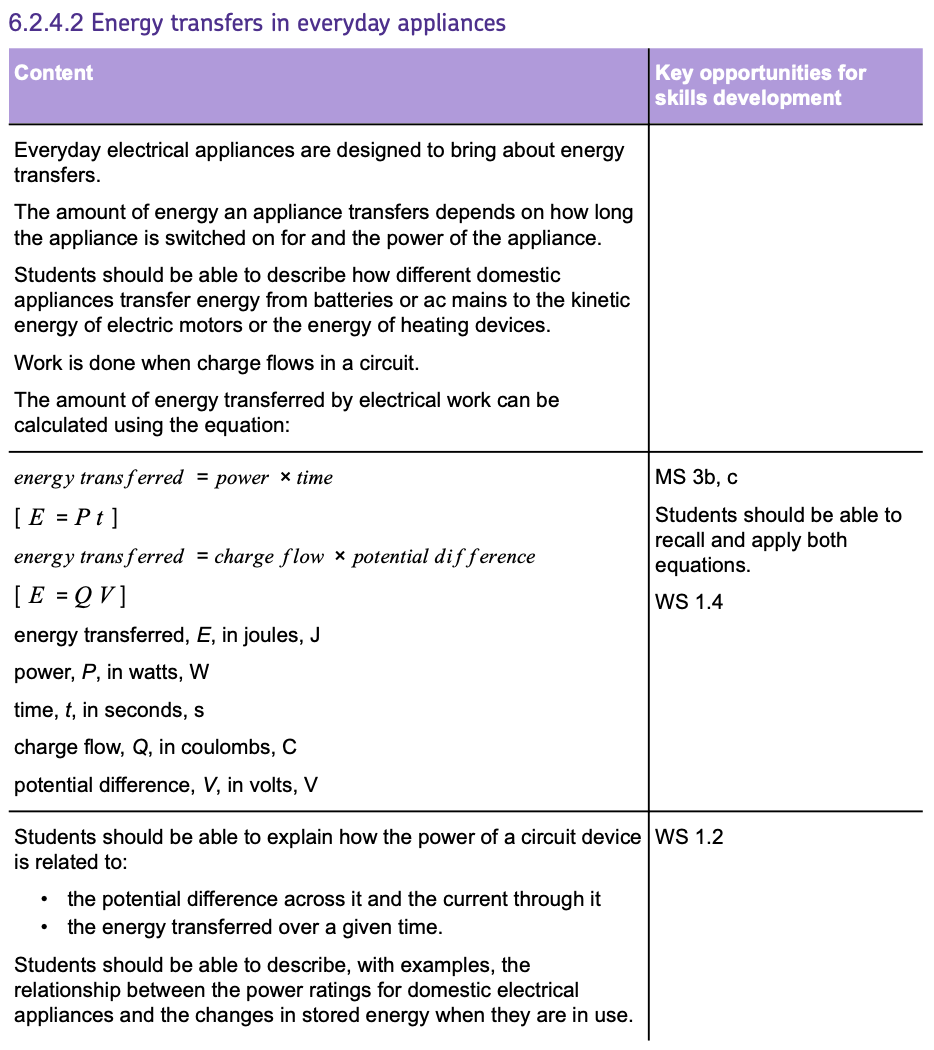
- Everyday electrical appliances are designed to bring about ENERGY TRANSFERS.
- The AMOUNT OF ENERGY an appliance transfers depends on two things:
- How long the appliance is on (time).
- The power rating of the appliance.
- Appliances transfer energy ELECTRICALLY from either BATTERIES (if it’s battery powered) or the AC MAINS (if it needs to be plugged in).
- Here are some examples of appliances and their energy transfers:
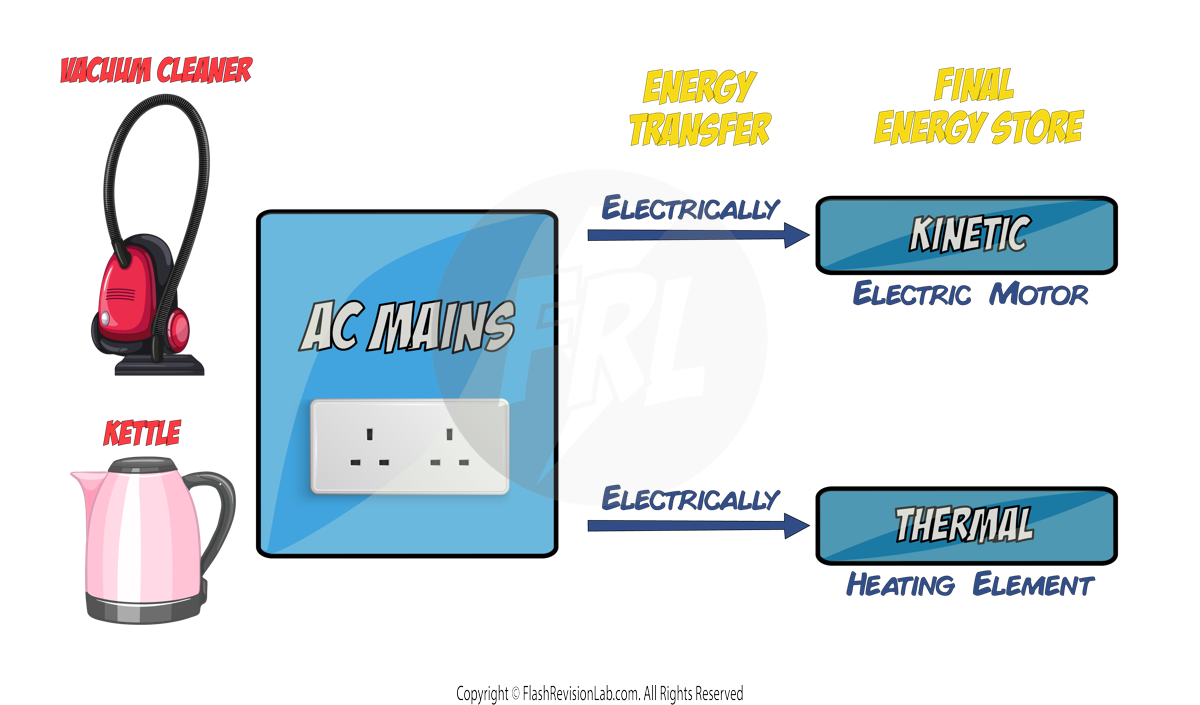
ELECTRICAL ENERGY
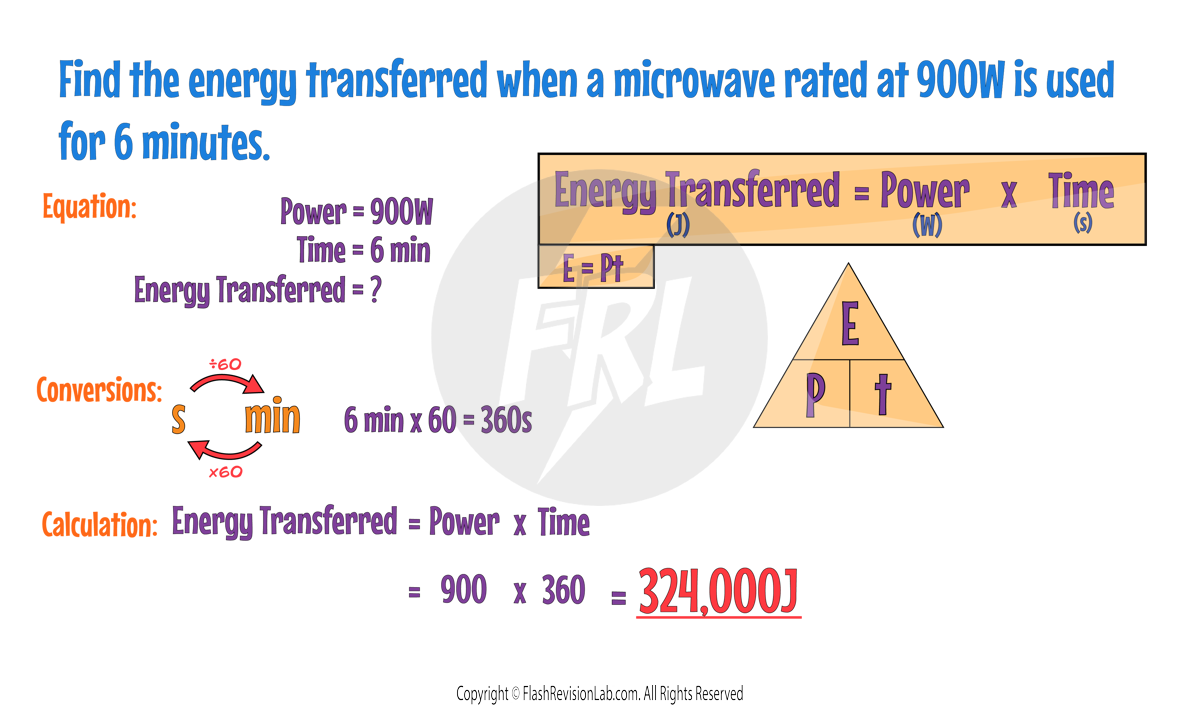
WORK IS DONE when charge flows through a circuit.
The amount of energy transferred by electrical work can be calculated using the equation:
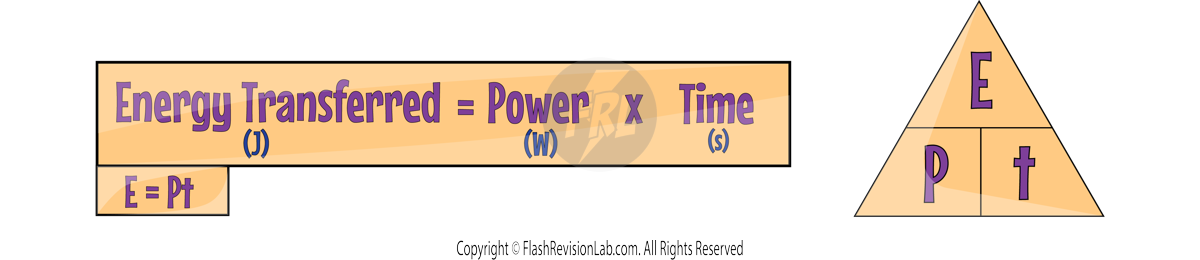
Where:
- E is the energy transferred in Joules (J).
- P is the power in Watts (W).
- t is the time in Seconds (s).
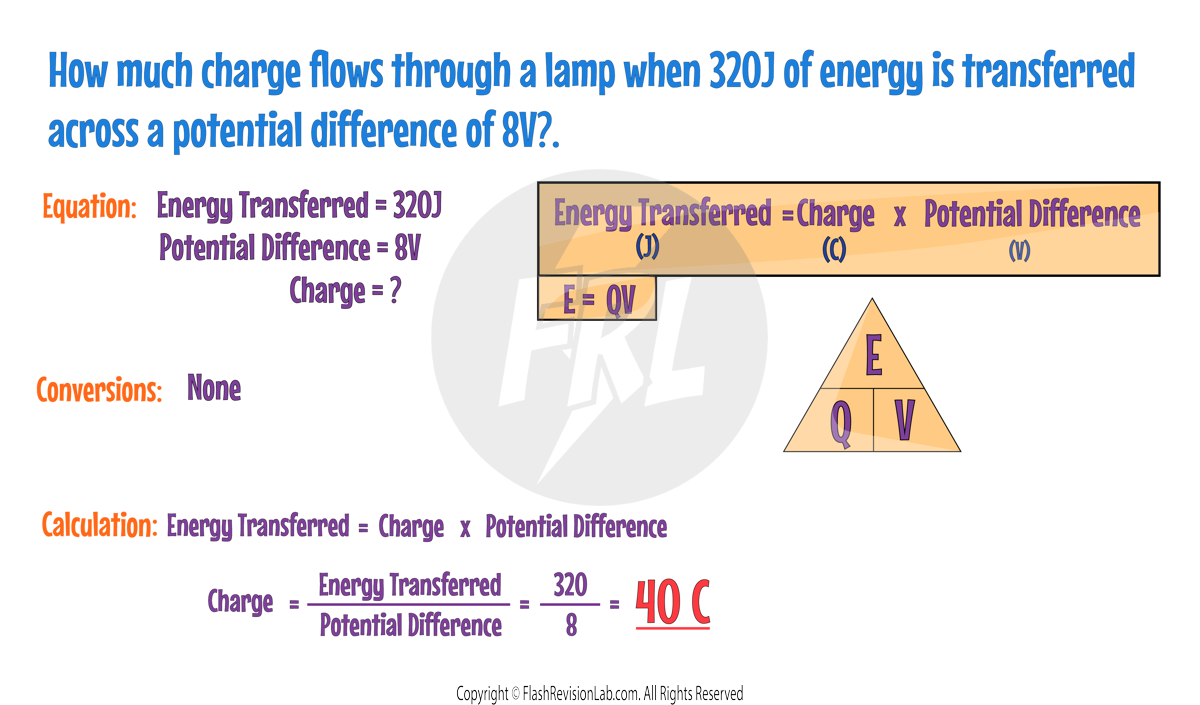
Another way to express ENERGY TRANSFERRED is by the product of CHARGE FLOW and POTENTIAL DIFFERENCE:
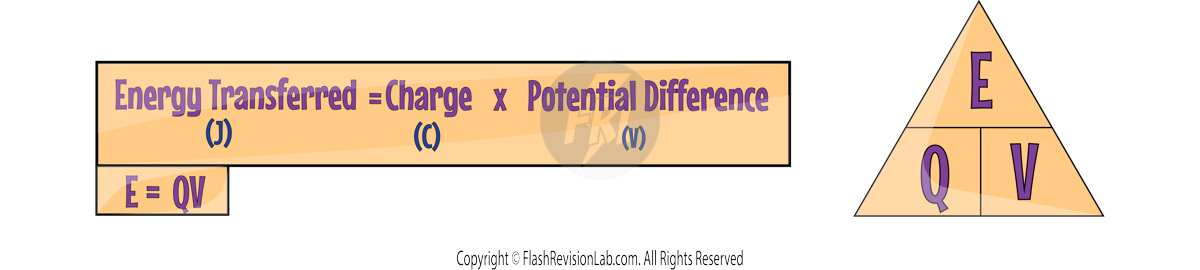
Where:
- Q is the charge flow in Coulombs (C).
- V is the potential difference in Volts (V).
- E is the energy transferred in Joules (J).
Power Ratings
- Every electrical appliance has a POWER RATING which tells you how much energy it needs to work.
- It's possible to describe the POWER RATINGS and how they relate to changes in stored energy. For example, a high-power appliance like a toaster uses more energy in a shorter amount of time compared to a low-power appliance like a clock.
The National Grid
- The NATIONAL GRID is a large network consisting of CABLES and TRANSFORMERS. It connects POWER STATIONS to CONSUMERS, distributing electricity across the country.
The Role of High Potential Difference and Low Current
- The NATIONAL GRID operates using a HIGH POTENTIAL DIFFERENCE (PD) and a LOW CURRENT to transmit electricity efficiently.
- A high CURRENT would lead to a significant amount of ENERGY being LOST as HEAT in the cables, so it's avoided by using a HIGH POTENTIAL DIFFERENCE which allows for a LOW CURRENT.
- A lower CURRENT reduces ENERGY LOSS and prevents the wires from heating up too much, making the grid more efficient.
Transformers
TRANSFORMERS are used to change the POTENTIAL DIFFERENCE for efficient energy transmission over long distances.
There are TWO types of TRANSFORMERS:
1. STEP-UP TRANSFORMERS
These INCREASE the POTENTIAL DIFFERENCE and DECREASE the CURRENT.
2. STEP-DOWN TRANSFORMERS
These decrease the POTENTIAL DIFFERENCE and INCREASE the CURRENT.
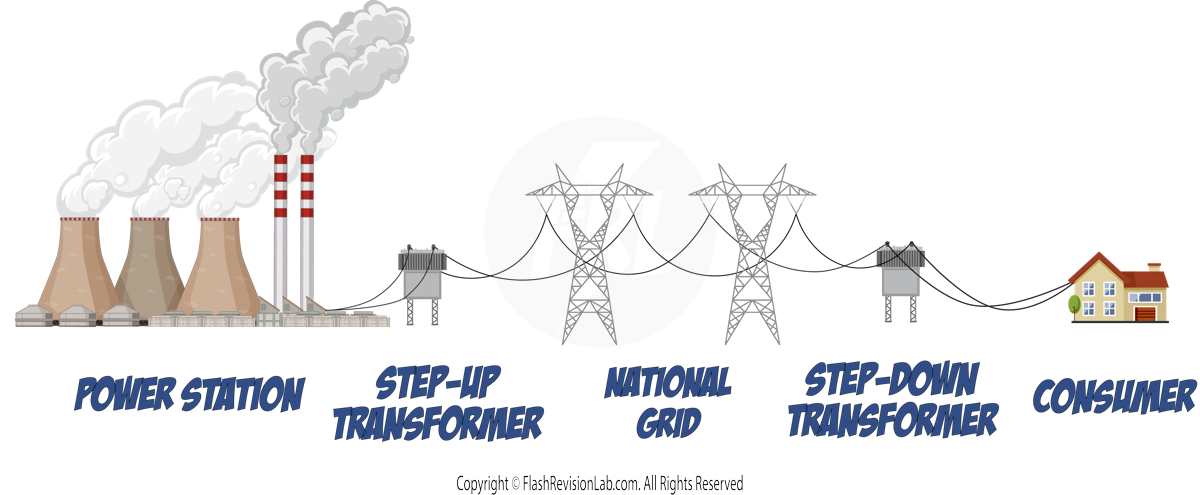
The electricity generated from the POWER STATION first goes through a STEP-UP transformer, which INCREASES the POTENTIAL DIFFERENCE and DECREASES the CURRENT so that it can travel long distances and minimise ENERGY LOST as HEAT.
Just before the current reaches the consumer, it passes through a STEP-DOWN transformer which DECREASES the POTENTIAL DIFFERENCE and INCREASES the CURRENT. This is done so that it's at a SAFE LEVEL for the consumer to use (230V and 50Hz).
Transformer Equation
Transformers are made up of two coils of wire, called the PRIMARY and SECONDARY coils, around a magnetic iron core.
The POWER transferred by a transformer is almost equal in the primary and secondary coils. By knowing this we can derive the following equation:
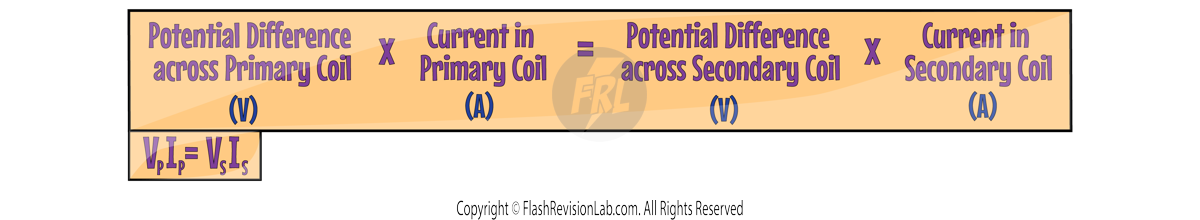
- Where:
- VP and IP are the POTENTIAL DIFFERENCE and CURRENT in the PRIMARY coil.
- VS and IS are the POTENTIAL DIFFERENCE and CURRENT in the SECONDARY coil.
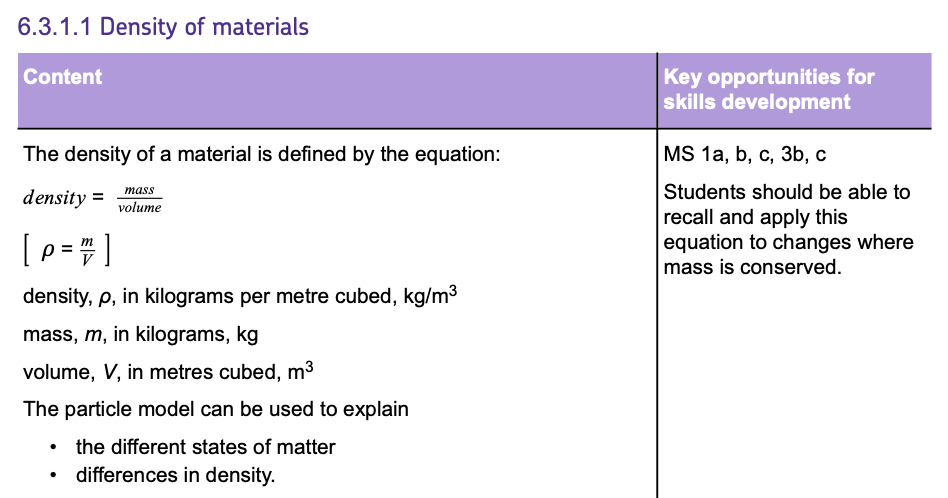
Density
DENSITY is a measure that compares a substance's MASS to the VOLUME it occupies.
The DENSITY of a material depends on how closely its particles are packed.
A DENSE material means the particles are close together.
If the material is compressed, the particles are forced closer, increasing the DENSITY.
The formula to calculate DENSITY is:
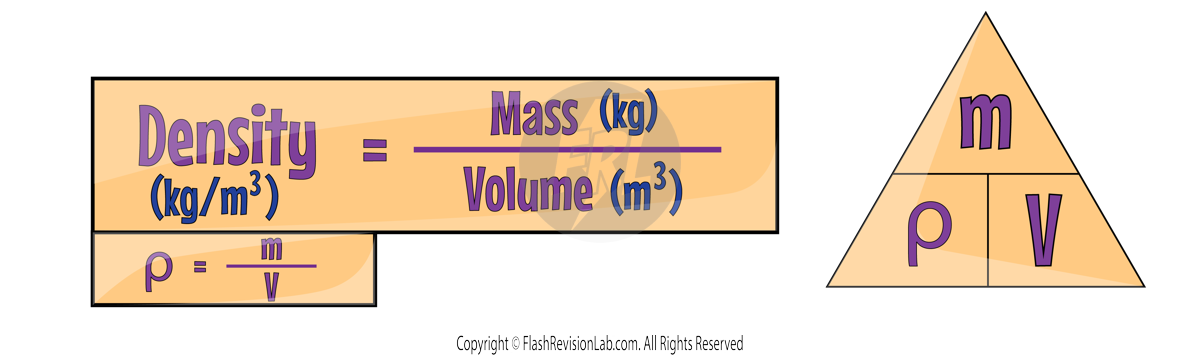
where:
- Mass is measured in Kilograms (kg).
- Volume is measured in Cubic meters (m³).
- Density is measured in Kilograms per cubic meter (kg/m³).
Units of Density
- You might also encounter DENSITY given in grams per cubic centimeter (g/cm³).
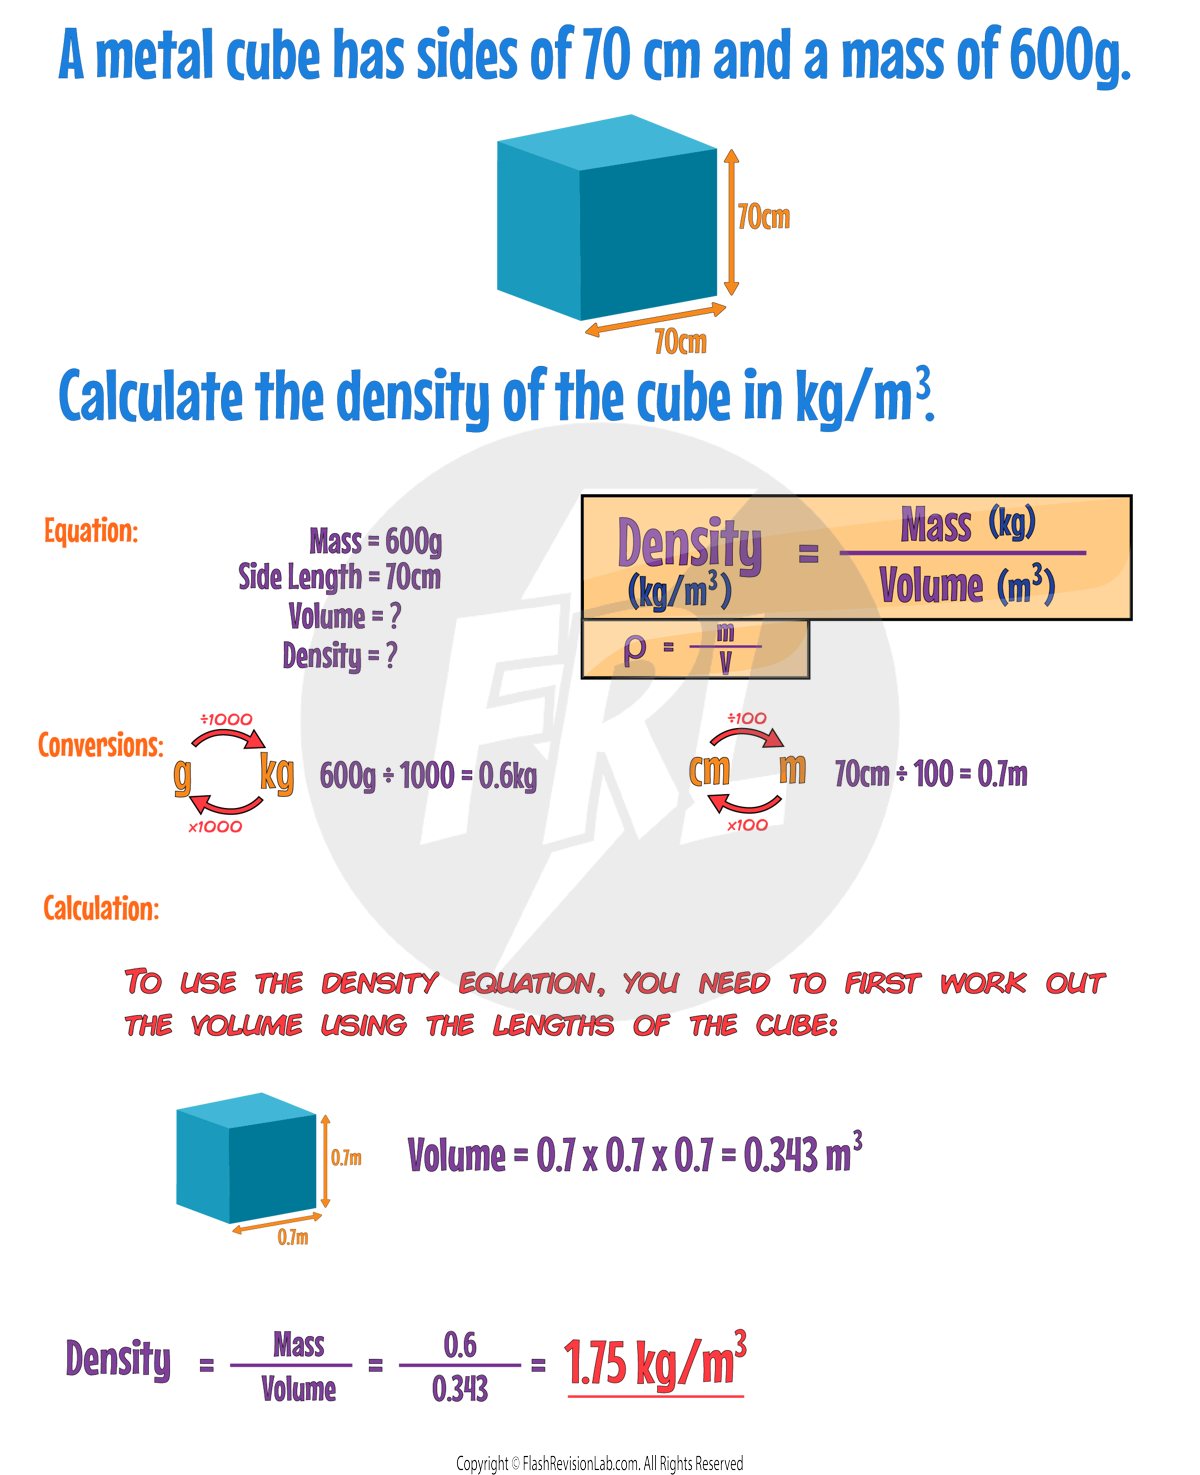
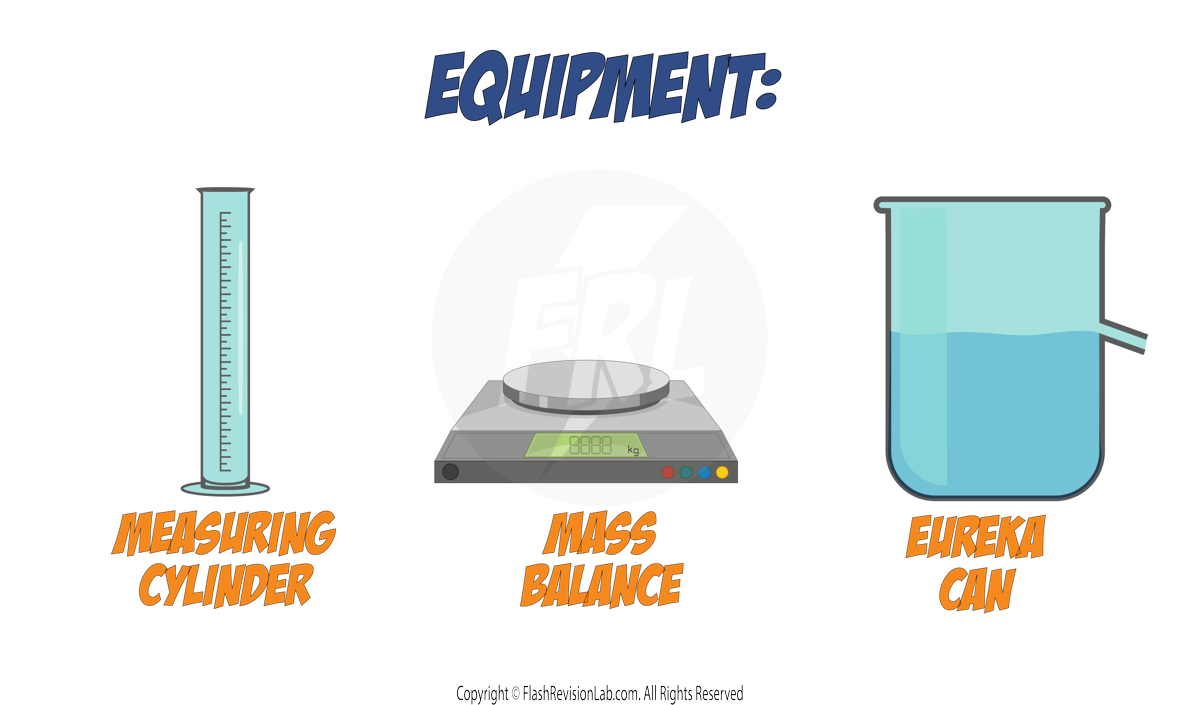
Required Practical: Density
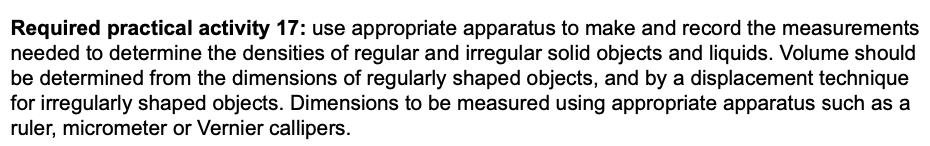
This practical involves calculating the density of a REGULAR object and an IRREGULAR object:
Regular Objects:
To find the DENSITY of a regular-shaped object like a box:
- Measure the LENGTH, WIDTH, and HEIGHT of the box and multiply these dimensions to calculate the VOLUME.
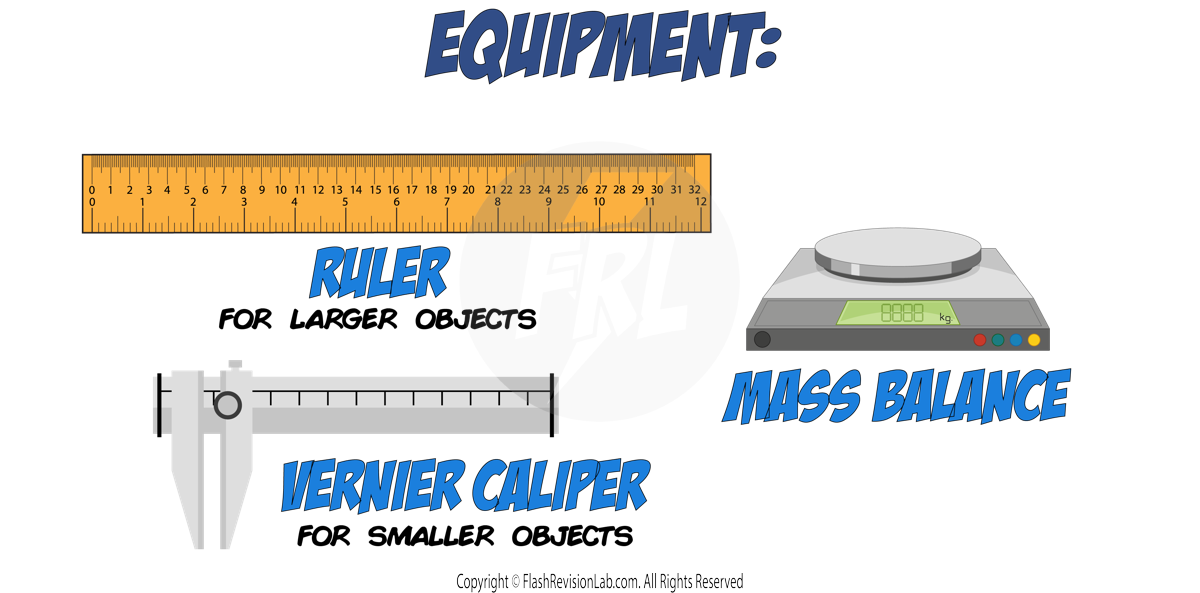
- Use a MASS BALANCE to determine the MASS of the box.
- Apply the values to the DENSITY EQUATION.
For Irregular Objects:
For objects with an irregular shape, such as a key, the DISPLACEMENT TECHNIQUE is used:
- Measure the MASS of the object using a MASS BALANCE.
- Fill a Eureka can with water to the brim, and place a MEASURING CYLINDER under the spout.
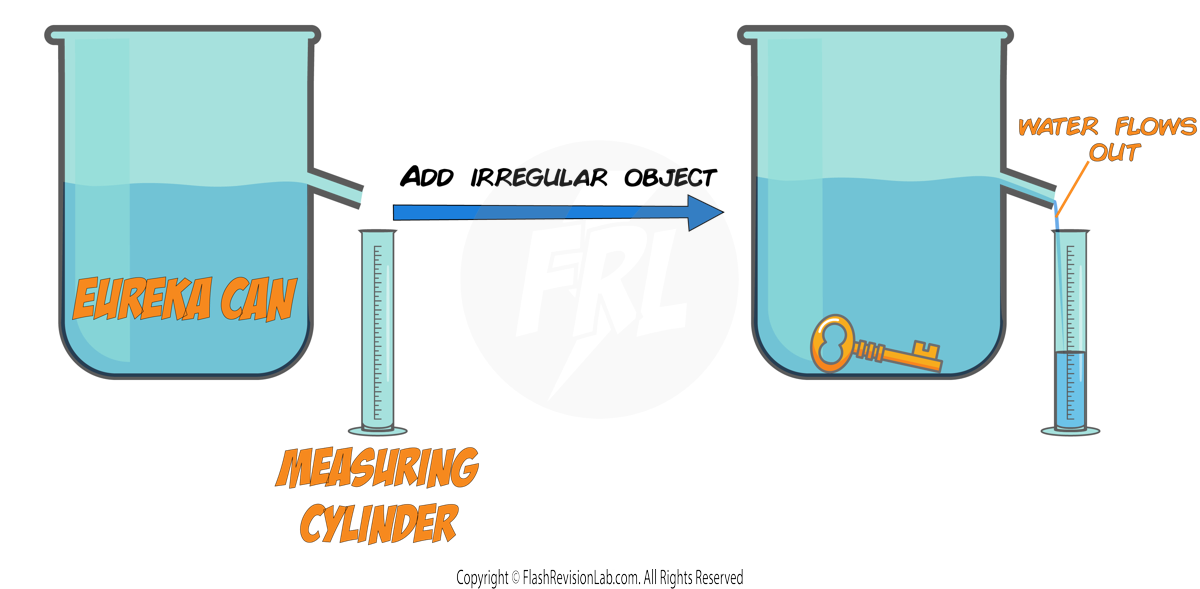
- Submerge the irregular object in the Eureka can. The water displaced will pour into the measuring cylinder.
- The VOLUME of water displaced and collected in the measuring cylinder, equals the VOLUME of the object.
- Use both the MASS and the VOLUME in the DENSITY EQUATION to calculate the object's DENSITY.
States of Matter
Matter is made up of tiny particles and can exist in three main states: solid, liquid, and gas. The PARTICLE MODEL of matter helps explain these states:
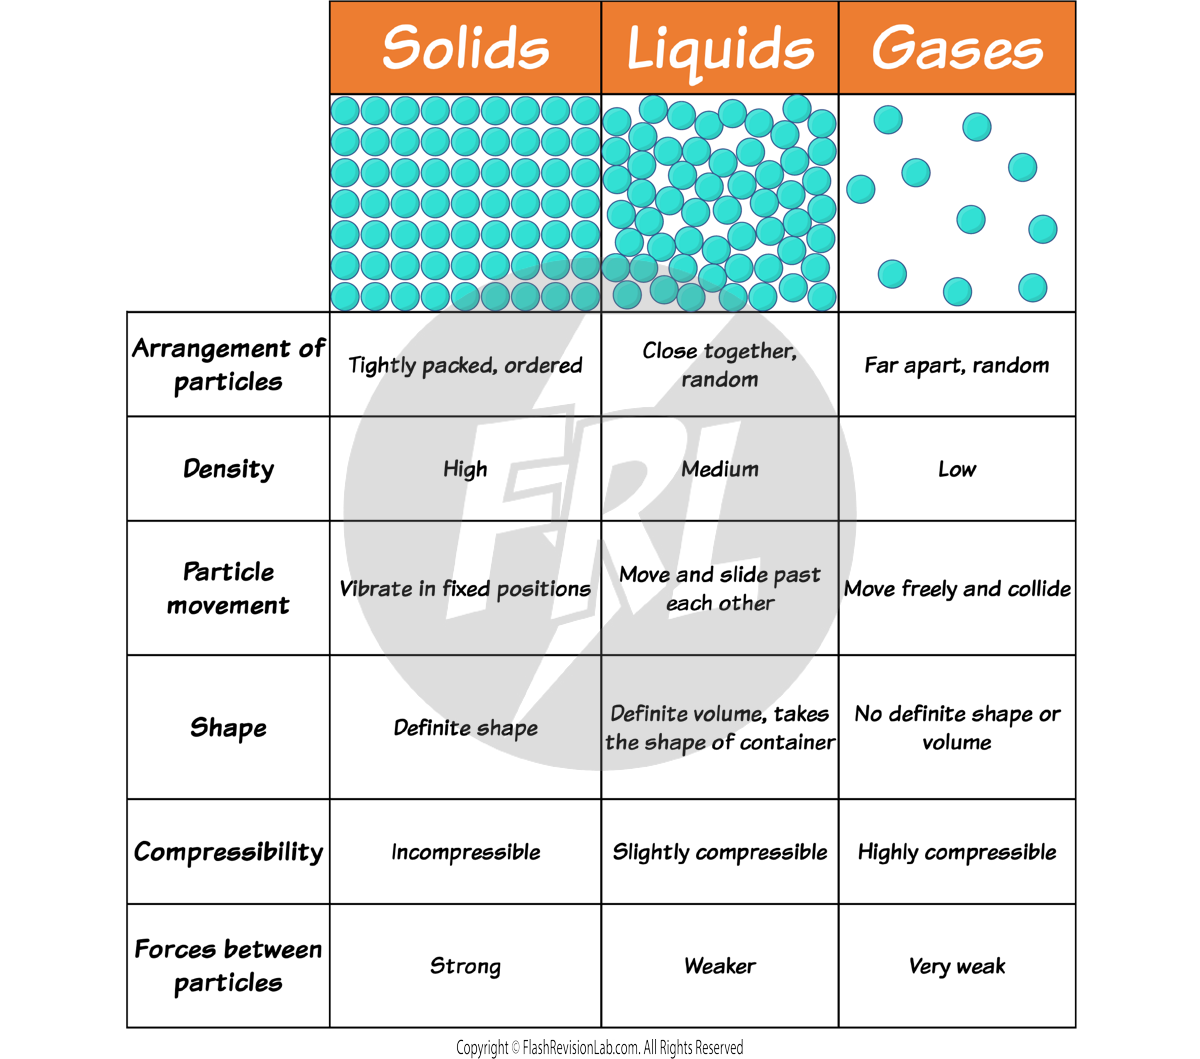
- SOLIDS: Particles are tightly packed in a FIXED, REGULAR PATTERN. They have strong forces between them and can only vibrate in place, giving solids a DEFINITE SHAPE and VOLUME.
- LIQUIDS: Particles are close but can move past each other due to WEAKER FORCES of attraction. This allows liquids to flow and take the shape of their container while maintaining a CONSTANT VOLUME.
- GASES: Particles in a gas move freely at high speeds due to VERY WEAK OR NO FORCES of attraction between them. Gases have NO FIXED SHAPE or volume and will EXPAND to fill any container.
DENSITY DIFFERENCES
The density of a substance is a measure of how tightly packed its particles are.
- In solids, particles are packed closely, which usually makes solids the MOST DENSE state of matter.
- Liquids are less dense than solids because their particles are more spread out.
- Gases are the LEAST DENSE, as their particles are far apart and move freely.
CHANGES OF STATE
When a substance changes from one state to another, like melting or boiling, it's a PHYSICAL CHANGE. The mass of the substance doesn't change during this process—MASS IS CONSERVED.
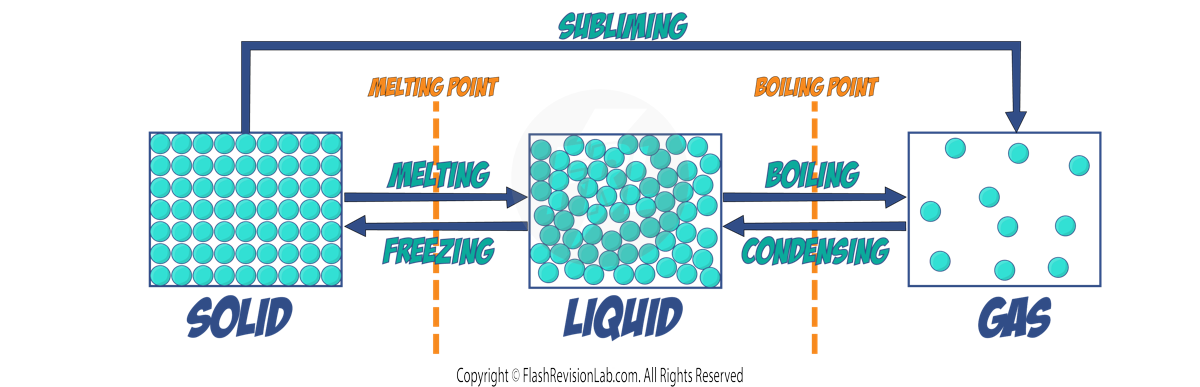
- When a solid turns into a liquid, it MELTS.
- When a liquid turns into a solid, it FREEZES.
- When a liquid turns into a gas, it BOILS.
- When a gas turns into a liquid, it CONDENSES.
- When a solid turns directly into a gas, it SUBLIMATES.
Changes of state are PHYSICAL changes which differ from CHEMICAL changes because the material recovers its original properties if the change is reversed.
Internal Energy
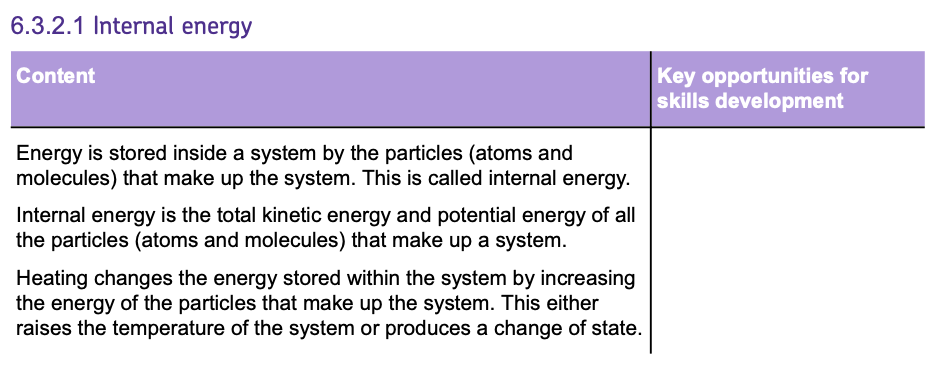
INTERNAL ENERGY is the total energy that particles in a system have from their MOVEMENT and POSITION. It's made up of:
- KINETIC ENERGY STORES: Due to the VIBRATION or MOVEMENT of particles.
- POTENTIAL ENERGY STORES: Due to the POSITION of particles within the system.
UNDERSTANDING INTERNAL ENERGY
- Particles are always moving (vibrating or rotating) and this movement contributes to the system's KINETIC ENERGY.
- Particles also have POTENTIAL ENERGY because of the forces between them. Their position within the field of these forces determines their potential energy.
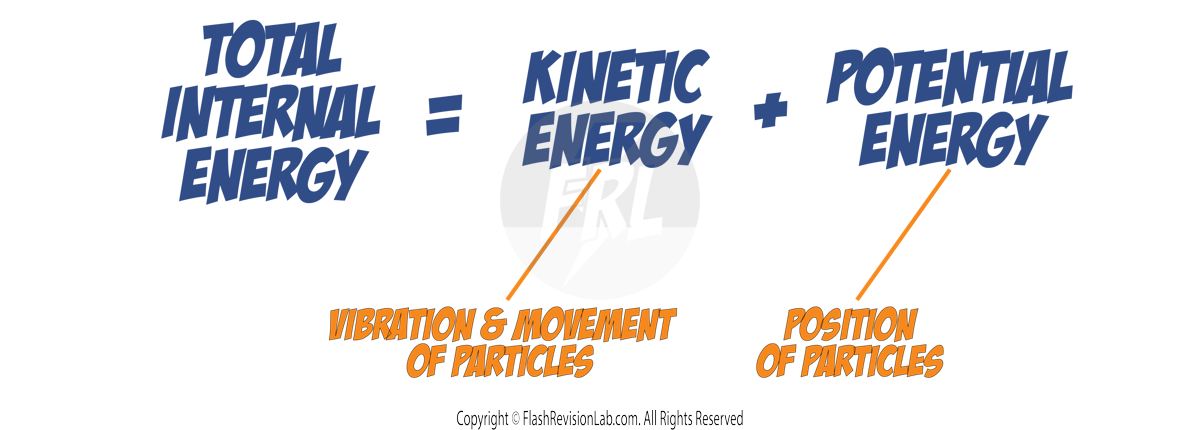
The sum of KINETIC and POTENTIAL ENERGY in all particles is the TOTAL INTERNAL ENERGY of the system.
CHANGES IN INTERNAL ENERGY
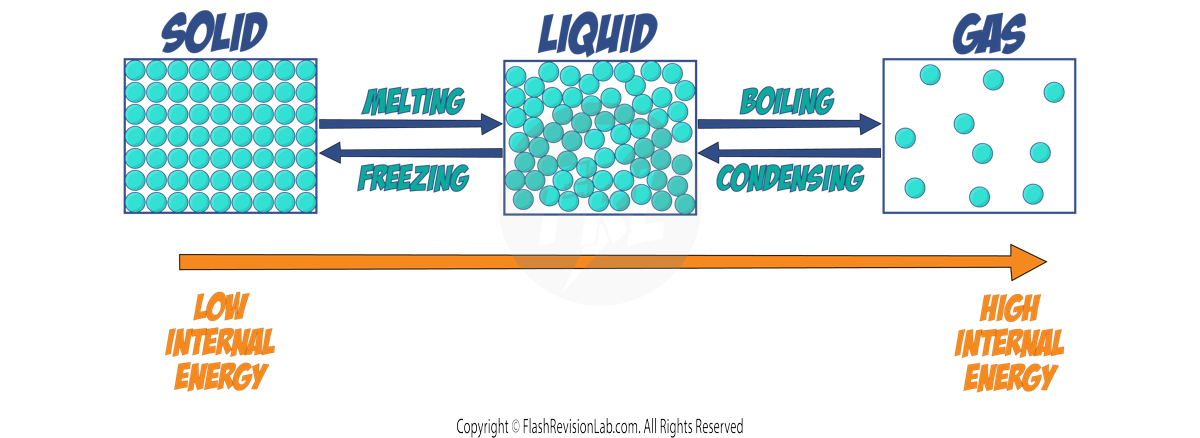
- HEATING a system will INCREASE its internal energy.
- This is because it transfers energy to the particles, increasing their KINETIC ENERGY, which often results in a CHANGE IN TEMPERATURE.
- If the system's temperature changes, it can also lead to a CHANGE IN STATE—from solid to liquid or liquid to gas.
- The extent of temperature change from a given energy input depends on the substance’s MASS and SPECIFIC HEAT CAPACITY. (See previous notes)
LATENT HEAT
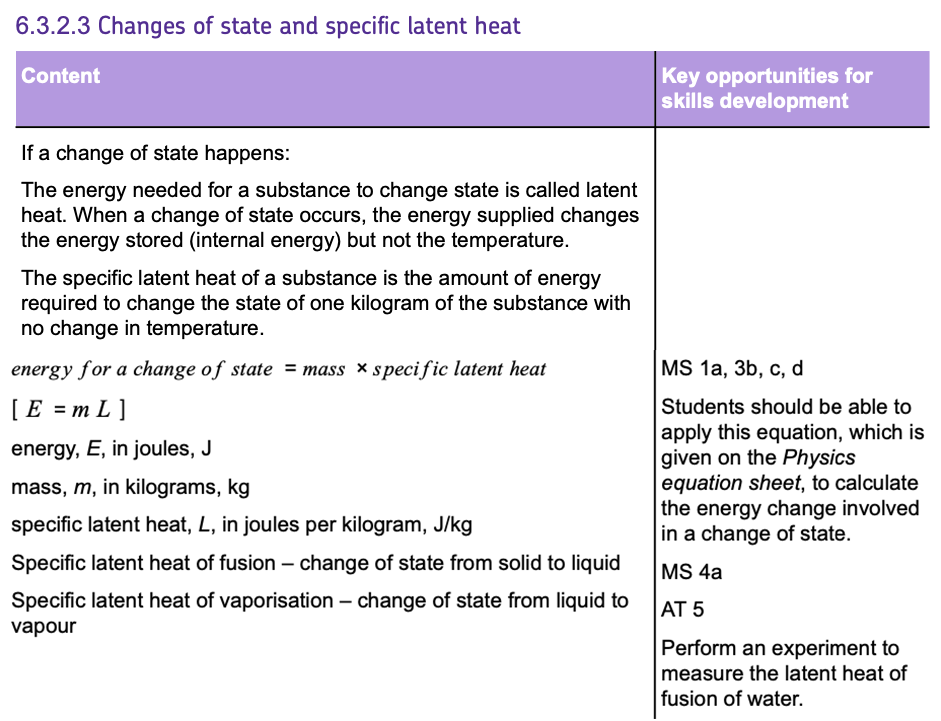
- The energy required for a substance to change its state is known as LATENT HEAT.
- When a change of state occurs in a substance, the energy supplied changes the INTERNAL ENERGY (energy stored) in the substance but NOT the TEMPERATURE.
- This is because the energy is used to break the FORCES of attraction between molecules (which raises the potential energy of the substance), rather than raising the temperature of the substance (which increases the molecules' kinetic energy).
SPECIFIC LATENT HEAT
The SPECIFIC LATENT HEAT of a substance is the amount of energy required to change the state of 1kg of the substance with no change in temperature.
By knowing the SPECIFIC LATENT HEAT of a substance, the energy change involved in a change of state can be calculated using the equation:
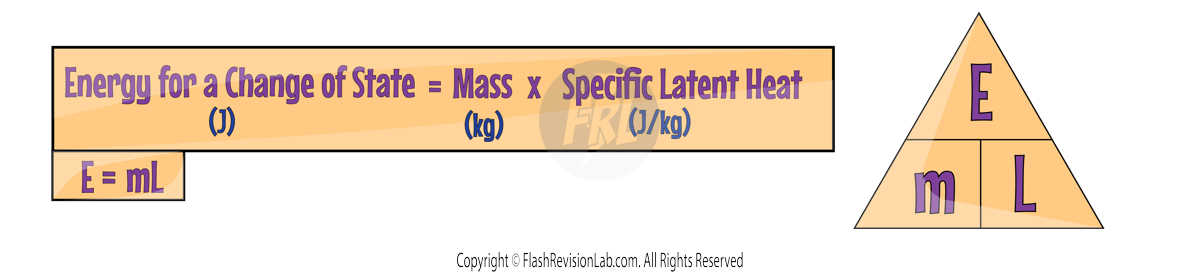
Where:
- E = energy in Joules (J).
- m = mass in Kilograms (kg).
- L = specific latent heat in Joules per kilogram (J/kg).
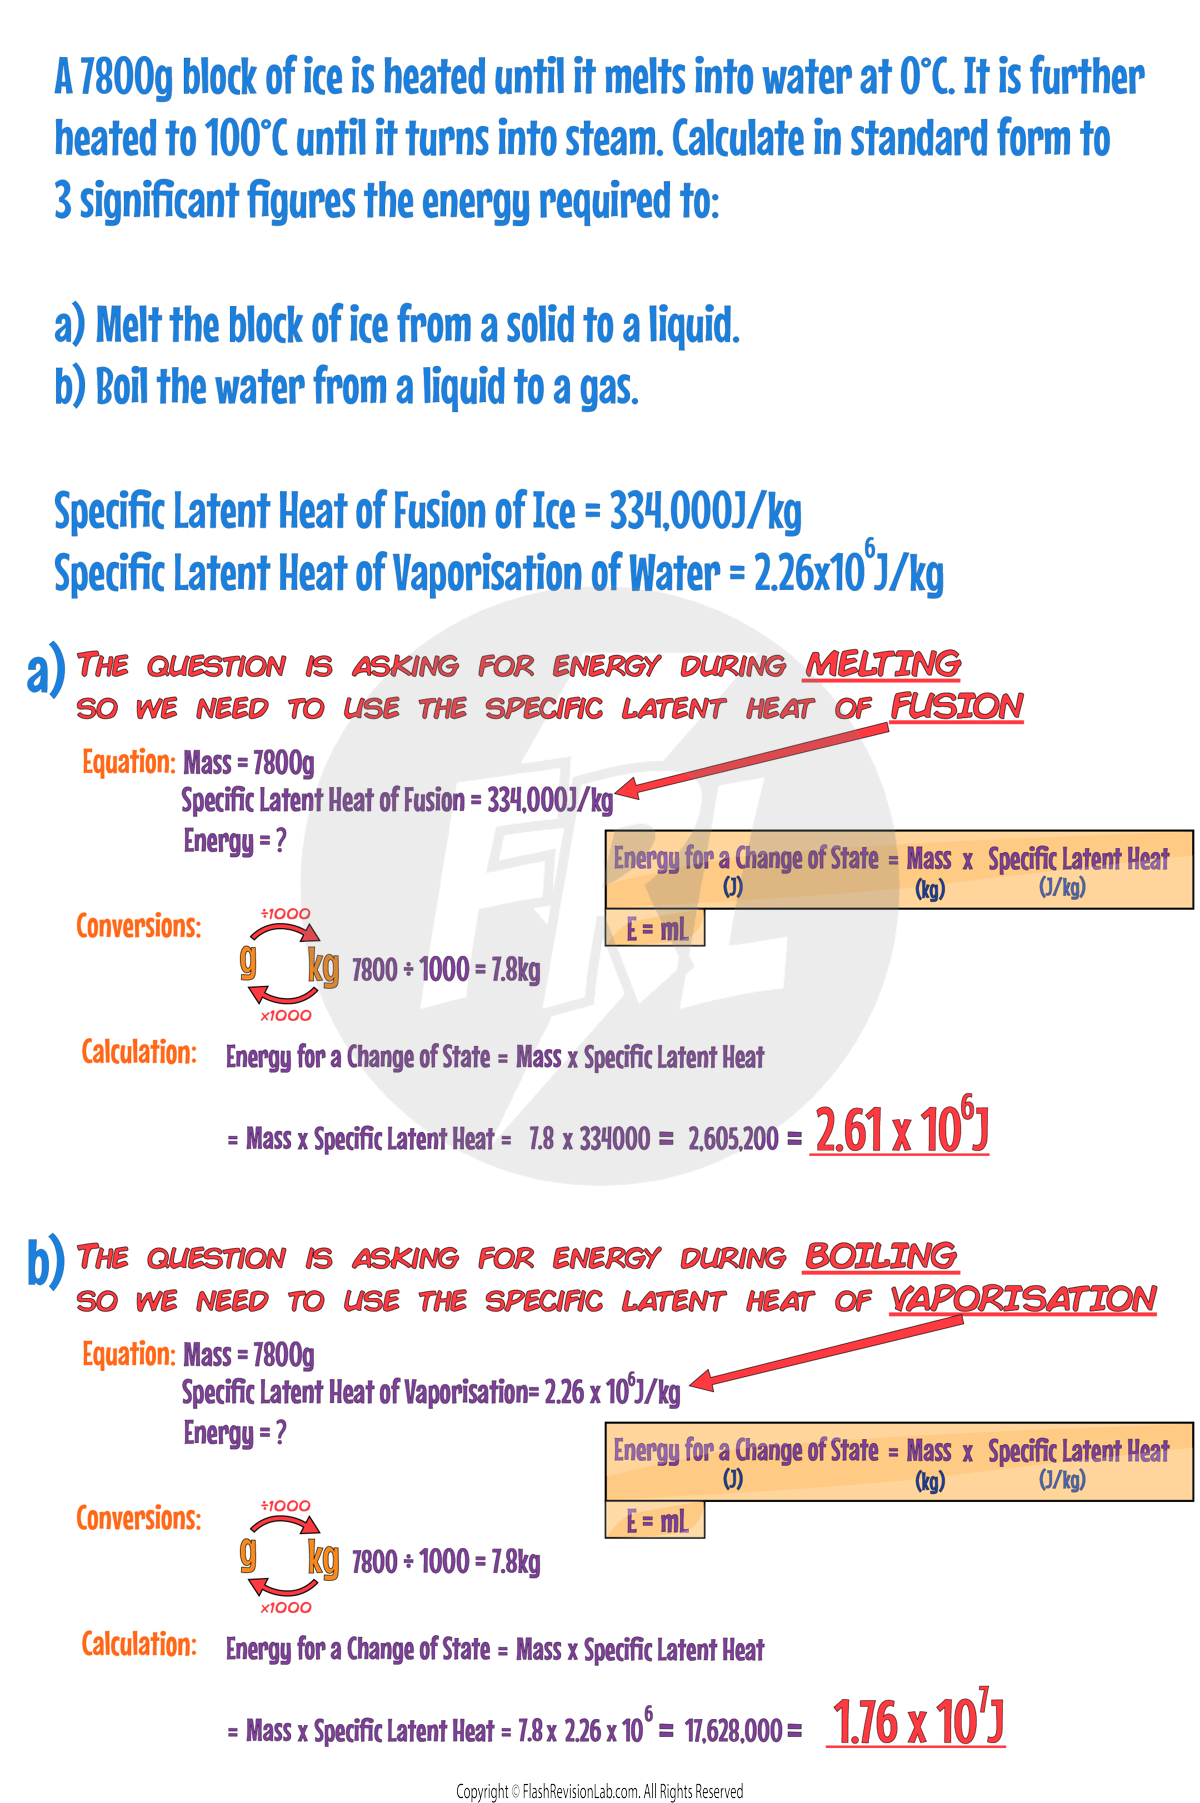
When using this equation, there are TWO types of specific latent heat that can be used:
1. Specific Latent Heat of FUSION
This is used when the state changes from SOLID to LIQUID (melting).
2. Specific Latent Heat of VAPORISATION
This is used when the state changes from LIQUID to GAS (boiling).
Make sure to use the correct type of SPECIFIC LATENT HEAT in your calculations:
Specific Heat Capacity vs. Specific Latent Heat
Specific heat capacity and specific latent heat are similar to each other but they have some differences:
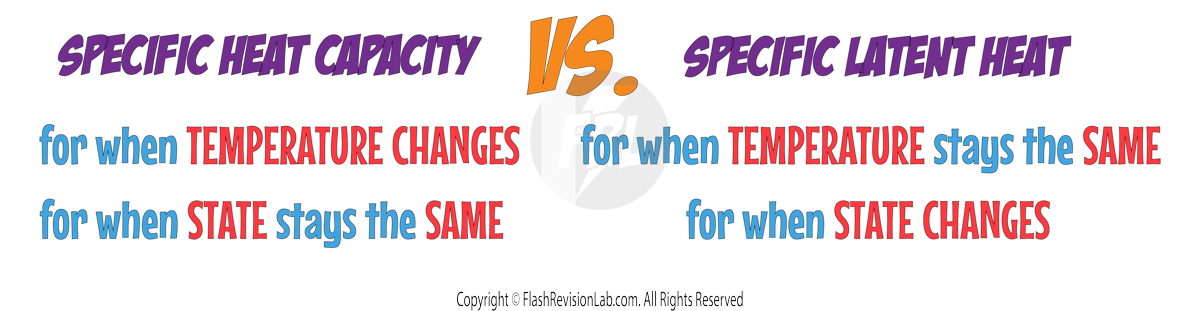
- SPECIFIC HEAT CAPACITY is the amount of heat energy required to raise the temperature of 1 kilogram of a substance by 1 degree Celsius without changing its state.
- For example, heating water from 5 °C to 20 °C, the water remains liquid throughout the heating process.
- SPECIFIC LATENT HEAT refers to the amount of heat energy needed to change the state of 1 kilogram of a substance WITHOUT changing its temperature. This energy is used for breaking or forming forces (bonds) during a state change, such as water boiling to become steam or ice melting to become water. During this change, the temperature of the substance does NOT increase.
Heating and Cooling Graphs
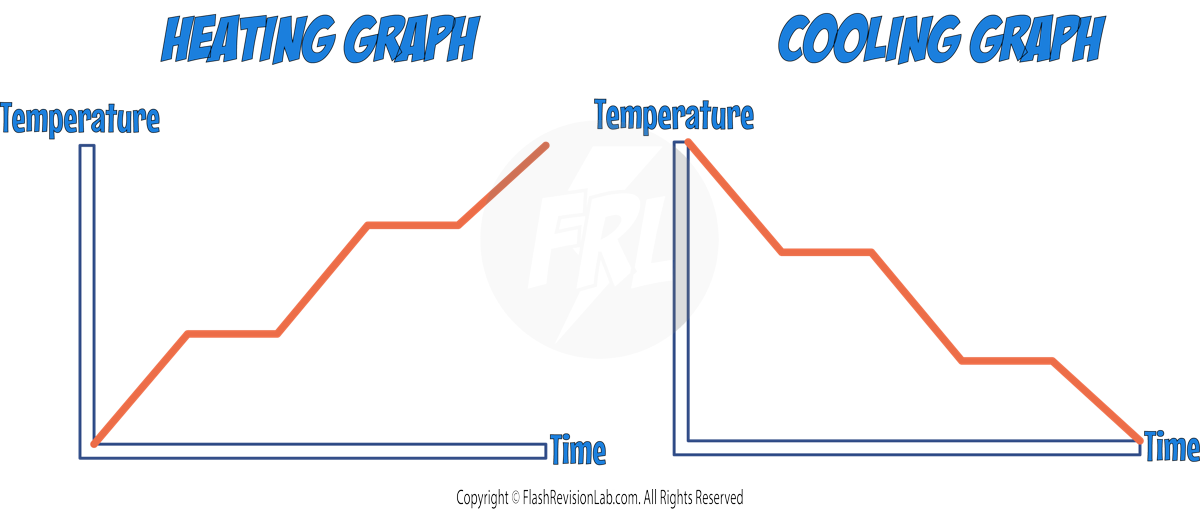
Heating and cooling graphs provide a visual representation of temperature changes in a substance as energy is either ADDED to or REMOVED from it. They indicate the points at which CHANGES OF STATE occur.
These graphs typically follow a similar pattern: during heating, energy is transferred to the substance, increasing the molecules' KINETIC ENERGY, while cooling involves energy being transferred away, resulting in a decrease in the molecules' KINETIC ENERGY.
Heating Graphs:
This graph depicts the relationship between temperature and time for a substance as it changes state from solid to liquid to gas:
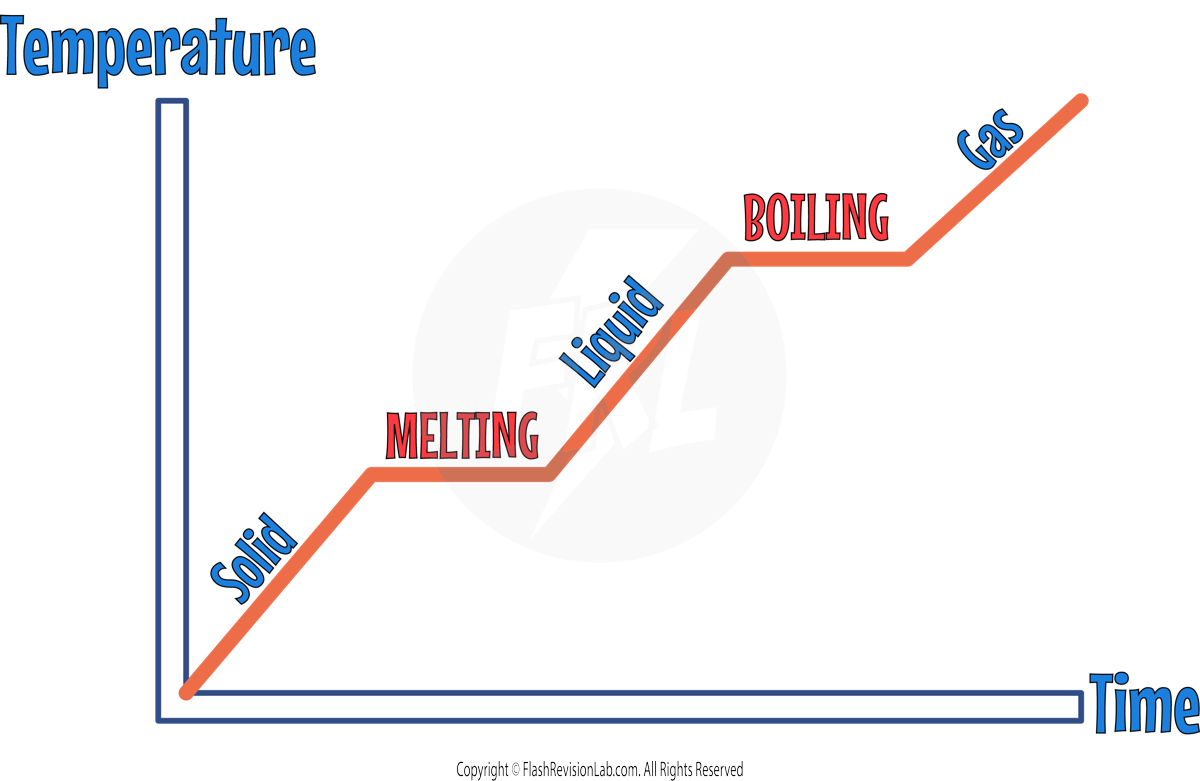
- Starting on the left, the initial upward slope indicates an increase in temperature as a SOLID. The substance's temperature rises steadily as it absorbs heat, causing its particles to vibrate more energetically.
- The first HORIZONTAL line, represents the MELTING. Here, the temperature remains CONSTANT despite the continued input of heat. This is because the energy is used to BREAK BONDS (forces) that hold the solid particles in place, rather than increasing their KINETIC ENERGY. This phase change from solid to liquid occurs at a specific temperature known as the MELTING POINT.
- After the substance has completely melted into a LIQUID, the temperature begins to rise again with further heat input, shown by the upward slope following the horizontal section. The liquid's particles gain KINETIC energy and move more freely.
- The second HORIZONTAL line signifies the BOILING point where the liquid begins to change into a GAS. The temperature does not increase during this phase change because the energy goes into BREAKING the BONDS (forces) that hold the liquid particles together. This is the BOILING point where the substance transitions from liquid to gas.
- As the phase change completes, the temperature rises once more, as shown by the final upward slope indicating the substance is now in the GASEOUS STATE. The particles are moving rapidly due to the high kinetic energy from the absorbed heat.
Cooling Graphs:
Cooling graphs are the opposite of heating graphs and illustrate the changes in temperature over time as a substance transitions from gas to solid:
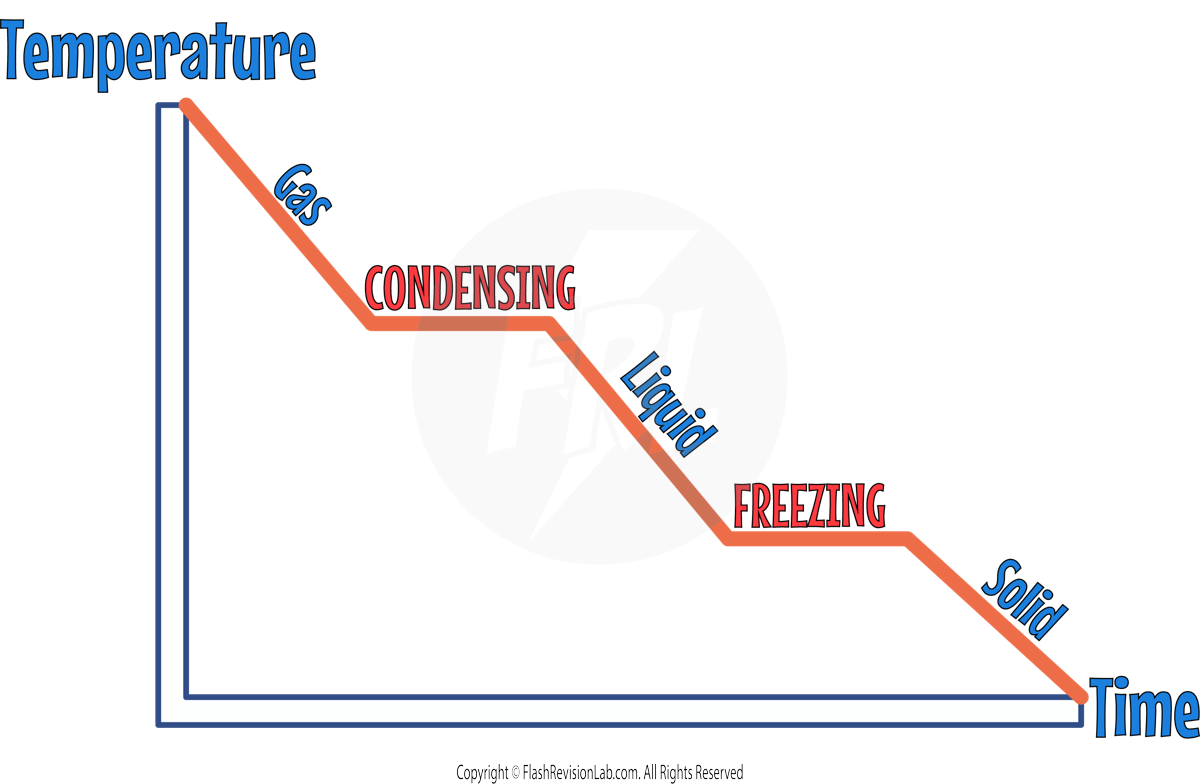
- Starting from the left, the substance begins as a GAS. As it loses energy, the temperature decreases, shown by the downward slope.
- The first HORIZONTAL line, indicates the process of CONDENSING, where the gas turns into a liquid. During this phase change, the temperature remains constant despite the continuous loss of energy. This is because the energy removed is being used to change the state of the substance and MAKE BONDS (forces) between the particles rather than lowering the temperature.
- Following condensation, the temperature of the now liquid substance continues to decrease with further energy loss, as indicated by the next downward slope.
- The second HORIZONTAL line represents FREEZING, where the liquid turns into a solid. Similar to condensation, the temperature does not change during this phase transition. The energy is being used to change the state, in this case by CREATING BONDS (forces) that turn the liquid into a solid.
- After the substance has completely frozen into a SOLID, any further energy loss will once again result in a decrease in temperature, continuing the downward trend on the graph.

Particle Motion in Gases
GASES consist of a large number of small particles, which are molecules or atoms. These particles are in CONSTANT RANDOM MOTION and move in straight lines until they collide with either the container walls or other particles.
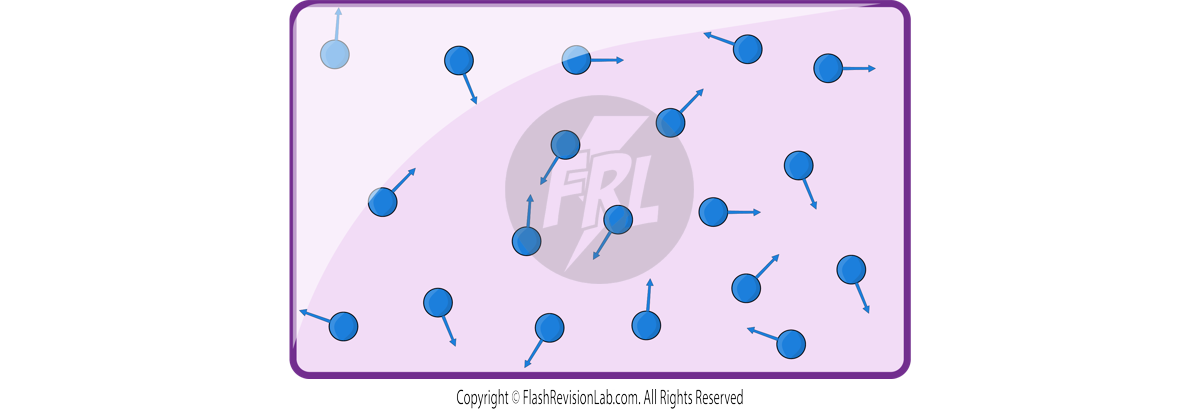
Temperature
- As the TEMPERATURE of a gas rises, so does the SPEED of its molecules. This is because temperature is a measure of the AVERAGE KINETIC ENERGY of the molecules in a substance.
- If we keep the VOLUME of the gas constant and increase the temperature, the kinetic energy will increase. Higher kinetic energy means the molecules move faster.
Pressure
- PRESSURE in a gas is the result of COLLISIONS between the gas MOLECULES and the CONTAINER WALLS.
- The MORE MOLECULES you have in a given volume, the HIGHER the pressure.
- This is because gas molecules collide MORE FREQUENTLY and with GREATER FORCE against the container walls.
- The UNITS for pressure can be measured in (Pascals) Pa or (Atmospheres) atm.
Temperature-Pressure Relationship
- If we heat a gas up, the molecules gain KINETIC ENERGY and move at HIGHER SPEEDS, leading to MORE FREQUENT and FORCEFUL collisions with the container walls, which INCREASES the PRESSURE.
- Therefore, at a CONSTANT VOLUME, an INCREASE in TEMPERATURE will lead to an INCREASE in PRESSURE.
Structure of an Atom
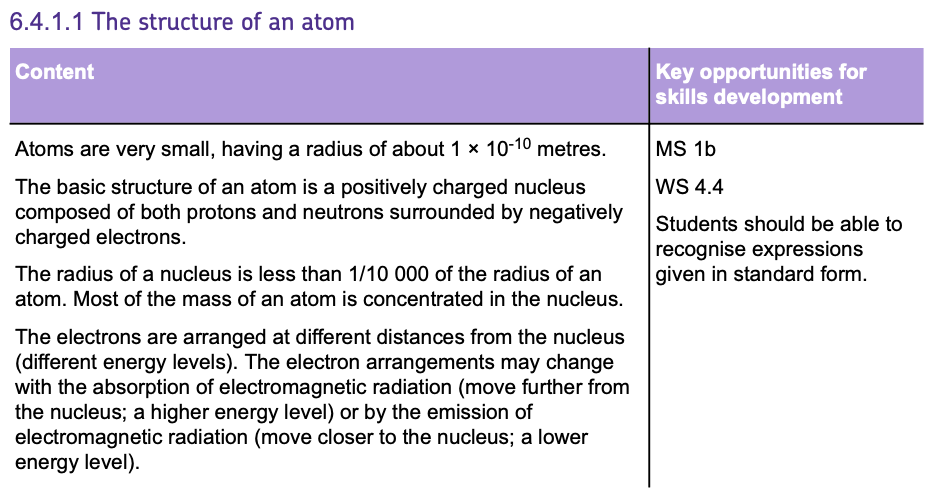
- ATOMS are incredibly SMALL, and make up EVERYTHING in the universe.
- They are the SMALLEST part of an ELEMENT that can exist.
- They are composed of THREE even smaller particles known as SUB-ATOMIC PARTICLES: PROTONS, NEUTRONS, and ELECTRONS.
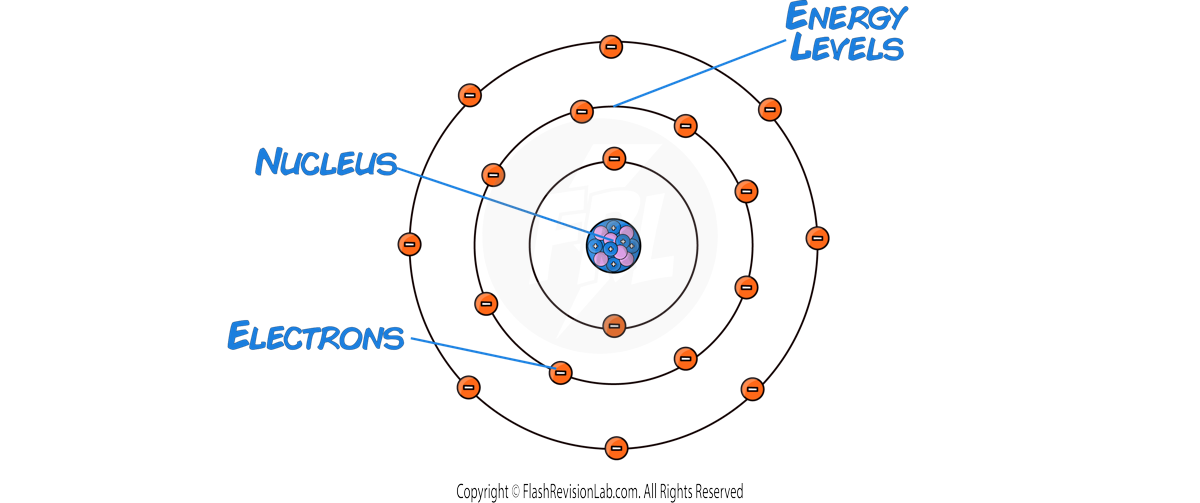
- At the center of an atom lies the NUCLEUS, containing PROTONS and NEUTRONS.
- PROTONS have a positive charge (+1).
- NEUTRONS have no charge (0).
- ELECTRONS are negatively charged (−1).
- They orbit the nucleus at different distances from the nucleus known as ENERGY LEVELS (shells).
- Sometimes electrons can MOVE to a HIGHER or LOWER ENERGY LEVEL.
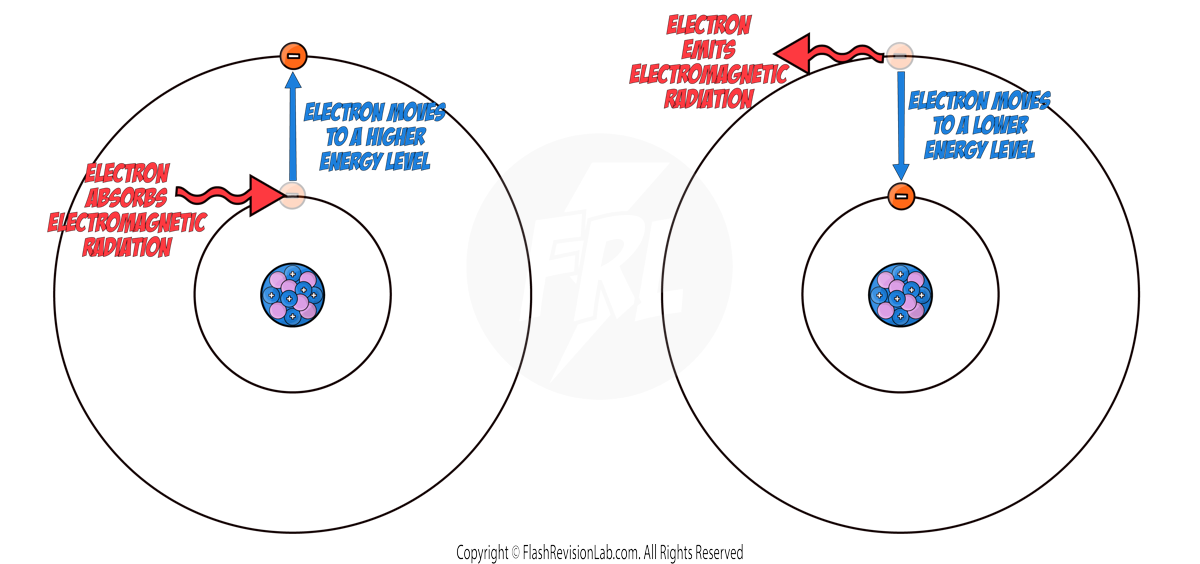
- When an electron ABSORBS ELECTROMAGNETIC RADIATION, it MOVES to a HIGHER energy level FURTHER from the nucleus.
- When an electron EMITS ELECTROMAGNETIC RADIATION, it MOVES to a LOWER energy level CLOSER to the nucleus.
- The NUCLEUS is tiny compared to the whole atom, about 1/10,000 of the atom's total size, but it holds nearly ALL the atom's mass.
Radius of an ATOM: 1 x 10⁻¹⁰ m
Radius of a NUCLEUS: 1 x 10-14 m
- Atoms are NEUTRAL and have NO OVERALL CHARGE.
- This is because they have the SAME NUMBER OF PROTONS AND ELECTRONS, which CANCELS OUT THEIR CHARGES.
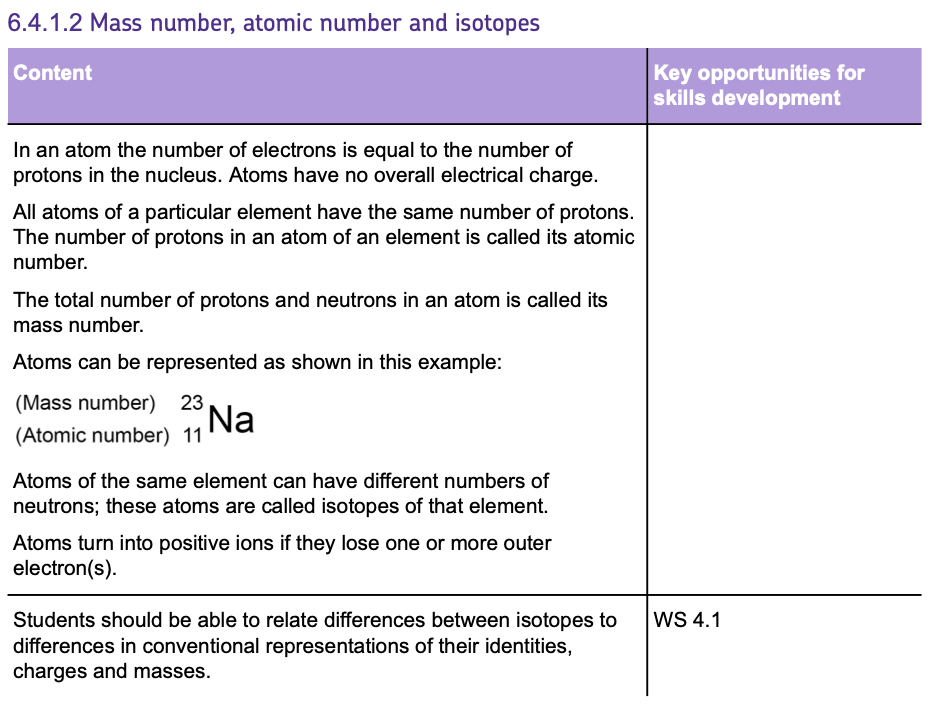
Mass Number, Atomic Number and Isotopes
- Atoms of each element are represented by a CHEMICAL SYMBOL which can be found in the PERIODIC TABLE. E.g. Carbon has the symbol C.
- They can be represented as below:
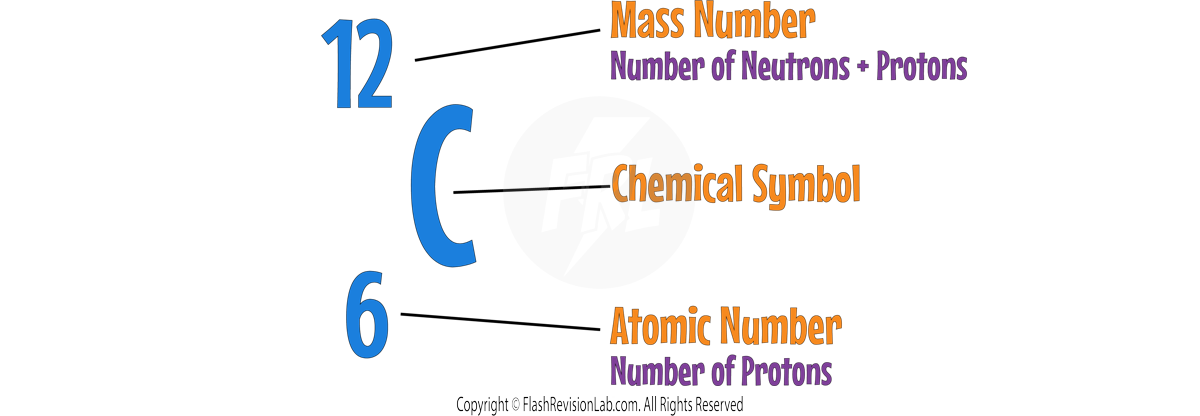
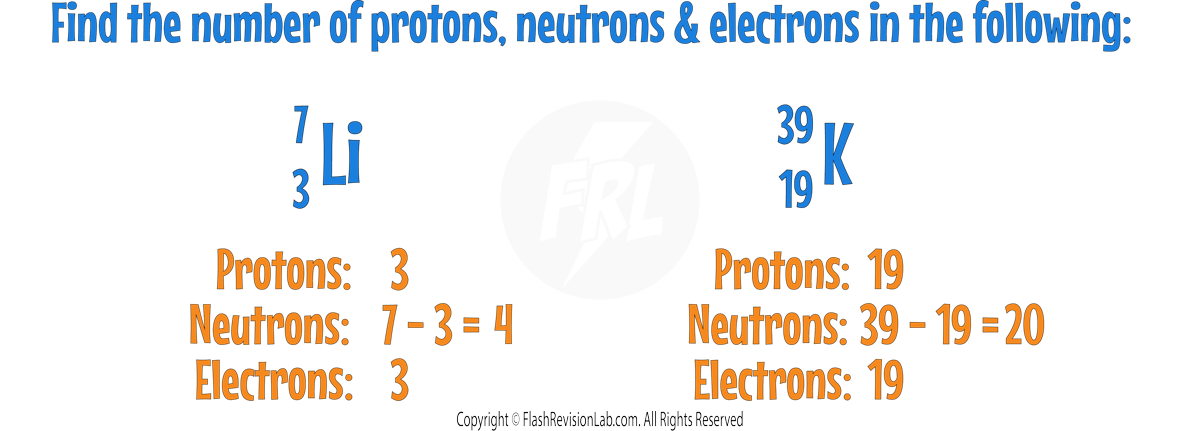
- The ATOMIC NUMBER indicates how many protons are in an atom's nucleus.
- The MASS NUMBER is the total count of both protons and neutrons.
- To find the number of NEUTRONS, SUBTRACT the atomic number from the mass number.
Elements
- An ELEMENT is a substance made up of ONE TYPE OF ATOM.
- All the atoms in an element contain the SAME NUMBER of PROTONS in their nucleus.
- When atoms have different numbers of PROTONS, they are classified as DIFFERENT elements.
- This means the ATOMIC NUMBER determines the ELEMENT. For example, Carbon atoms ALWAYS have 12 protons (has an atomic number of 12).
Positive Ions
- Sometimes, radiation can cause electrons to be REMOVED from an atom in a process known as IONISATION.
- When this happens, an atom LOSES electrons to turn into a POSITIVE ION.
Isotopes
- All atoms of a particular ELEMENT have the same ATOMIC NUMBER but may have different numbers of NEUTRONS.
- ISOTOPES are different forms of the same element, having the SAME NUMBER OF PROTONS (same atomic number) but DIFFERENT NUMBERS OF NEUTRONS (different mass numbers).
- A common example is carbon-12, carbon-13 and carbon-14 which all have six protons but differ in the number of neutrons:
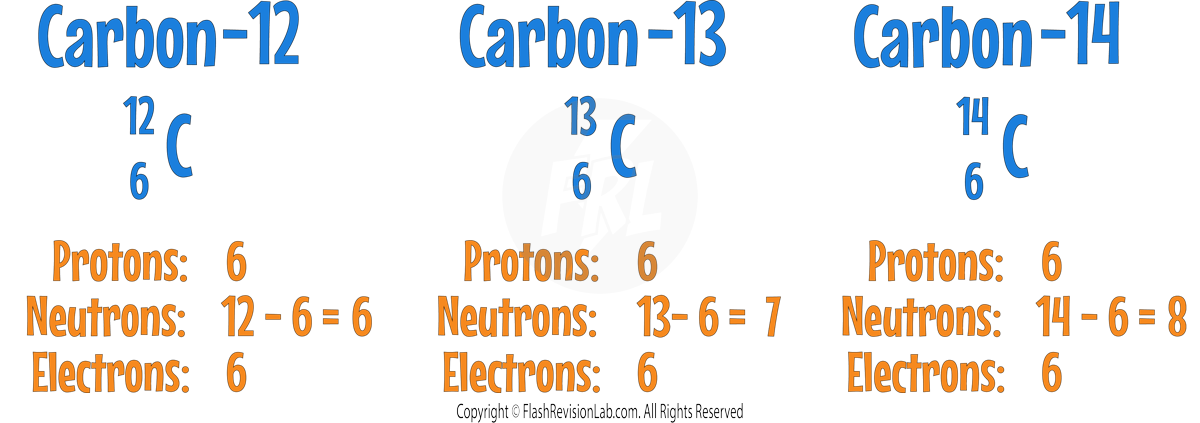
- The number of neutrons in an atom does NOT affect the charge of the atom, only its mass.
- This is because neutrons have no charge but do have mass.
Development of the Model of the Atom
As technology improved and we discovered more information about particles, the model of what we think an atom looks like has changed significantly over time.
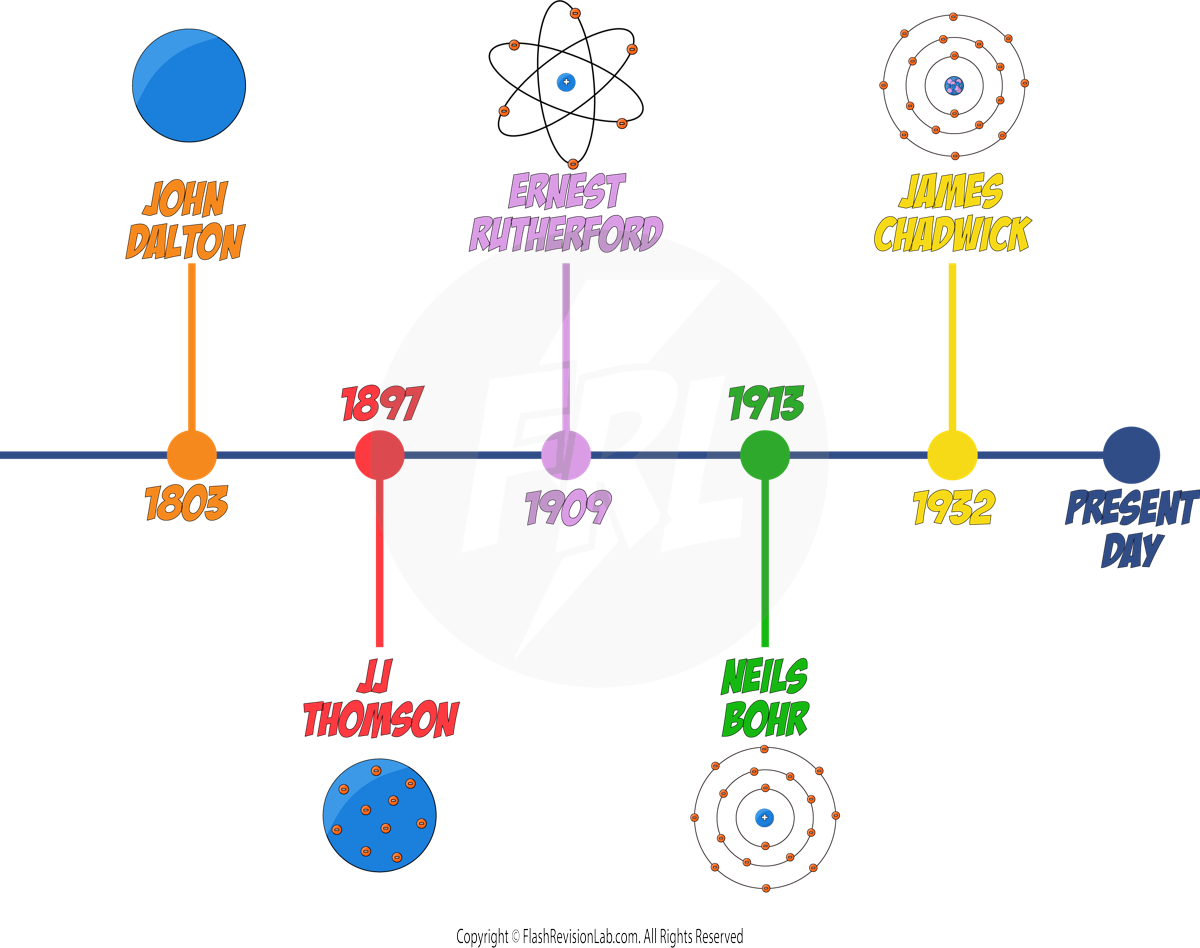
JOHN DALTON
In the early 19th century, JOHN DALTON proposed that atoms were solid SPHERES, and different spheres represented different ELEMENTS.

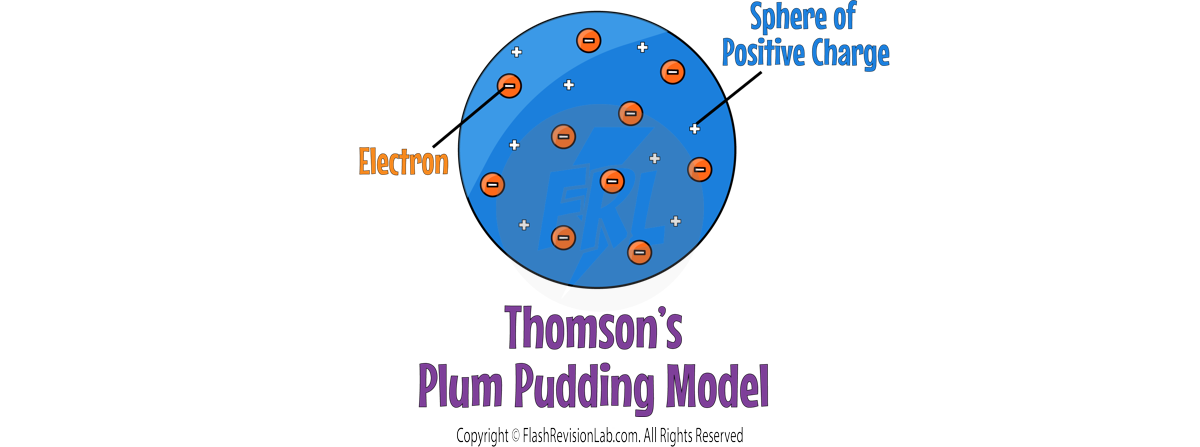
JJ THOMSON
By 1897, JJ. THOMSON had discovered ELECTRONS through experiments, leading to the "PLUM PUDDING MODEL", which showed the atom as a SPHERE of POSITIVE charge with ELECTRONS EMBEDDED within it.
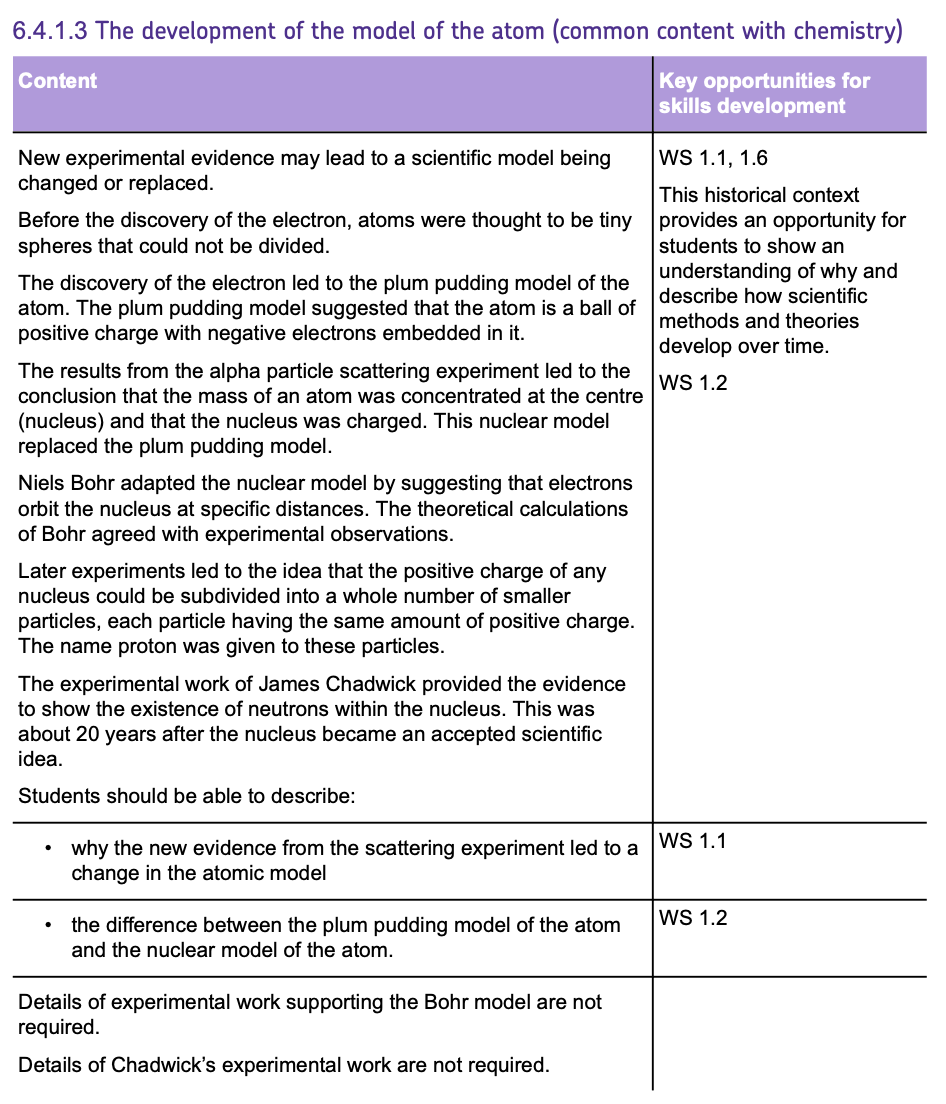
ERNEST RUTHERFORD
- ERNEST RUTHERFORD and his student Ernest Marsden conducted the ALPHA PARTICLE SCATTERING experiment, which disproved the plum pudding model.
- During this experiment, they fired ALPHA PARTICLES at a GOLD FOIL.
- The gold foil was so thin, that they could assume that it was ONE ATOM THICK.
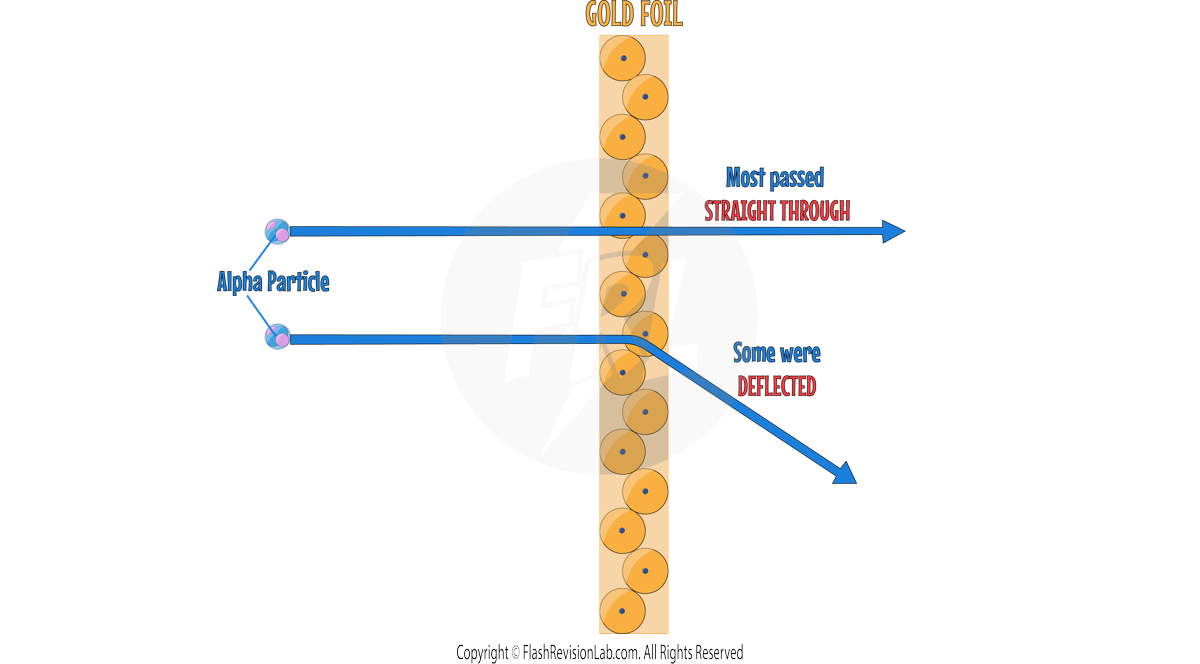
- TWO main observations were made during this experiment which led to TWO discoveries about the atom.
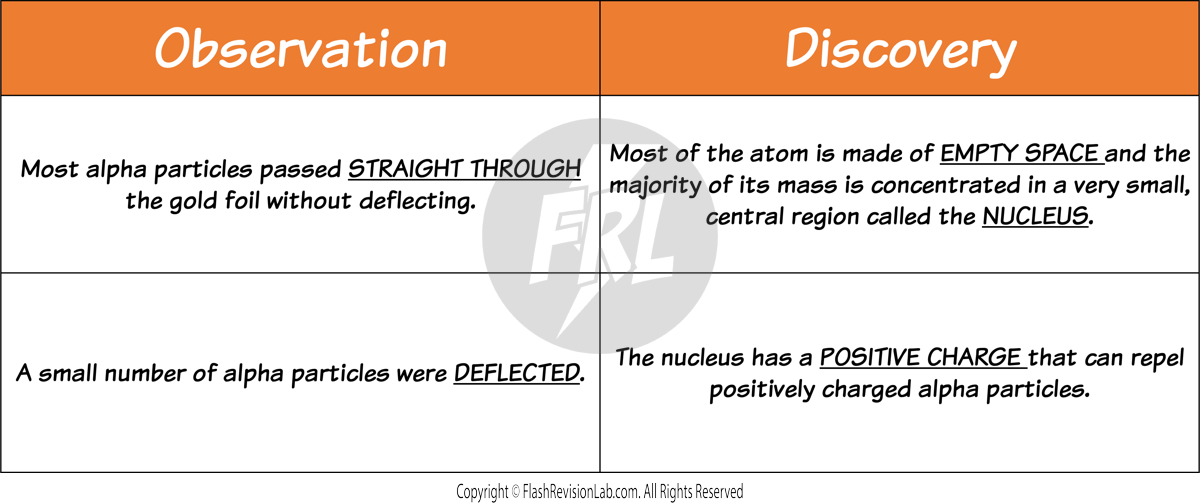
- They observed that most alpha particles passed straight through the gold foil, but some were deflected more than expected. Suggesting a small, dense, positively charged nucleus at the center of the atom.
- The plum pudding model does NOT explain the results because it shows the whole atom as a ball of positive charge with NO EMPTY SPACE.
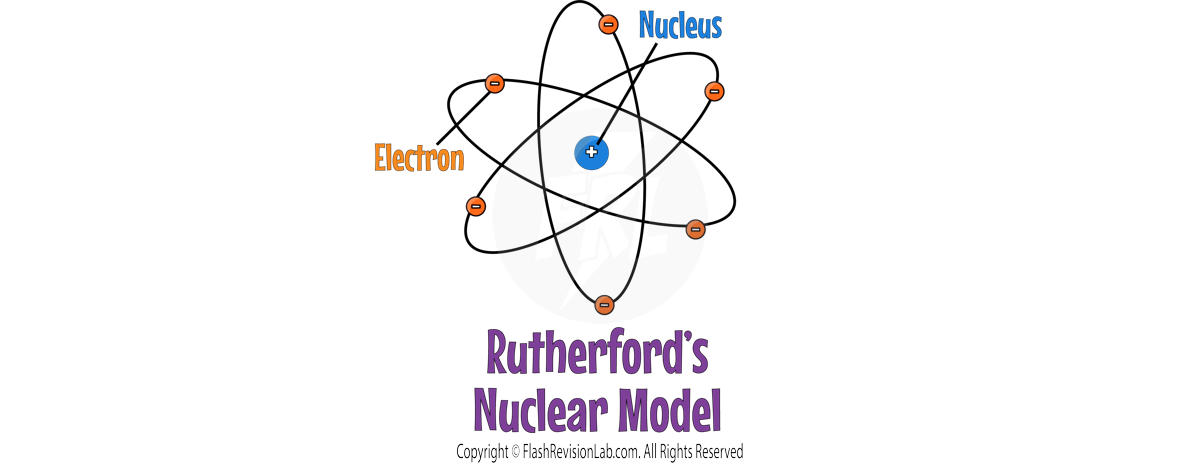
- Rutherford's findings led to the conclusion that the atom consists mostly of empty space, with a dense nucleus surrounded by a cloud of electrons.
NIELS BOHR
- NIELS BOHR refined the nuclear model by introducing the idea that ELECTRONS ORBIT the nucleus in fixed SHELLS.
- Bohr's model suggested that electrons could only occupy certain orbits or ENERGY LEVELS, at FIXED DISTANCES from the nucleus.
- His theoretical calculations agreed with his experimental observations which confirmed his model.
- Bohr carried out further experiments which revealed the nucleus could be SUBDIVIDED into a whole number of smaller particles, each particle having the same amount of POSITIVE charge. These were called PROTONS.

JAMES CHADWICK
- 20 years later, JAMES CHADWICK discovered NEUTRONS, neutral particles in the nucleus, solidifying the nuclear model close to what is accepted today.

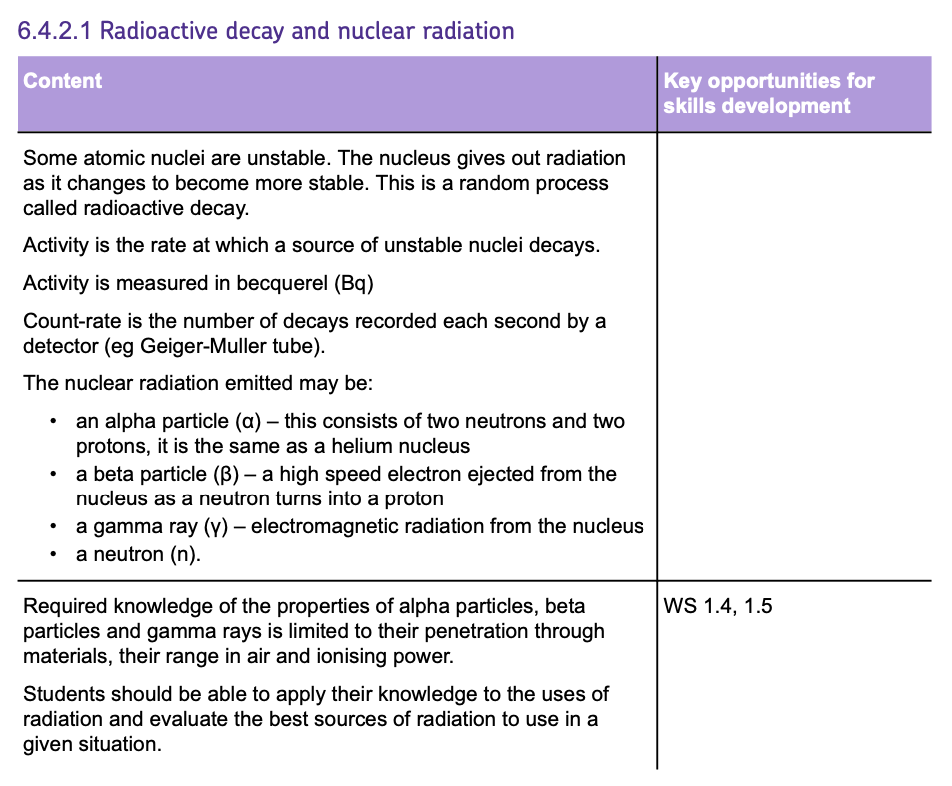
Radioactive Decay and Nuclear Radiation
Radioactive Decay
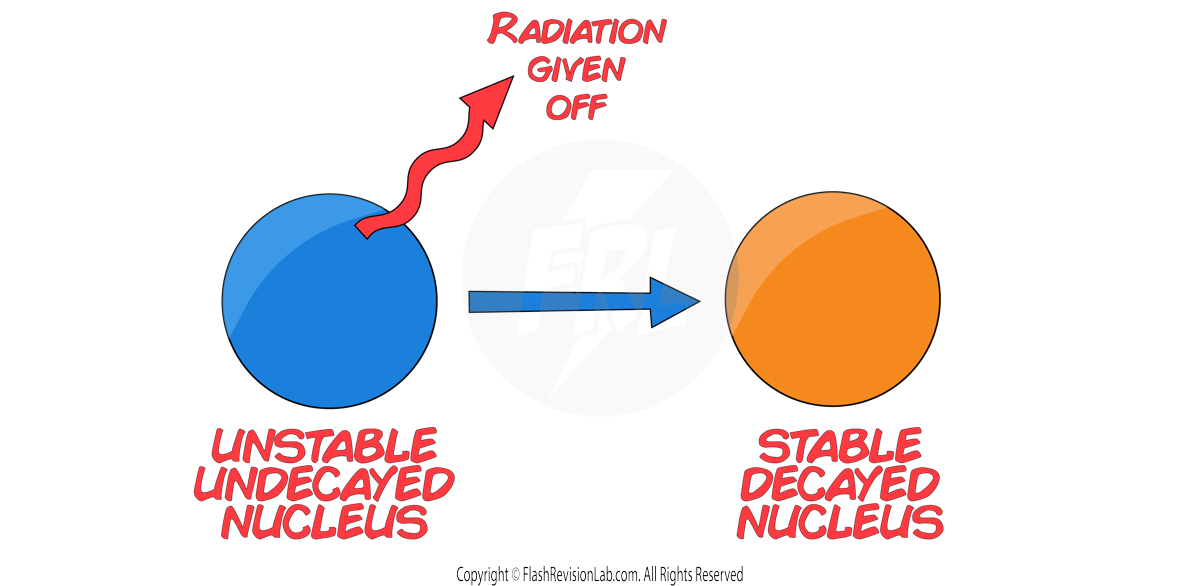
- Some atomic nuclei are STABLE and some are UNSTABLE.
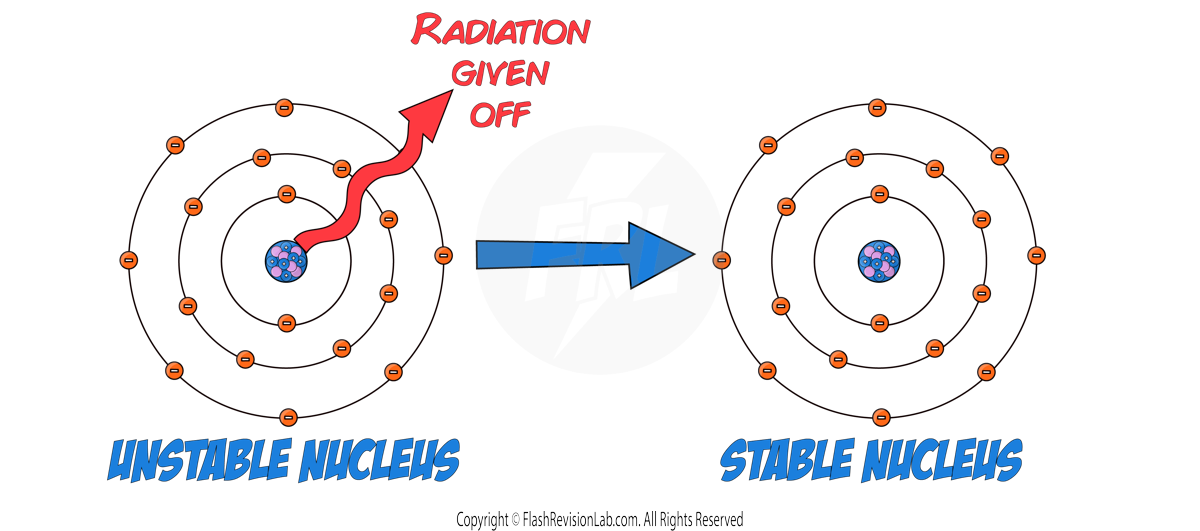
- RADIOACTIVE DECAY is a process where UNSTABLE atomic nuclei release RADIATION to become more STABLE. It is a RANDOM PROCESS.
- The ACTIVITY of a radioactive substance is the rate at which it decays, and it is measured in BECQUERELS (Bq). One Becquerel equals one decay per second.
- COUNT-RATE refers to the number of decays detected per second. It is measured with an instrument known as a GEIGER-MULLER TUBE.
Types of Nuclear Radiation
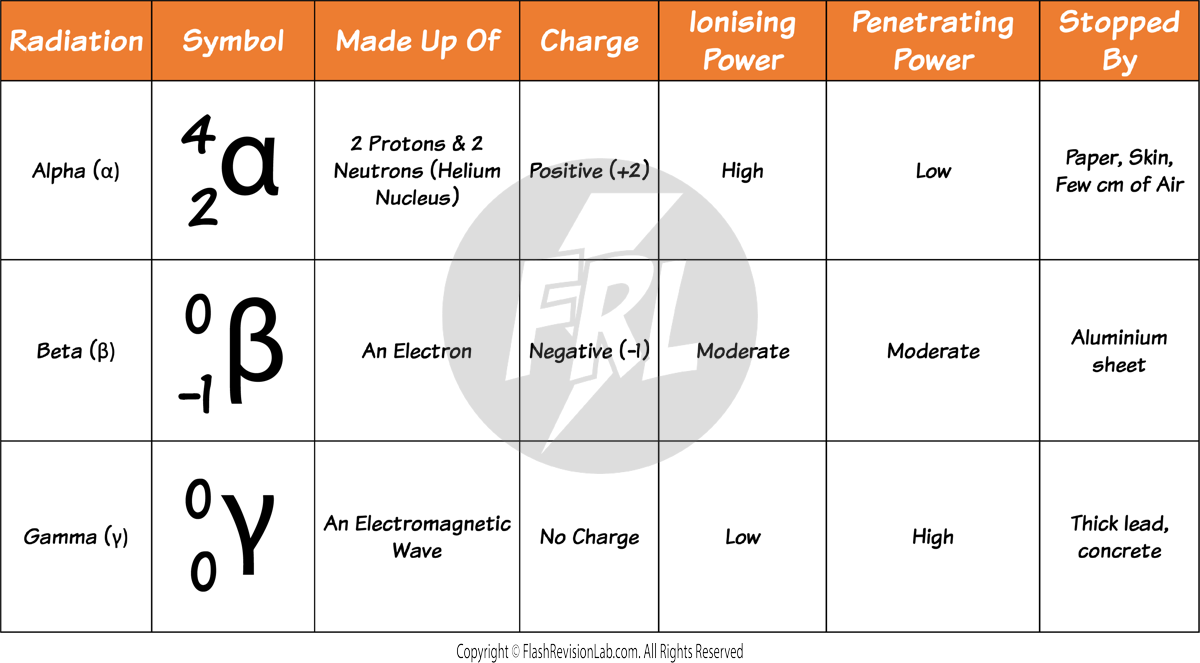
Alpha Particles (α)
- ALPHA PARTICLES are made up of two neutrons and two protons, making them identical to a helium nucleus.
- They have a LOW penetration ability and can be stopped by just a sheet of paper. This is due to their large size compared to other forms of radiation.
- They are STRONGLY IONISING because they can knock out electrons from atoms, turning them into ions quite effectively.
Beta Particles (β)
- A BETA PARTICLE is a high-speed electron ejected from a nucleus. Despite having a small mass, they carry a single negative charge.
- They are MODERATELY IONISING and have a greater penetrating power than alpha particles, traveling several metres in air and can be absorbed by materials such as aluminium about 5mm thick.
- When a beta particle is emitted, a NEUTRON in the nucleus is turned into a PROTON.
Gamma Rays (γ)
- GAMMA RAYS are a type of ELECTROMAGNETIC RADIATION with no mass and no charge, enabling them to penetrate materials much more effectively than alpha or beta particles.
- They have the LOWEST ionising power but can travel the LONGEST distances through air and materials.
- To STOP gamma rays, you need thick sheets of dense materials like lead or several metres of concrete.
Uses of Radiation
The different types of radiation have various uses due to their properties:
Alpha Radiation in Smoke Detectors:
- Alpha radiation is suitable for SMOKE DETECTORS because alpha particles have a high ionising ability, which means they can ionize air particles very effectively, creating a detectable electric current. The relatively large size of alpha particles makes them interact strongly with matter, such as smoke particles. When smoke interrupts the flow of ions, the current drops, which the detector senses and thus sets off the alarm. This sensitivity to changes in air composition is crucial for the early detection of fires.

Beta Particles in Material Thickness Measurement:
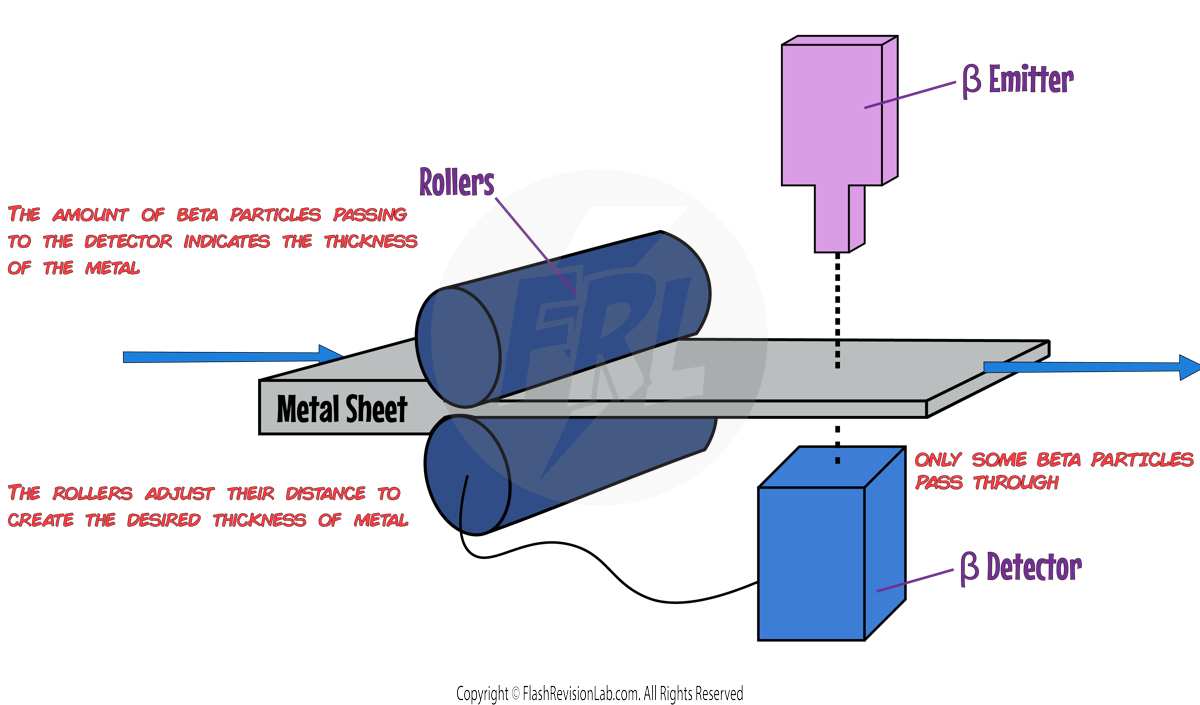
- The use of beta particles for gauging material THICKNESS is advantageous because beta particles have a moderate penetration depth and ionising power. They are absorbed at predictable rates by different materials, allowing for precise thickness measurements. Beta particles can penetrate materials enough to provide information without passing completely through, which is ideal for non-destructive testing of materials like sheets of metal.
Gamma Rays as Medical Tracers:
- Medical tracers are injected into the body, and flow through the blood where the radiation can be detected externally to follow its progress around the body.
- Gamma rays are well-suited as MEDICAL TRACERS due to their ability to penetrate tissues and exit the body without being absorbed as much as alpha or beta radiation. This allows them to be detected by external sensors after being emitted by a source inside the patient, providing valuable images. Their lower ionising power compared to alpha particles reduces the risk of damage to healthy tissues during their use in medical imaging.
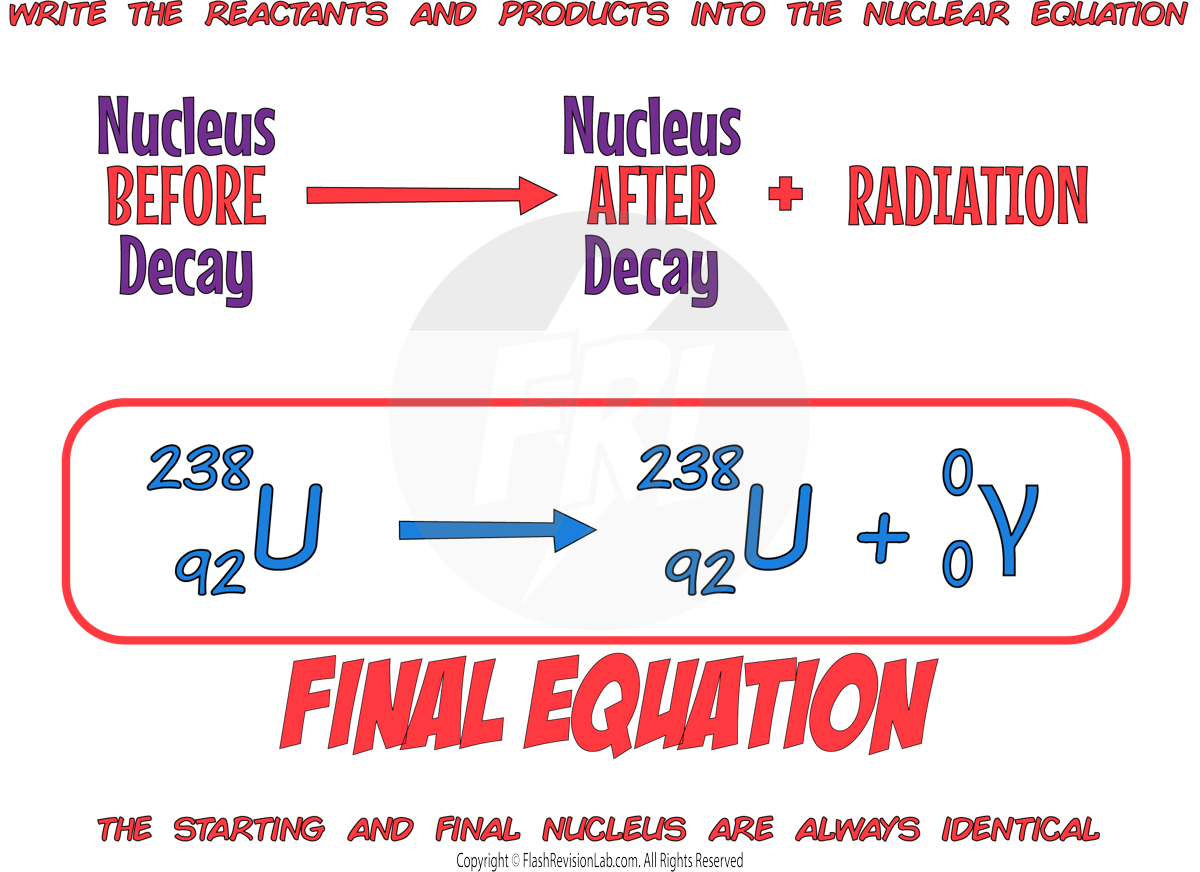
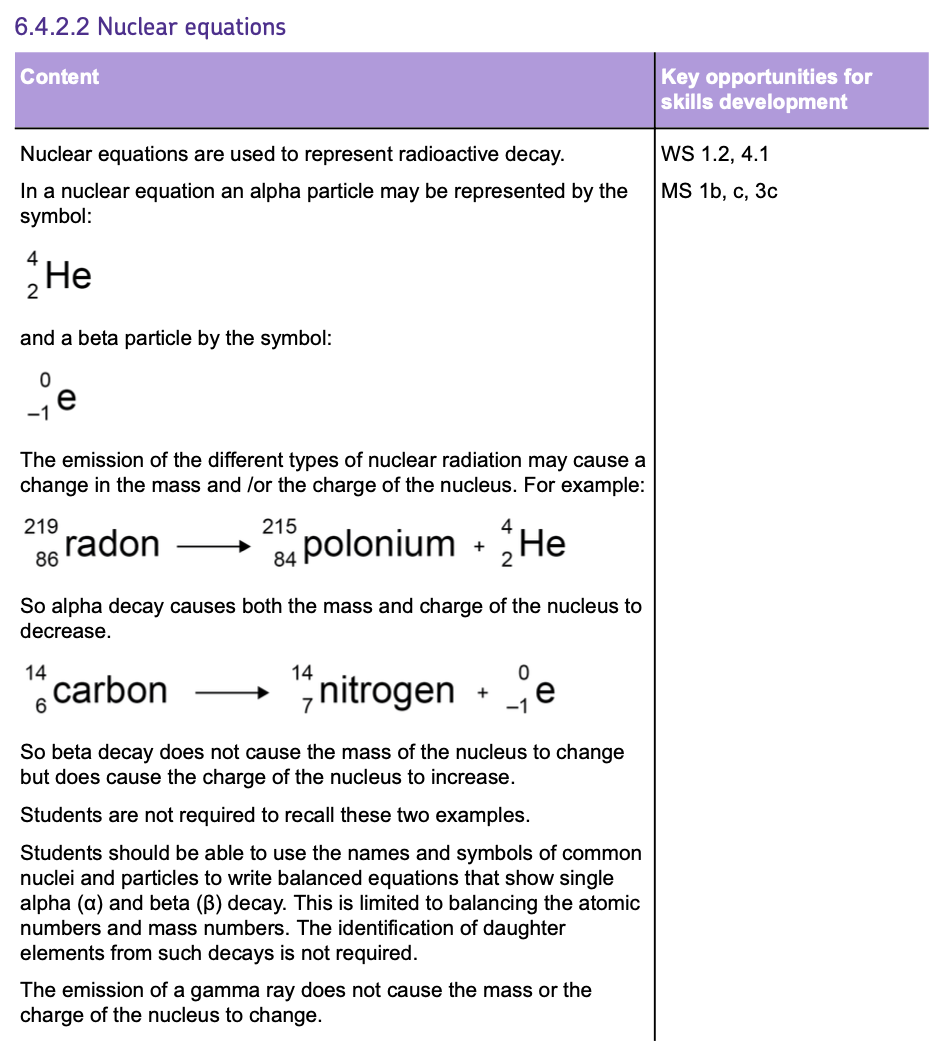
Nuclear Equations
Nuclear equations are used to represent radioactive decay by using the ELEMENT SYMBOLS.
They’re written in the following way:

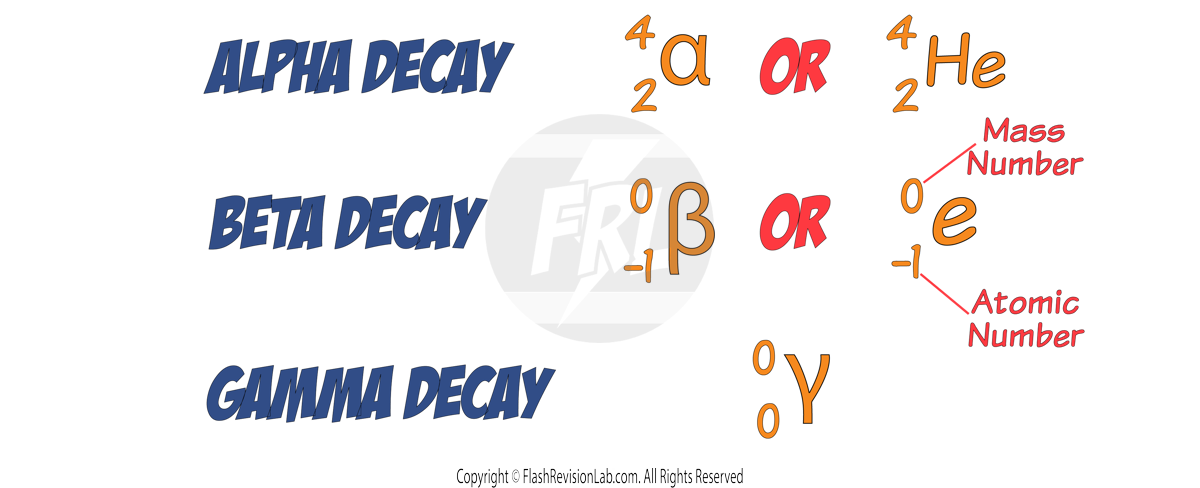
The SYMBOLS for the radiation types are written in the following way:
Let’s look at some examples:
Alpha Decay

During ALPHA decay a HELIUM NUCLEUS (2 protons and 2 neutrons) is given off.
This causes the MASS NUMBER to decrease by 4 and the ATOMIC NUMBER to decrease by 2.
This means the CHARGE of the nucleus decreases by 2.
During alpha decay, the number of PROTONS in a nucleus changes, so the ELEMENT changes.
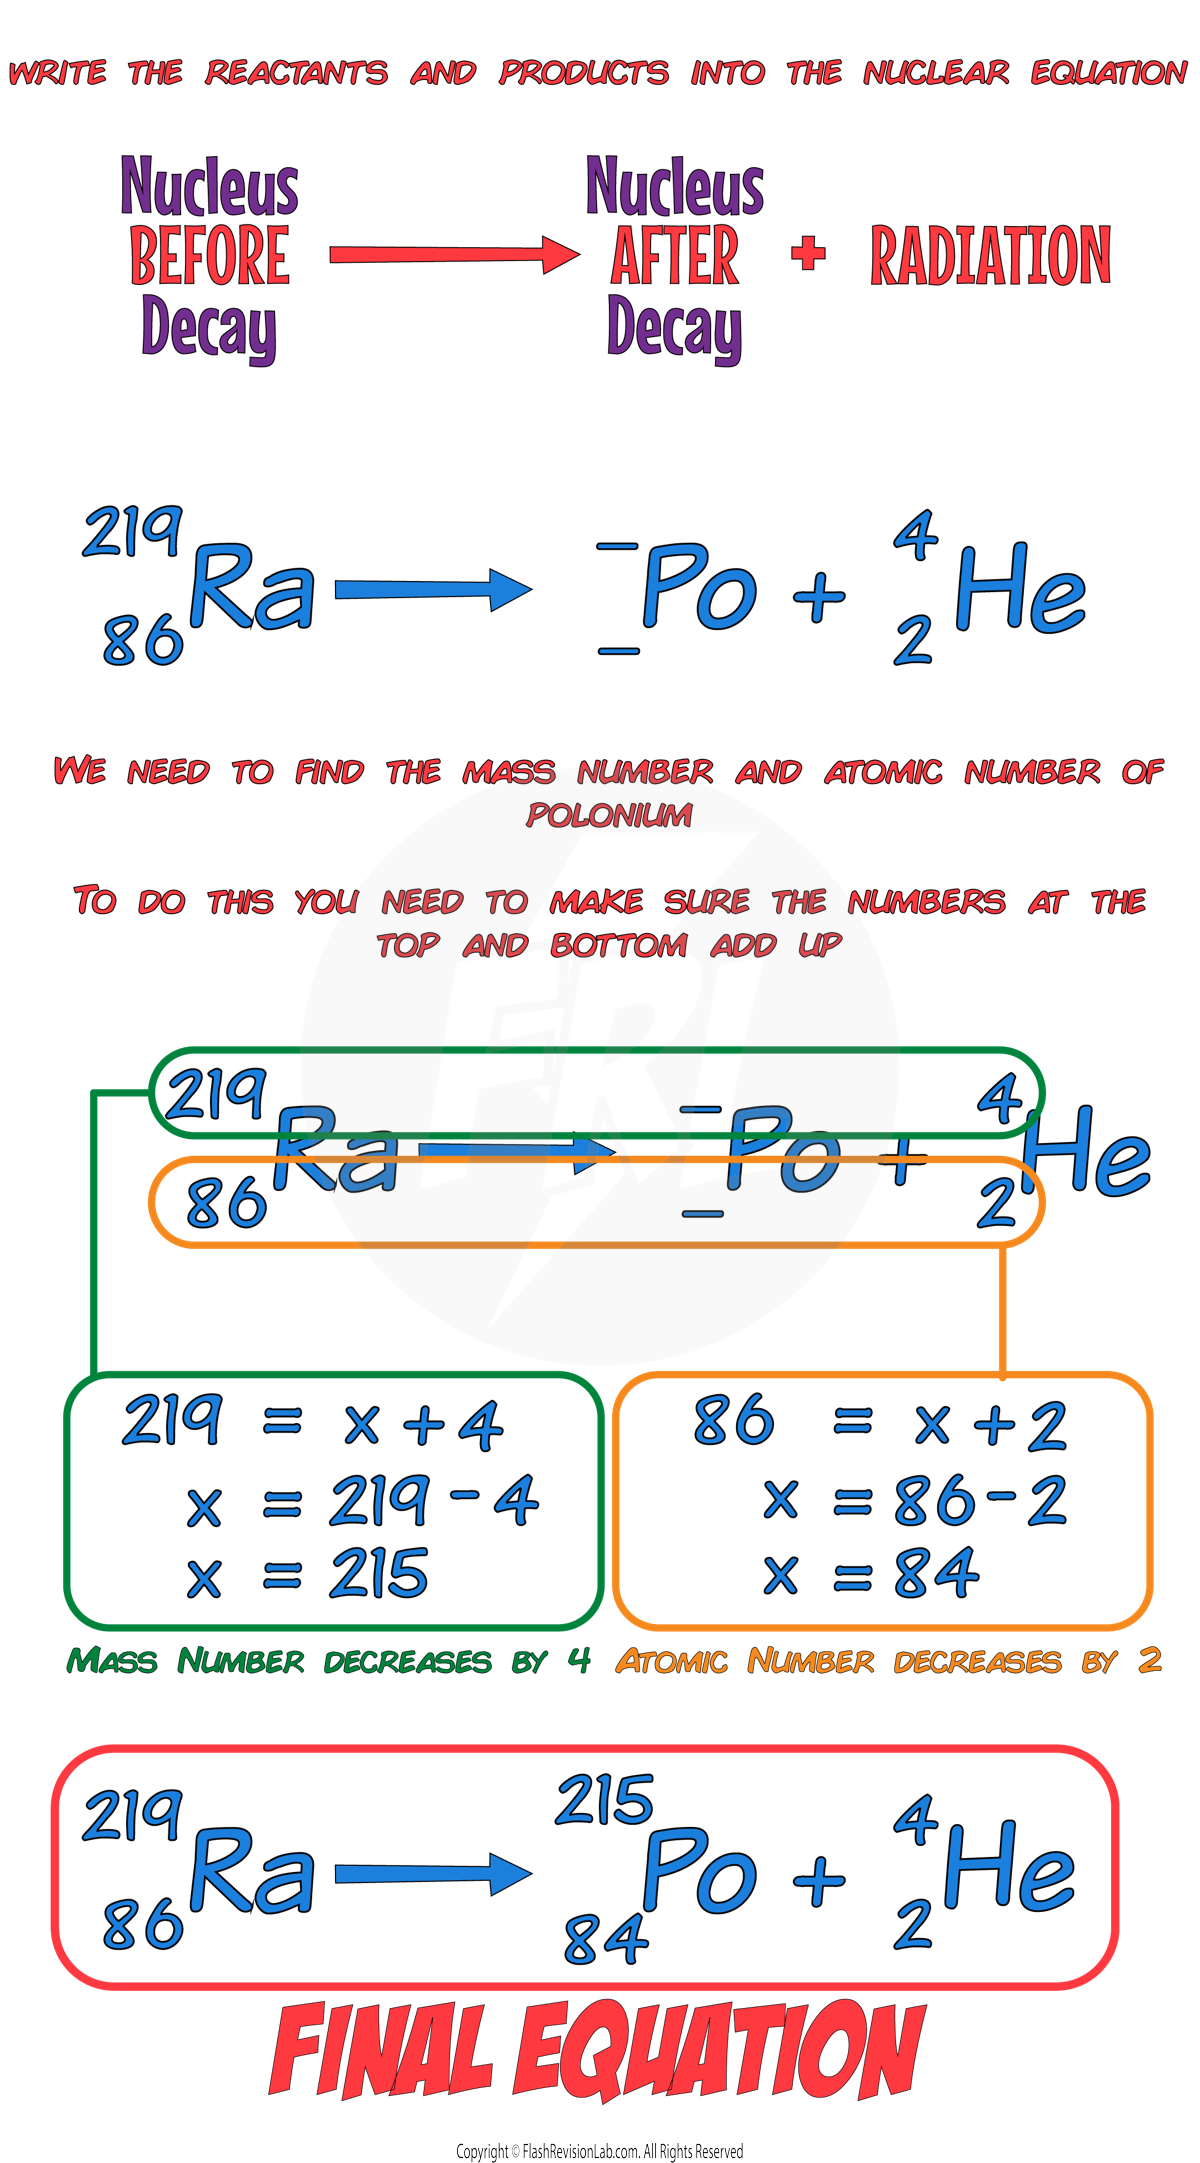
E.g. Let’s say we have a Radon-219 nucleus undergoing ALPHA DECAY to form a polonium nucleus:
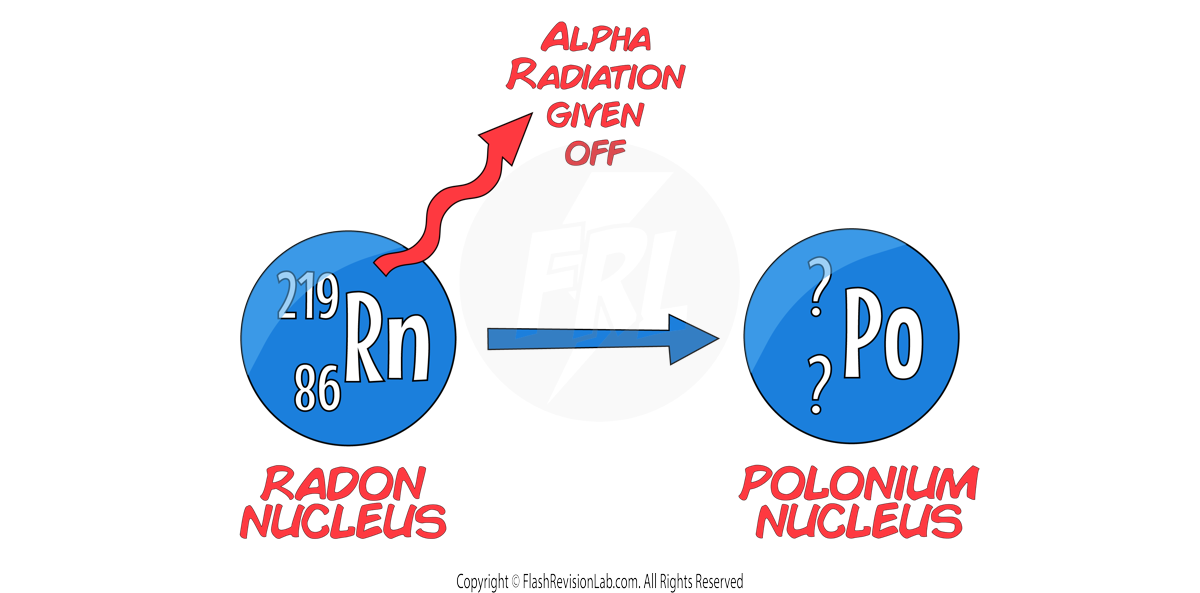
In this example, we know the mass number (219) and atomic number (86) of RADON, but we need to work out the mass and atomic number of POLONIUM:
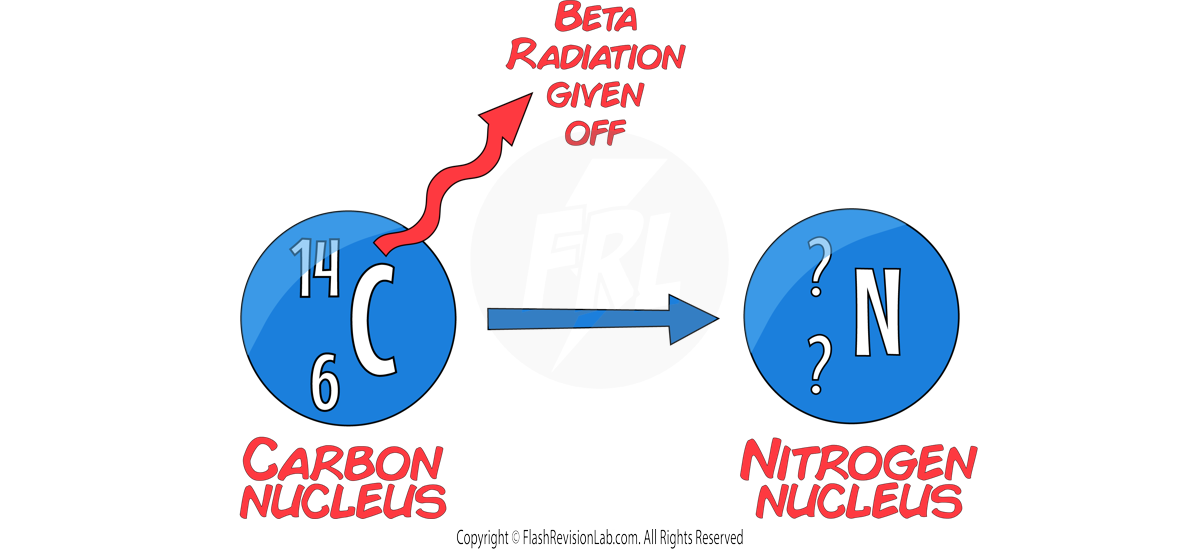
Beta Decay

For BETA decay, an ELECTRON is given off and a NEUTRON is turned into a PROTON.
This causes the MASS NUMBER to STAY THE SAME, and the ATOMIC NUMBER to increase by 1.
This means the CHARGE of the nucleus INCREASES by 1.
During beta decay, the number of PROTONS in a nucleus changes, so the ELEMENT changes.
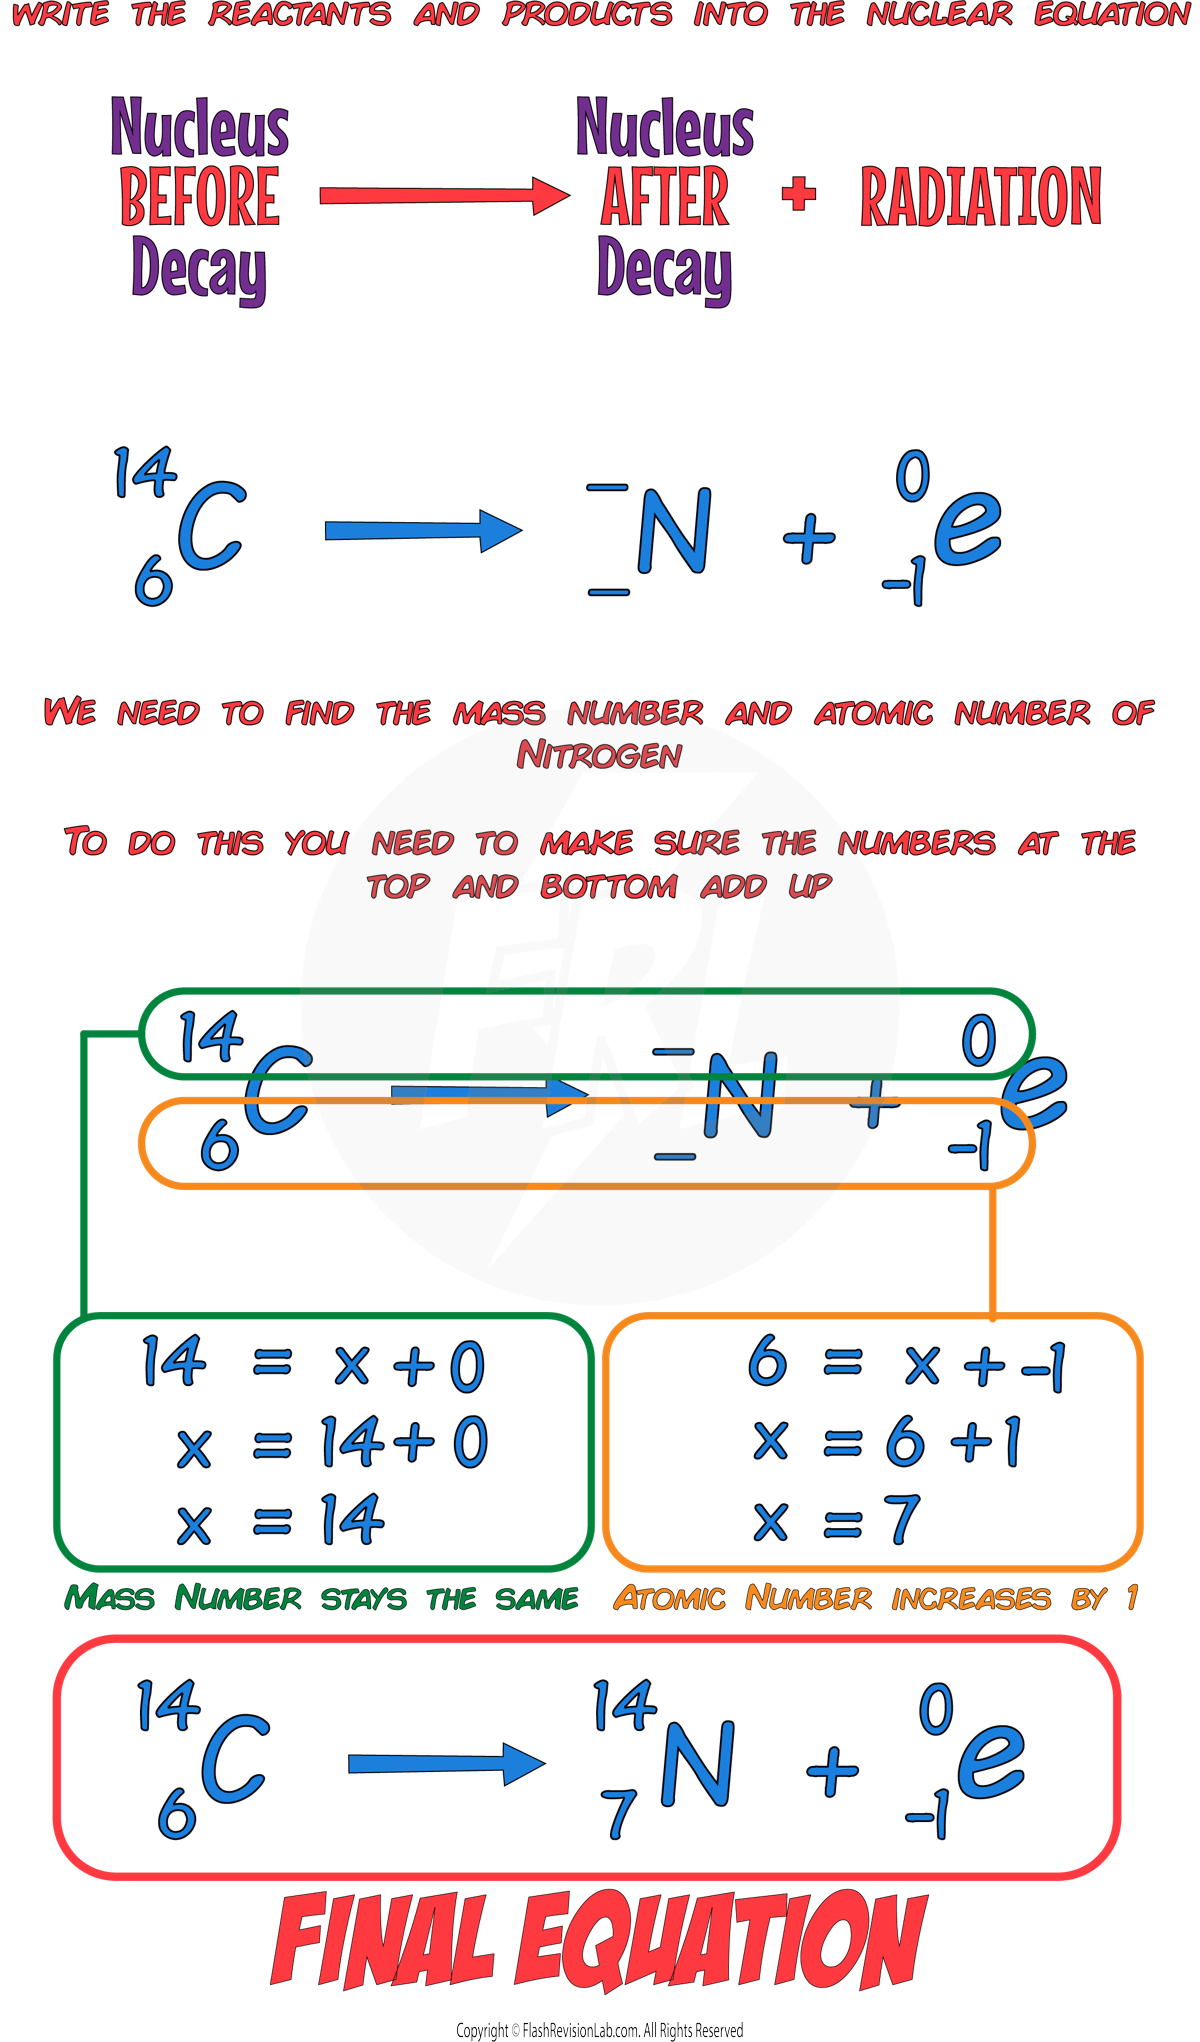
E.g. A carbon-14 nucleus undergoing beta decay to form nitrogen.
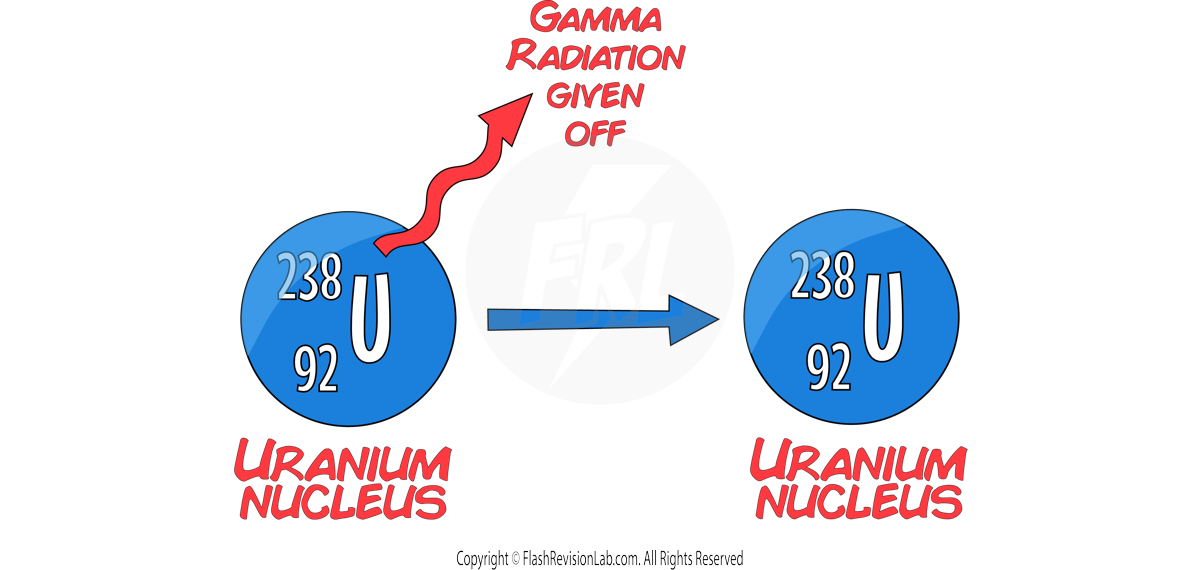
Gamma Decay

GAMMA decay only gives off an ELECTROMAGNETIC WAVE with ENERGY but NO MASS (neutrons or protons).
This causes the MASS and ATOMIC number to STAY THE SAME.
The CHARGE of the nucleus also STAYS THE SAME.
As the number of protons does NOT change, the ELEMENT STAYS THE SAME during gamma decay.
E.g. A uranium-238 nucleus emitting GAMMA radation.
Half Lives
Random Nature of Radioactivity
Radioactive decay involves an UNSTABLE NUCLEUS giving off RADIATION in order to become STABLE.
This process is described as RANDOM. This is because it’s IMPOSSIBLE to predict WHEN a nucleus will DECAY and WHICH nucleus in a sample will decay next.
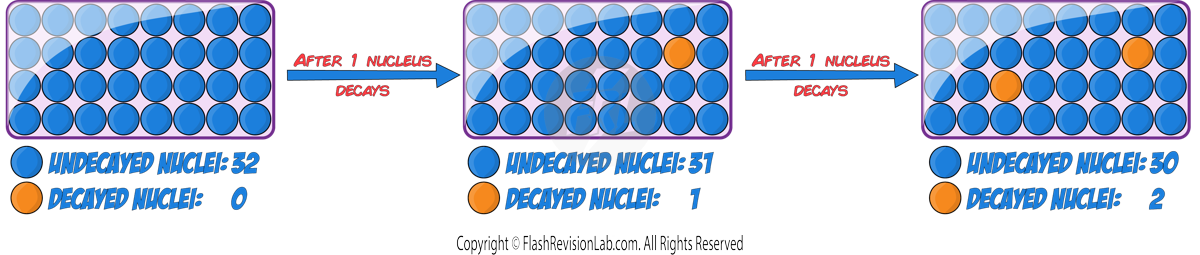
If we looked at an example of 32 nuclei of a RADIOACTIVE ISOTOPE, it is impossible to predict WHICH of the 32 nuclei would decay next. It is also impossible to predict WHEN a nucleus will decay next.
Every time a decay occurs a random nucleus in the isotope gives off RADIATION and becomes STABLE. This usually changes the isotope to another element.
The number of UNDECAYED nuclei DECREASES over time and the number of DECAYED nuclei INCREASES over time.
This occurs until ALL nuclei DECAY and become STABLE.
Dice Analogy

A good way to model the RANDOM NATURE of radioactive decay is by using DICE as the isotope's NUCLEI.
If every time you roll a '6' counted as a NUCLEUS DECAYING, you could say that there is a 1 in 6 chance of the nucleus decaying.
If you rolled 100 dice, you still would not be able to predict WHICH dice would roll a '6' or WHEN a dice would roll a '6'.
Half Life
The activity of a radioactive sample always DECREASES over time. This is because it becomes LESS likely for a decay to occur as there are FEWER UNDECAYED nuclei after every DECAY.
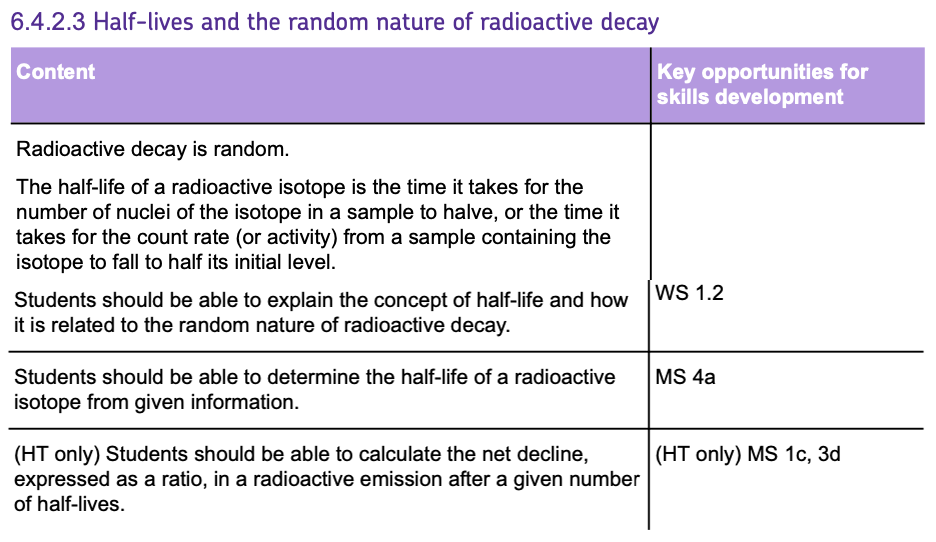
The TIME it takes the ACTIVITY or the NUMBER of UNDECAYED NUCLEI to decrease to HALF of the ORIGINAL value is known as the HALF LIFE.
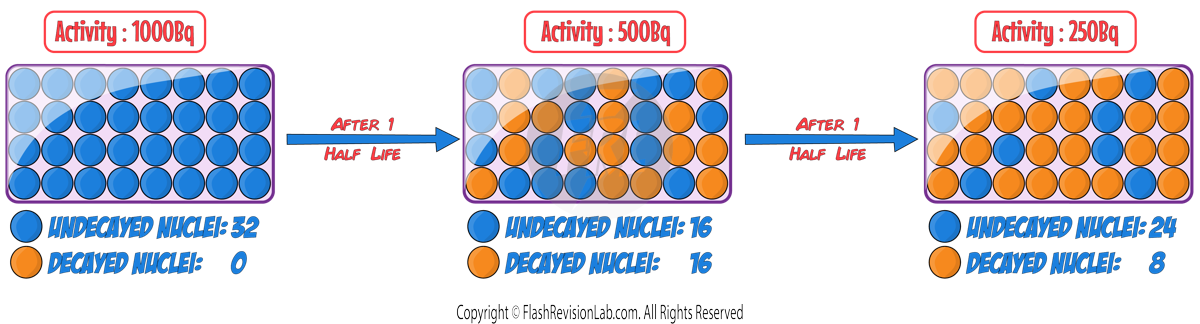
The half-life of a radioactive isotope can be DEFINED in TWO ways:
1. The time it takes for the number of UNDECAYED NUCLEI of an isotope in a sample to HALVE.
2. The time it takes for the COUNT RATE (or ACTIVITY) from a sample containing the isotope to fall to HALF its initial level.
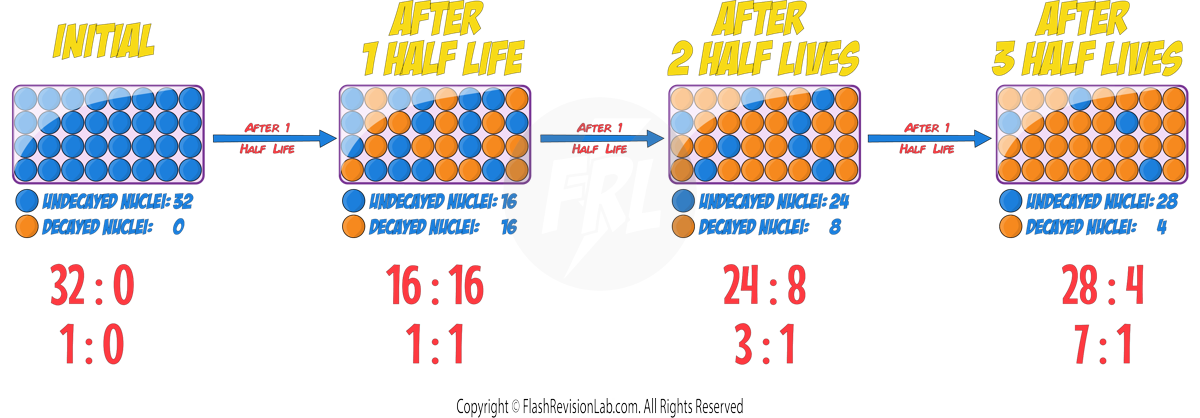
You can also express the nuclei as a RATIO of UNDECAYED to DECAYED nuclei:
Half Life in Graphs
The ACTIVITY, COUNT-RATE or NUMBER OF UNDECAYED NUCLEI can all be represented on a graph as a DECREASING curve.
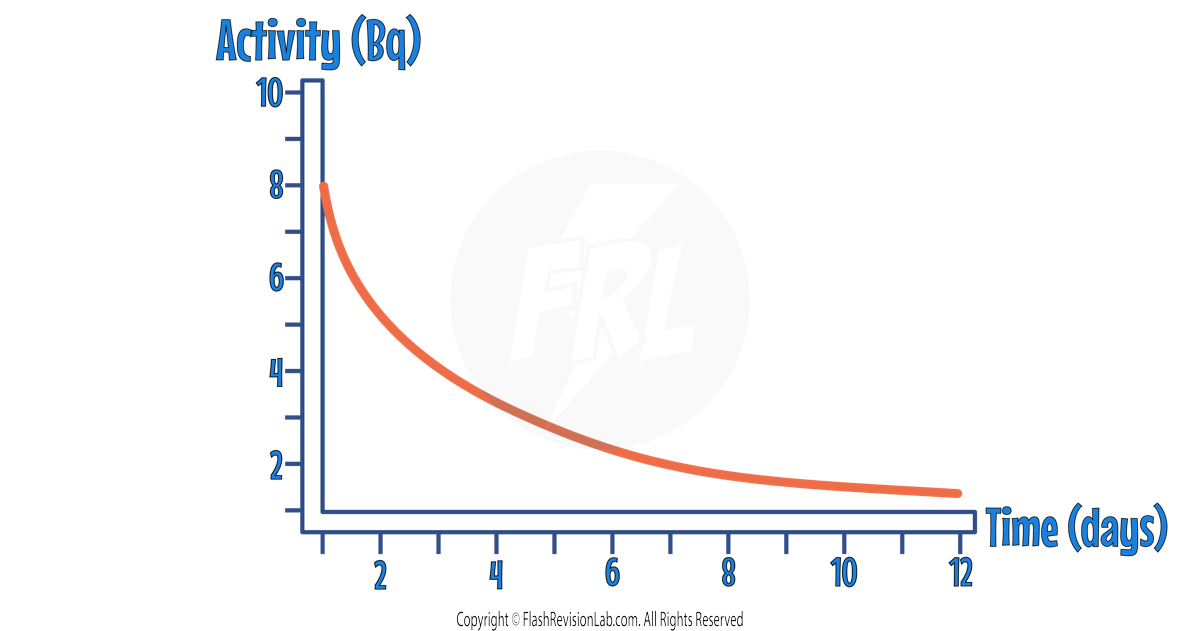
The half life of the sample can be found by finding the time taken for the INITIAL VALUE to halve.
To do this, find the INITIAL VALUE on the y-axis and HALVE it.
Then draw a HORIZONTAL LINE from the half value to the curve, and draw a VERTICAL LINE from the curve to the x-axis.
The time you find on the x-axis is the HALF LIFE.
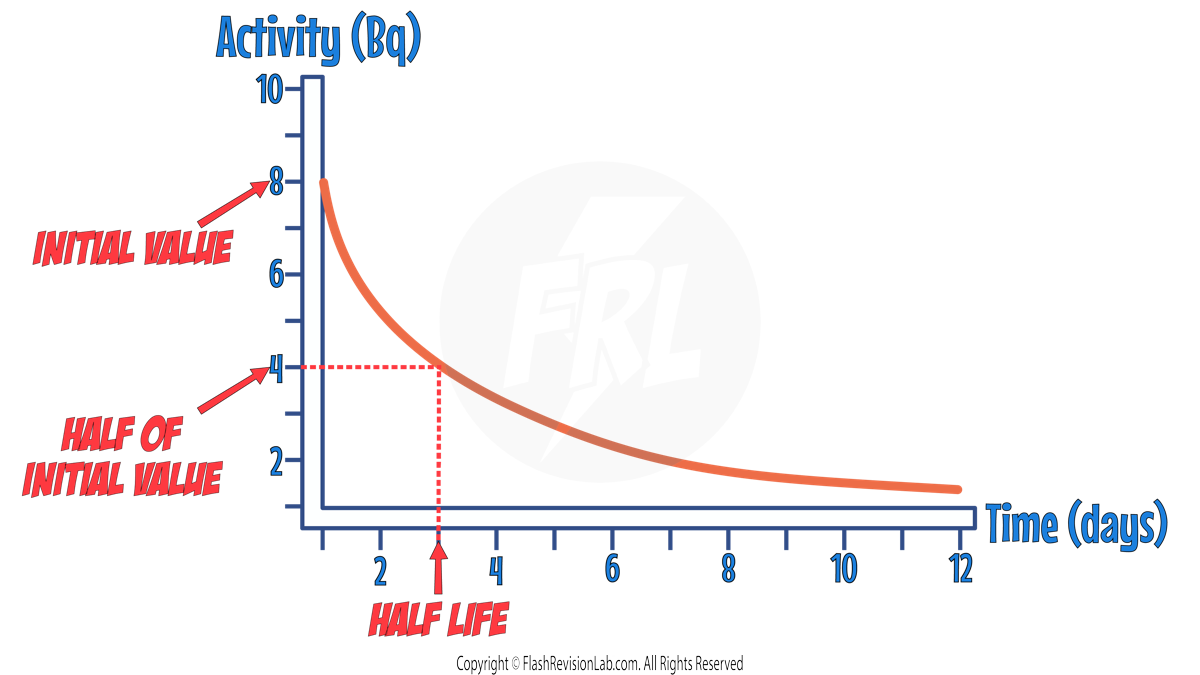
In the above example , the half life is 3 DAYS.
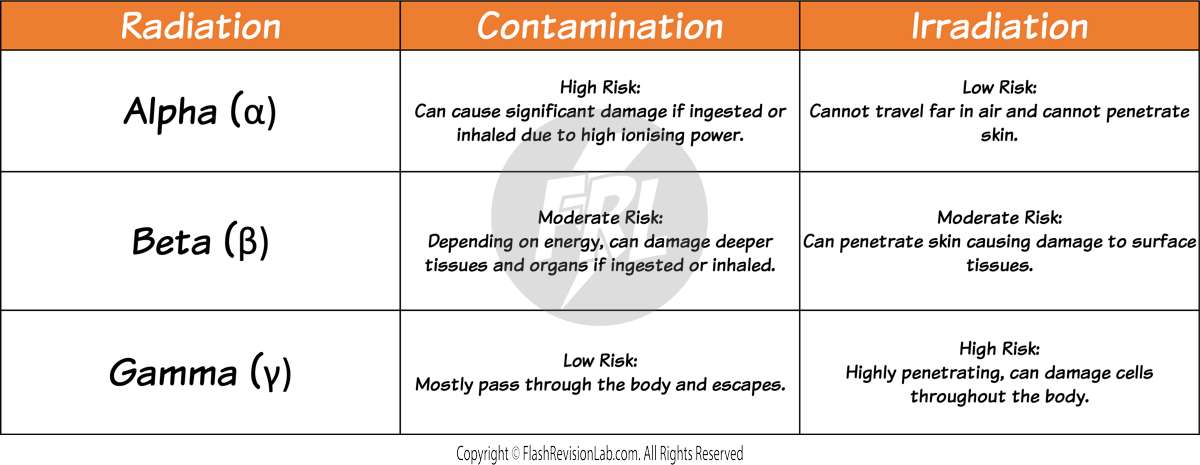
Radioactive Contamination and Irradiation
- The radiation released from RADIOACTIVE DECAY is IONISING which means it can knock off electrons from atoms.
- If the atom is part of a LIVING CELL, it has the potential to cause it harm by damaging it.
- The IONISING RADIATION can lead to CELL DAMAGE or MUTATION, which can result in CANCER.
There are TWO ways that living cells can be exposed to IONISING RADIATION:
1. Contamination
CONTAMINATION occurs when radioactive particles come into DIRECT CONTACT with materials or living tissue.
It makes the object RADIOACTIVE if it isn’t decontaminated.
This can occur by:
- TOUCHING a radioactive isotope and atoms depositing on the skin.
- INHALING a radioactive gas into the lungs.
- INGESTING radioactive atoms.
Once the radioactive atoms have come into contact with the living tissue, they can decay, and the radiation can damage the living cells.
You can reduce exposure due to CONTAMINATION by:

- Using SAFETY GEAR such as gloves and tongs to handle radioactive materials.
- Wearing PROTECTIVE SUITS to avoid inhaling or ingesting radioactive particles.
2. Irradiation
- IRRADIATION occurs when an object or person is EXPOSED to RADIATION, but the object does NOT become radioactive.
- This occurs when the person or object is NEAR a RADIOACTIVE ISOTOPE and the radiation given off reaches them.
You can reduce exposure due to IRRADIATION by:
- Standing behind BARRIERS (shielding) when using radioactive sources.
- Keeping radioactive sources in LEAD-LINED BOXES.
- Using REMOTE-CONTROLLED ARMS in DIFFERENT ROOMS to handle the source.
Risks Inside and Outside the Body
- The HAZARD from contamination and irradiation is influenced by the TYPE of radiation emitted from the decaying atoms.
- Different types of radiation pose different levels of risk based on their IONISING and PENETRATION power.
- It is important that the findings on the effects of radiation on humans are PUBLISHED and PEER REVIEWED by other scientists.
- This ensures that scientific research is ACCURATE and RELIABLE before it is widely accepted.
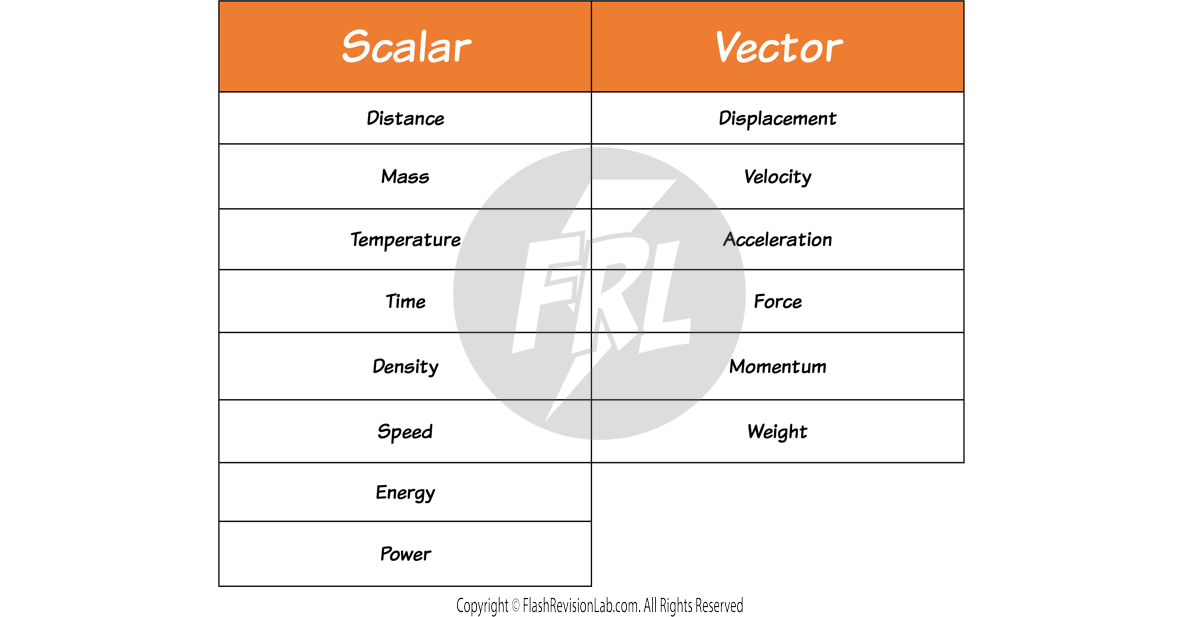
Scalars and Vectors
All measurable quantities can be divided into TWO groups:
1. Scalars
These are quantities with MAGNITUDE but NO DIRECTION.
E.g. Temperature is a SCALAR quantity that has NO direction. You can only measure the MAGNITUDE.
2. Vectors
These are quantities with both MAGNITUDE AND DIRECTION.
e.g. FORCE is a VECTOR quantity as when you describe a force, you describe it with both a MAGNITUDE (the amount of Newtons) and a DIRECTION.
Here are some more examples of SCALARS and VECTORS:
Representing Vectors
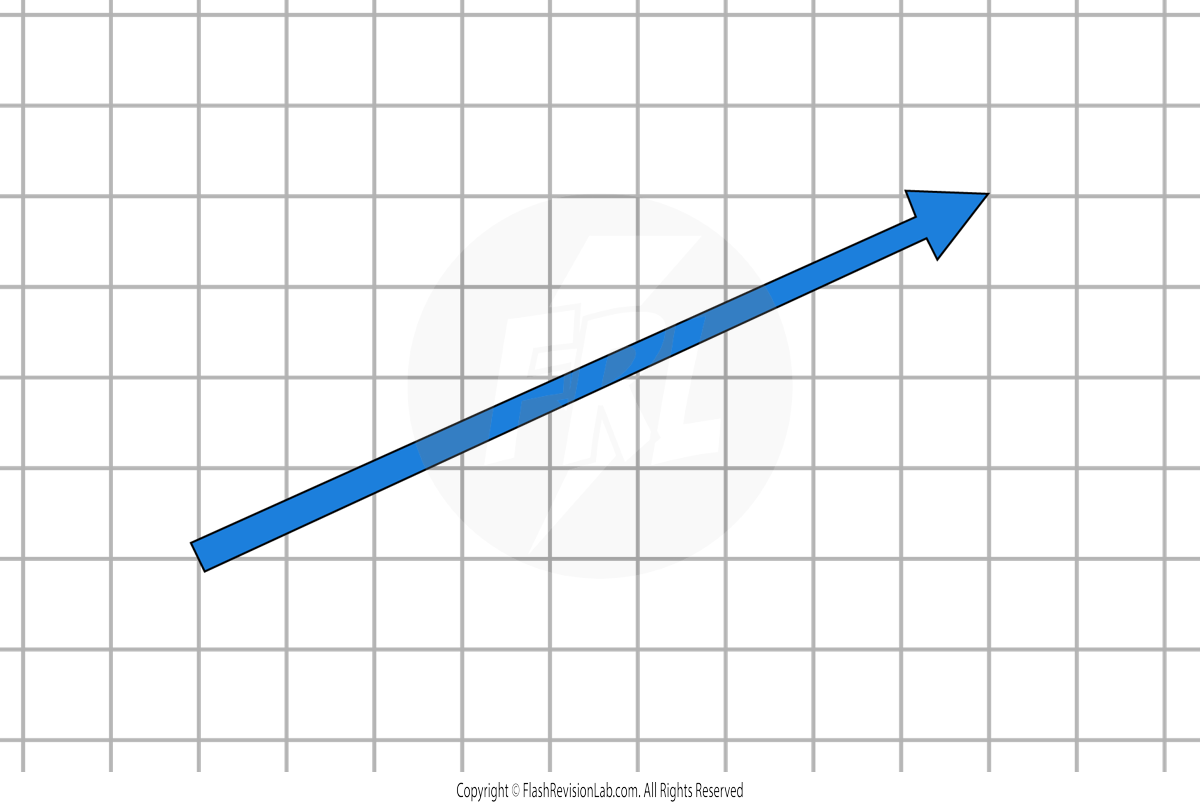
A vector can be represented with an ARROW.
The LENGTH of the arrow represents the MAGNITUDE of the vector.
The DIRECTION of the arrow represents the DIRECTION of the vector.
e.g. Let's look at a ball with a velocity of 35m/s travelling at a direction of 45° to the horizontal.
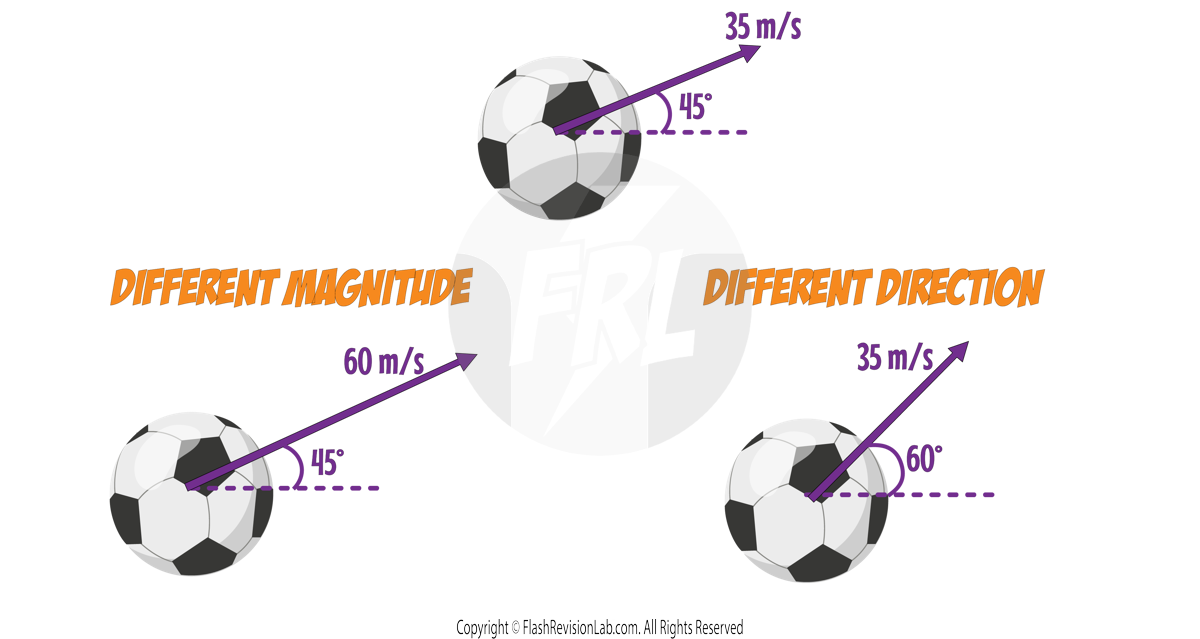
If you increase the MAGNITUDE of the velocity to 60m/s, the LENGTH of the arrow will get LONGER.
If you change the DIRECTION of the velocity to 60° to the horizontal, the DIRECTION of the arrow will change and point in that direction.
Contact and Non-Contact Forces
A FORCE is a push or pull upon an object resulting from its interaction with another object.
There are TWO main types of forces based on whether the objects are in physical contact or not.
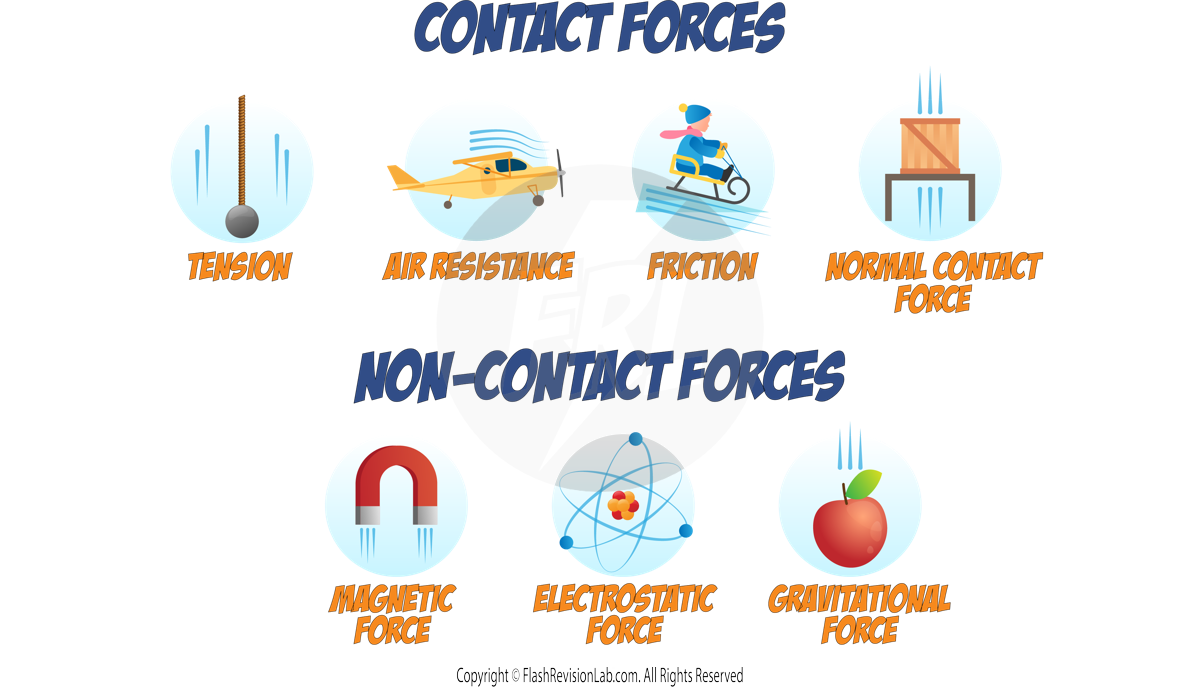
Contact Forces
CONTACT FORCES occur when objects must touch each other. Examples include:
- FRICTION: the force that RESISTS motion when the surface of one object comes in CONTACT with the surface of another.
- AIR RESISTANCE: The force exerted on a moving object when it moves through the AIR.
- TENSION IN ROPES: The force transmitted through a STRING, rope, cable, or wire when it is pulled tight by forces acting from opposite ends.
- NORMAL CONTACT FORCE: The support force exerted upon an object that is IN CONTACT with another stable object.
Non-Contact Forces
NON-CONTACT FORCES can act at a distance without physical contact. They include:
- MAGNETIC FORCE: The attraction or repulsion between MAGNETS.
- GRAVITATIONAL FORCE: The force of attraction between all MASSES in the universe.
- ELECTROSTATIC FORCE: The force between CHARGED particles or objects.
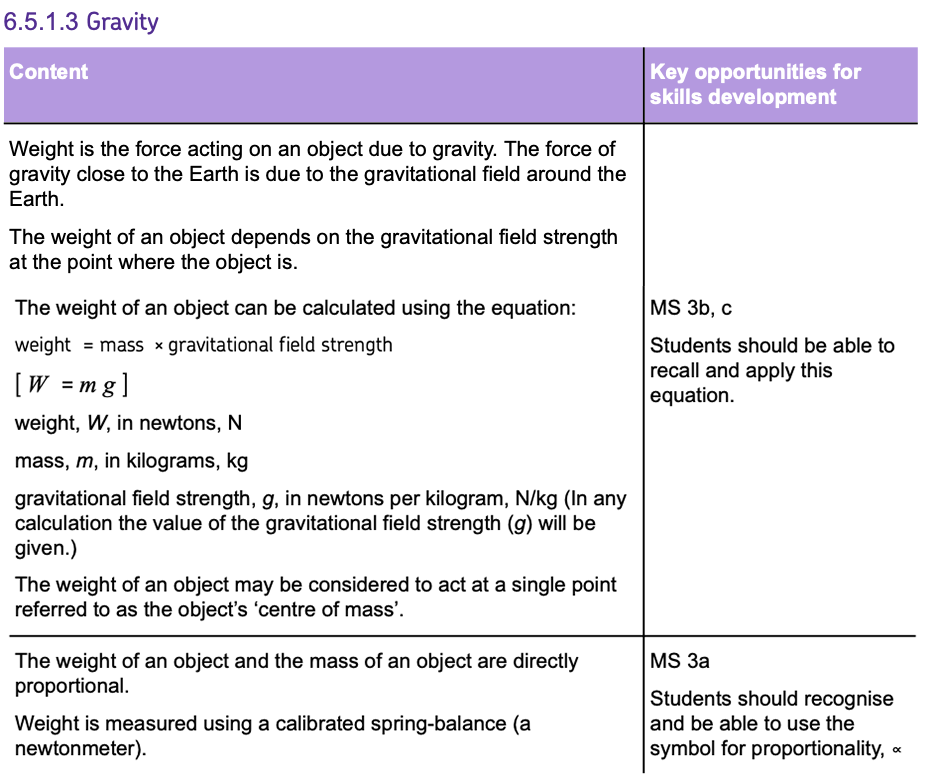
Gravity and Weight
Mass vs Weight
- MASS is the amount of MATTER in an object.
- WEIGHT is the force due to GRAVITY that is acting on an object with MASS.
- WEIGHT is different from mass as it is dependent on the GRAVITATIONAL FIELD STRENGTH that the Earth (or a planet) exerts on the object.
- Weight is commonly measured with a CALIBRATED SPRING-BALANCE (also known as a Newton meter).

Gravitational Field Strength
- The WEIGHT of an object is influenced by the GRAVITATIONAL FIELD STRENGTH where the object is located.
- This strength varies depending on the planet the object is on and the distance it is from the centre of the planet.
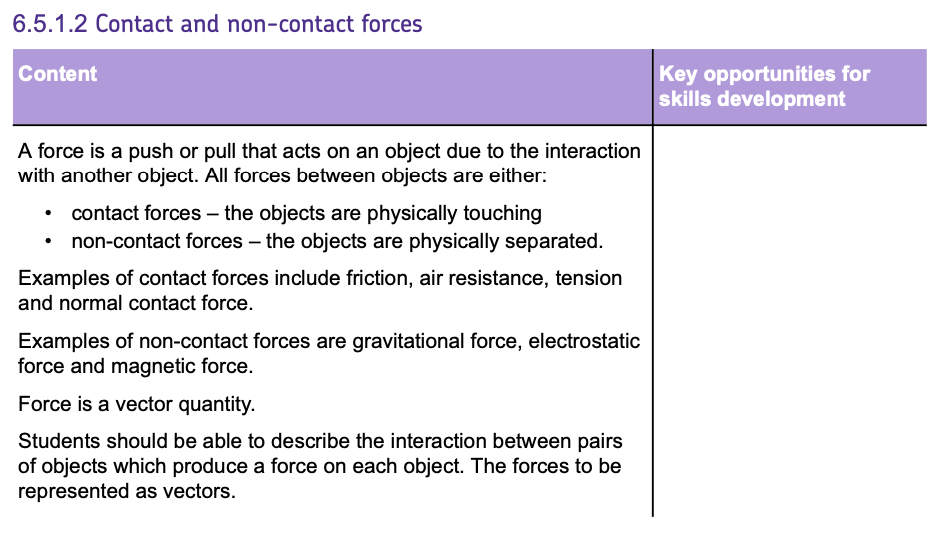
- The GRAVITATIONAL FIELD STRENGTH on Earth is 9.8 N/kg.
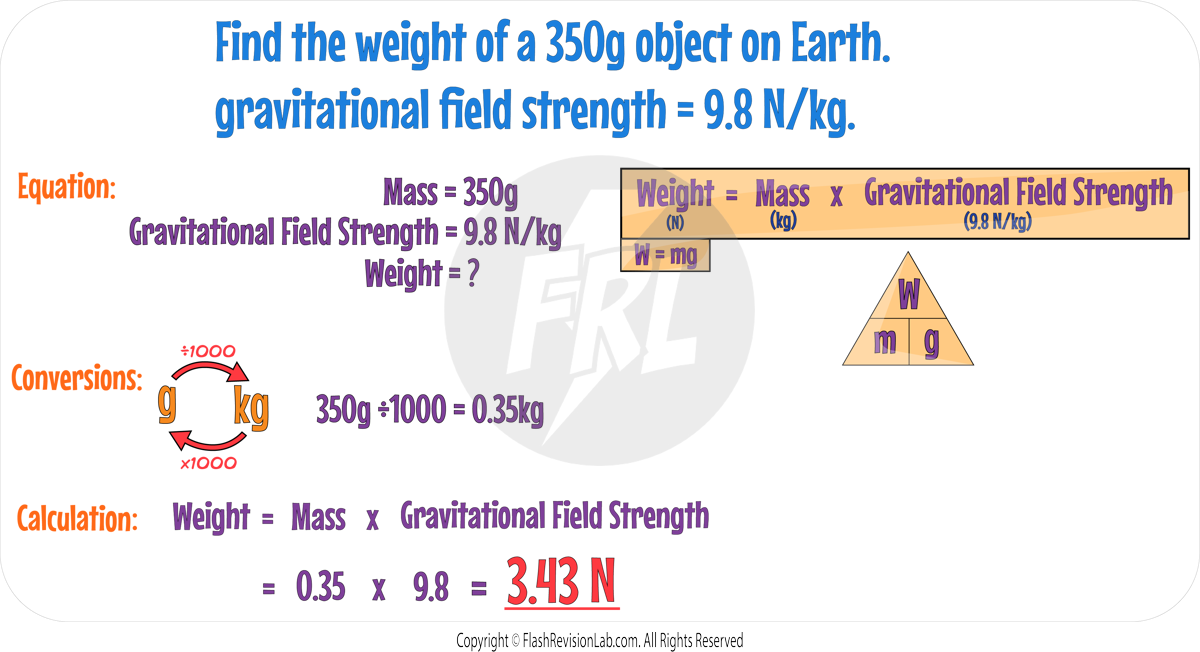
Calculating Weight
- To calculate the weight of an object, use the equation:
where:
- W is weight measured in Newtons (N).
- m is mass in Kilograms (kg).
- g is gravitational field strength in Newtons per kilogram (N/kg).
The gravitational field strength (g) will be given in any calculation required.
This equation shows that WEIGHT is DIRECTLY PROPORTIONAL to the MASS of an object.
This means if you DOUBLE the mass of an object, its weight also DOUBLES, provided that the gravitational field strength remains constant.
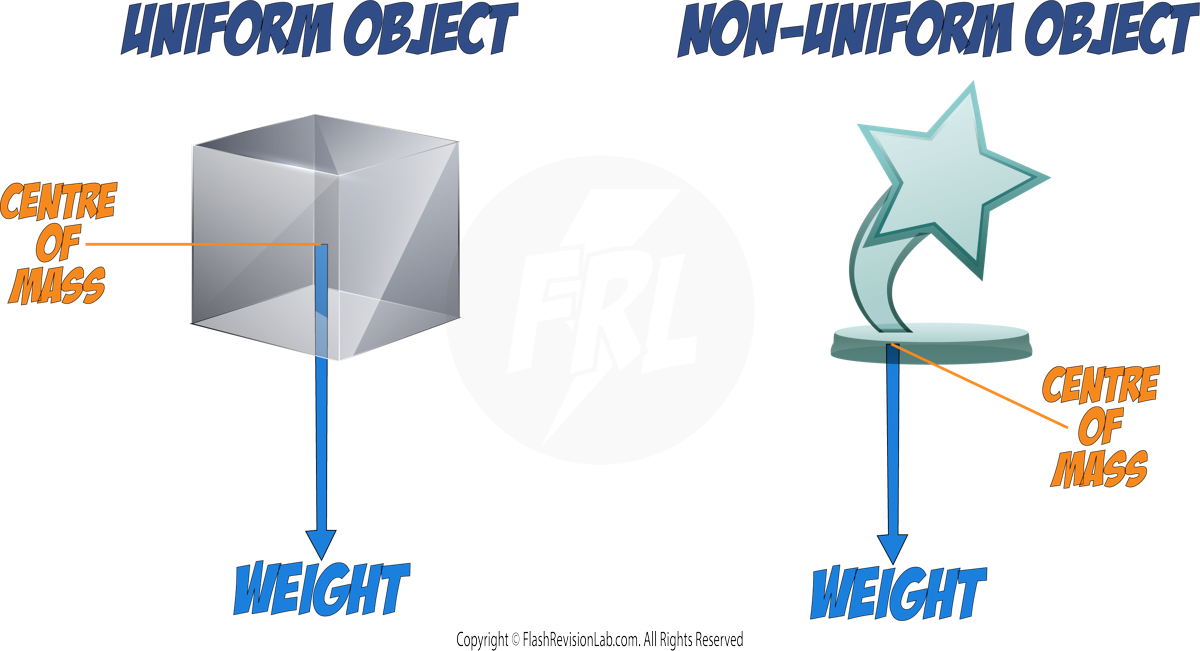
Centre of Mass
- The weight of an object acts through a single point known as the CENTRE OF MASS.
- For a UNIFORM and SYMMETRICAL object, this is at the CENTRE of the object, but its position can change based on the object.
- When representing WEIGHT on force diagrams, the arrow needs to start at the CENTRE OF MASS of the object.
Resultant Forces and Free Body Diagrams
Free Body Diagrams
FREE BODY DIAGRAMS help visualise all the forces acting upon a single object or system. These diagrams simplify complex situations by showing the magnitude and direction of forces.
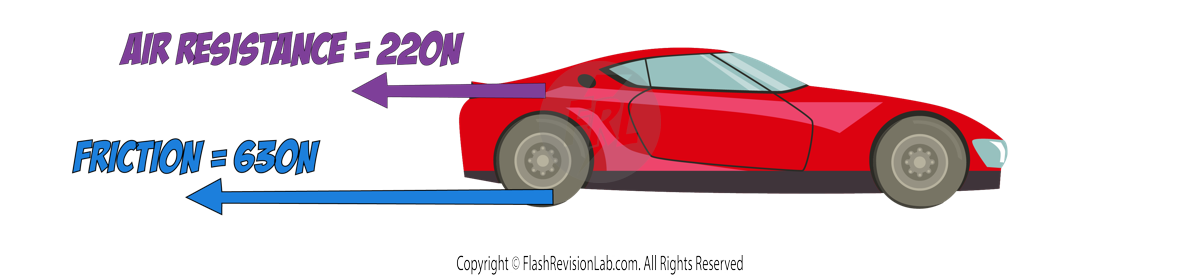
Resultant force
The RESULTANT FORCE is the OVERALL FORCE resulting from the combination of all forces acting on an object.
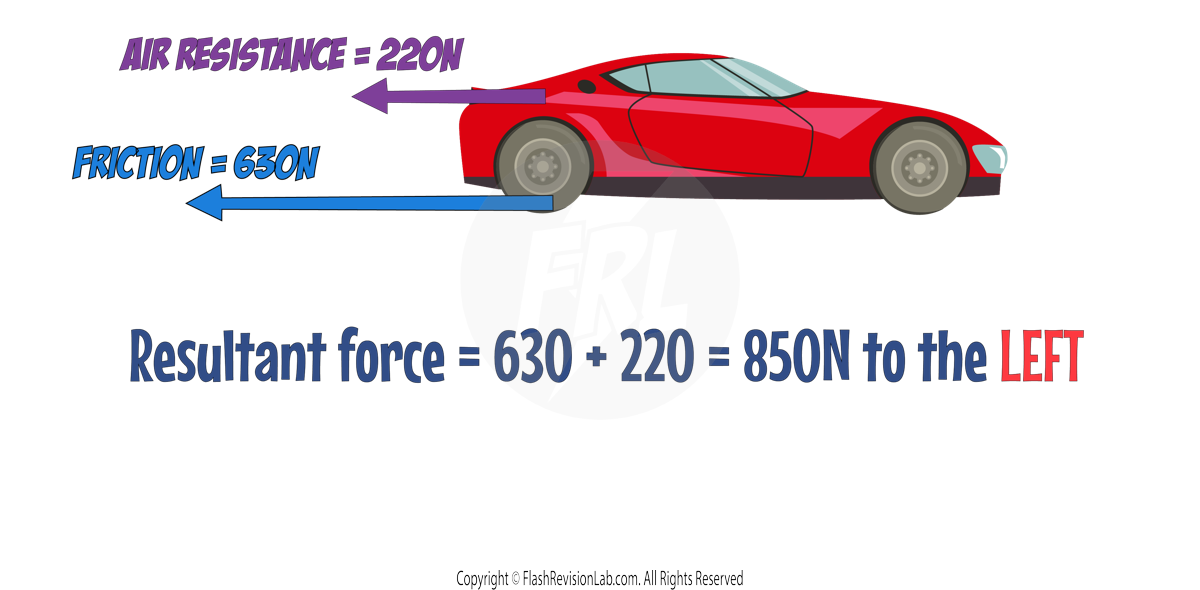
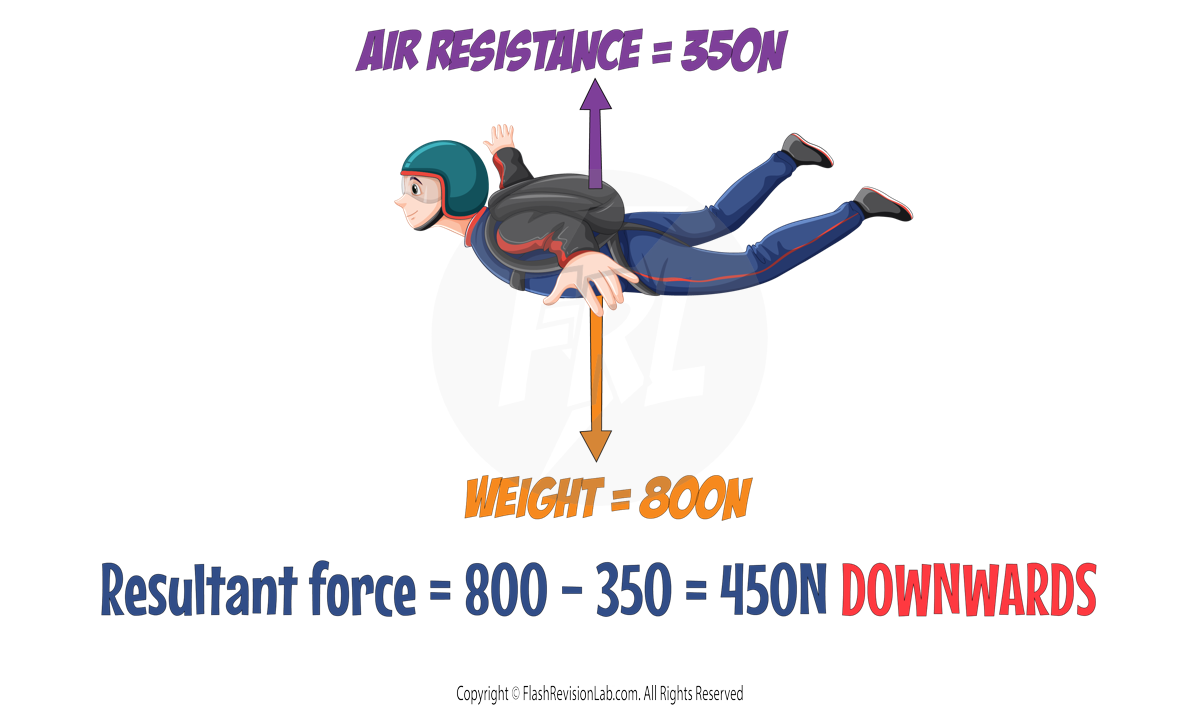
To find the RESULTANT FORCE when multiple forces act along the same line:
- ADD the forces moving in the SAME direction
- SUBTRACT those in the OPPOSITE direction.
Scale Drawings
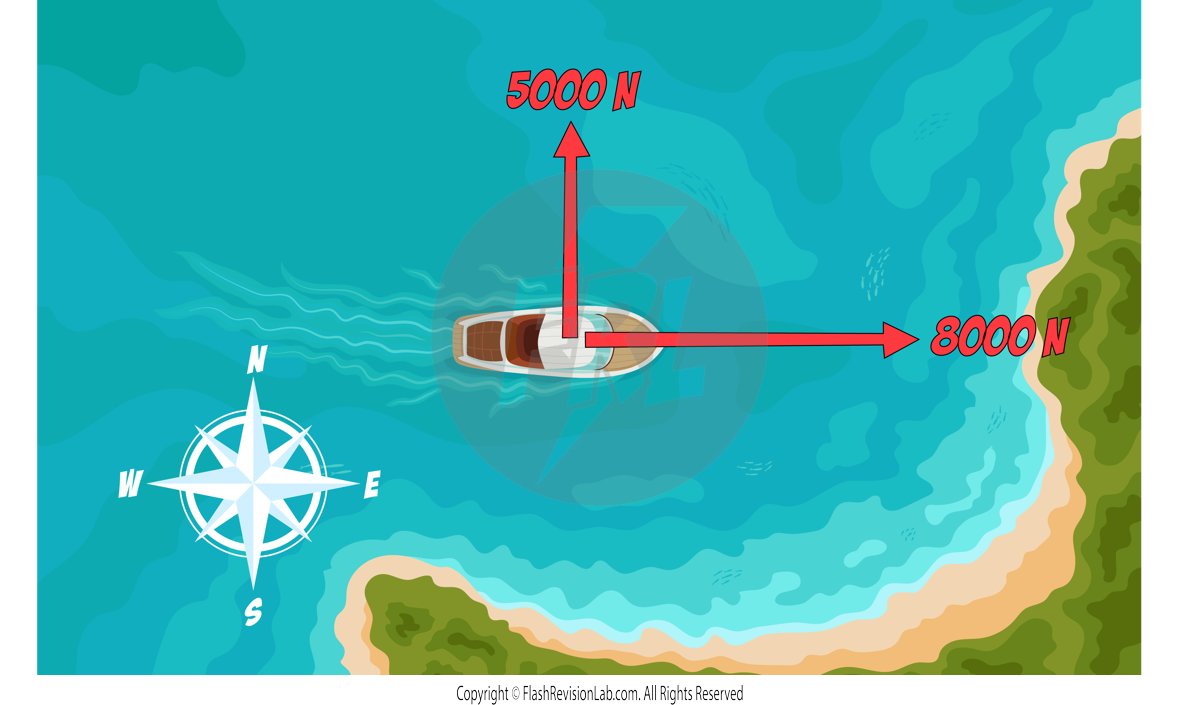
To find the resultant of forces NOT on the same line, you can use SCALE DRAWINGS:
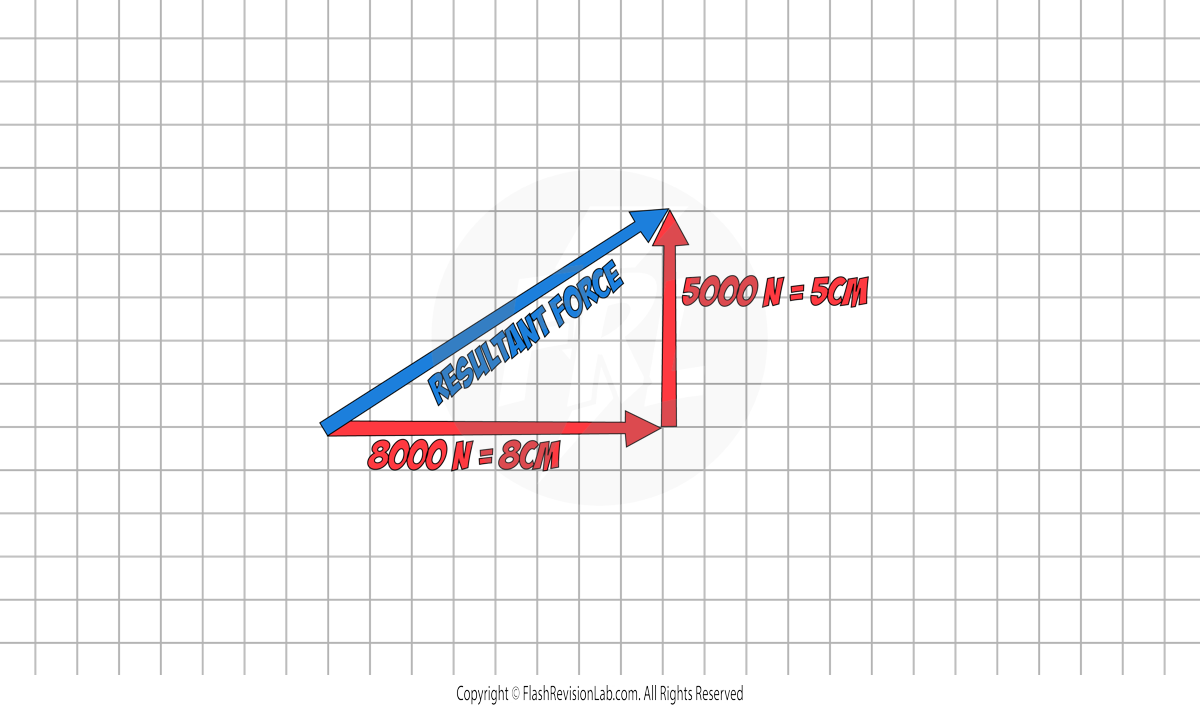
E.g. A boat has two forces acting on it. There is a force of 8000N east and another force of 5000N north. Use a vector diagram to determine the magnitude and direction of the resultant force.
Step 1: Draw the force on a square grid from ‘TIP TO TOE’. (The grid will be provided in the question). Use a sensible scale. Eg. 1000N represents 1cm.
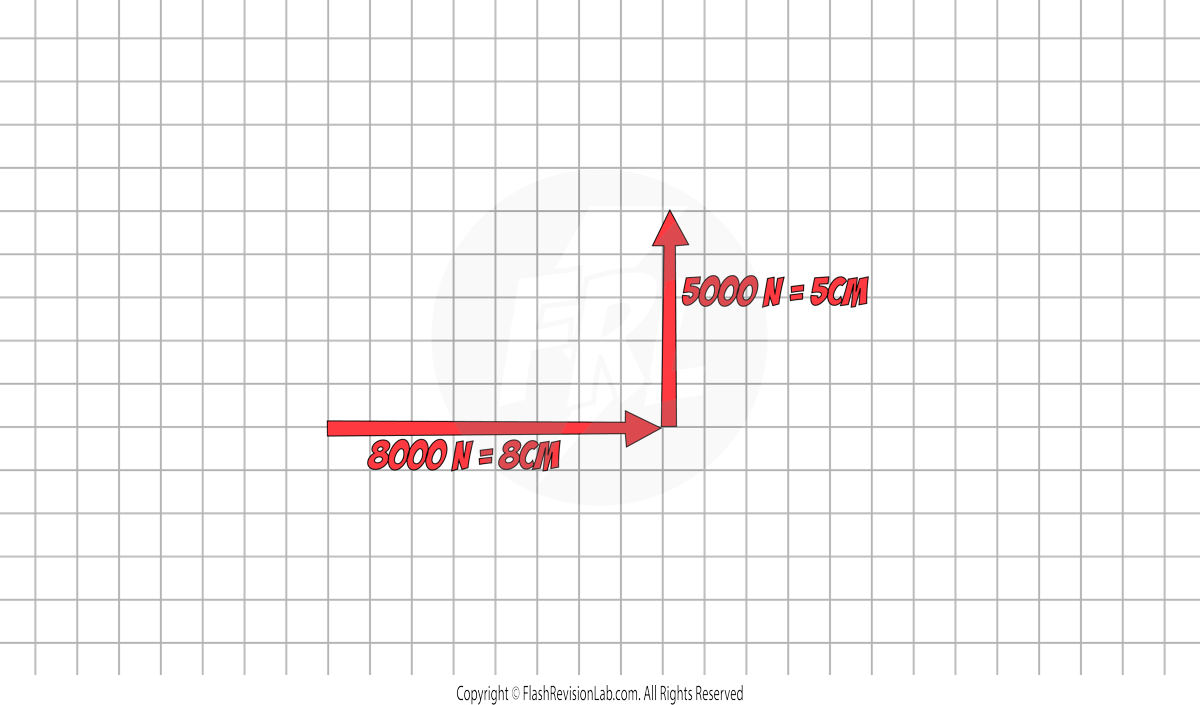
'Tip to toe' means when one force ends, the next one begins
Step 2: Draw a RESULTANT arrow from the START of the first force to the END of the second force.
Step 3. Use a RULER to measure the length of the resultant force.
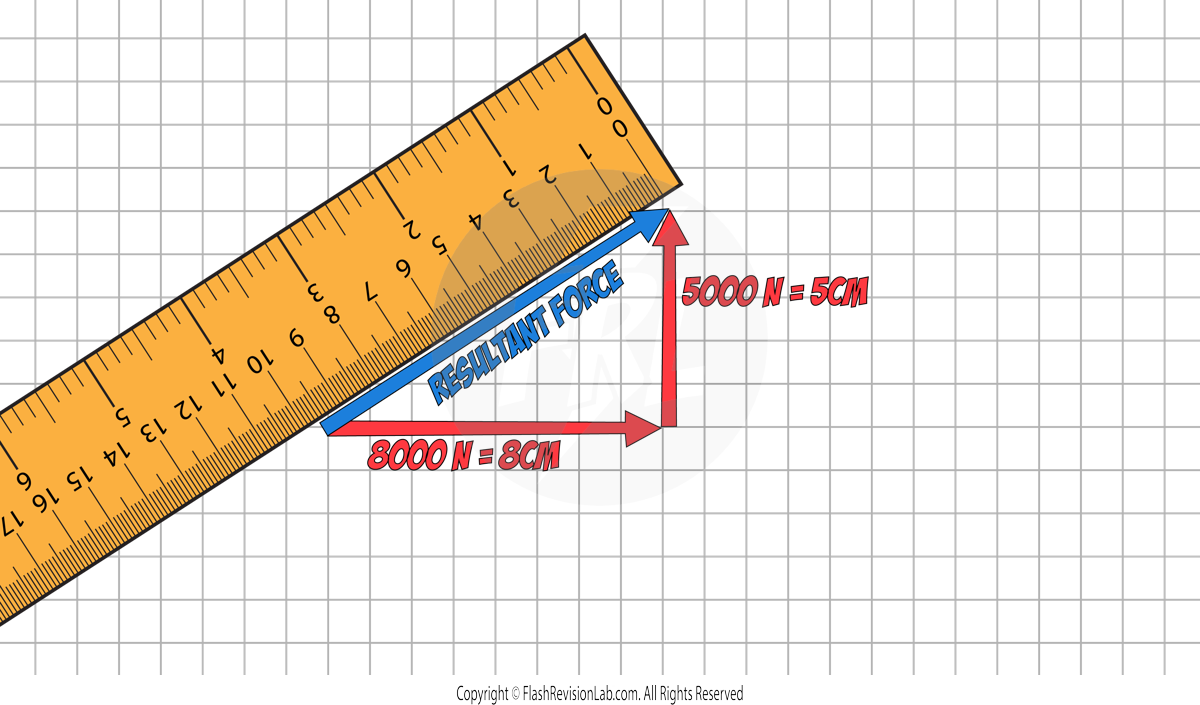
In this example, it measures 9.4cm which represents 9400N. This is the MAGNITUDE of the resultant force.
Step 4. Use a PROTRACTOR to measure the angle of the resultant force.
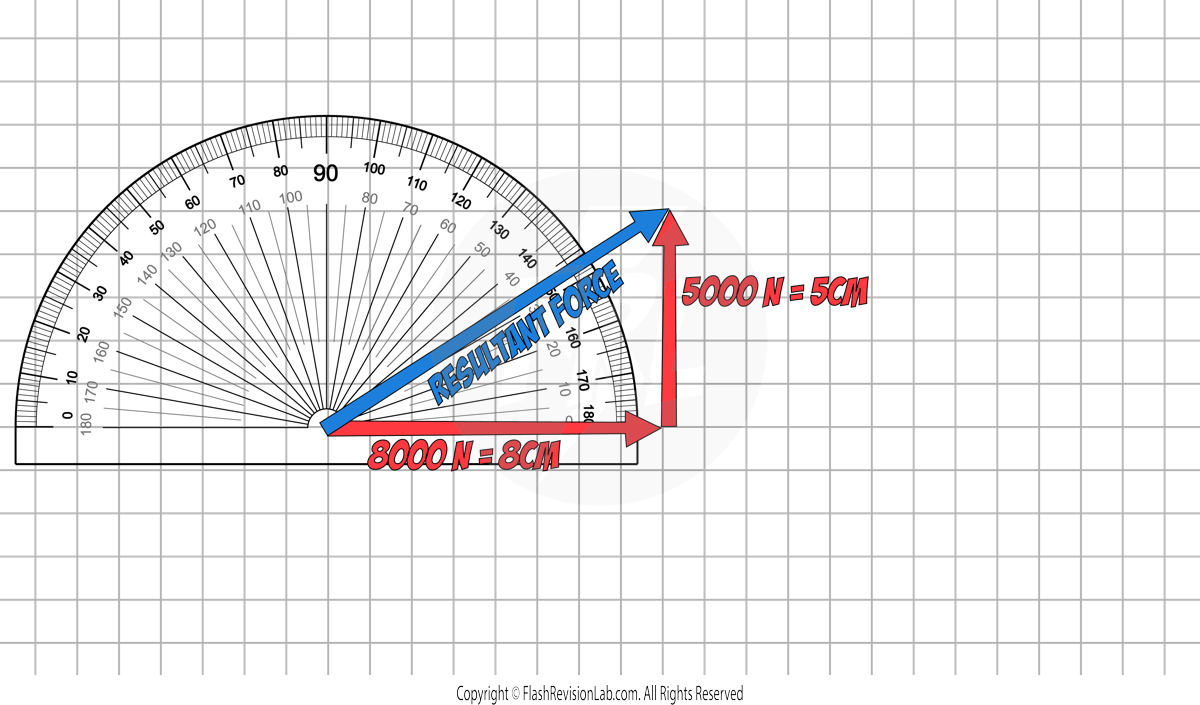
In this example, the angle measures 32°, so the DIRECTION of the of the resultant force is 32° to the horizontal.
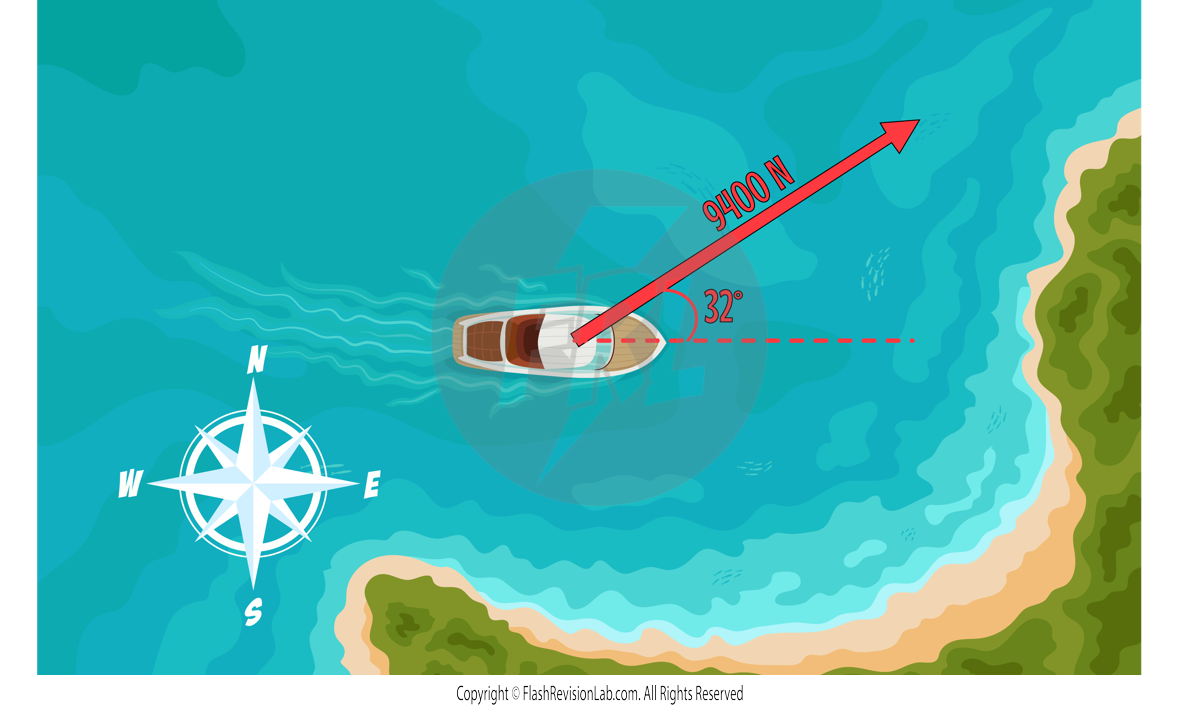
This means that the final diagram of the boat can be drawn with a SINGLE RESULTANT ARROW with the information that has been calculated:
Components of a Force
All forces can be broken down into TWO COMPONENTS:
- HORIZONTAL COMPONENT
- VERTICAL COMPONENT
These components can be resolved using a SCALE GRID.
Let's say that in this example, 1 square represents 100N.
The HORIZONTAL COMPONENT can be found by measuring the HORIZONTAL LENGTH of the force.
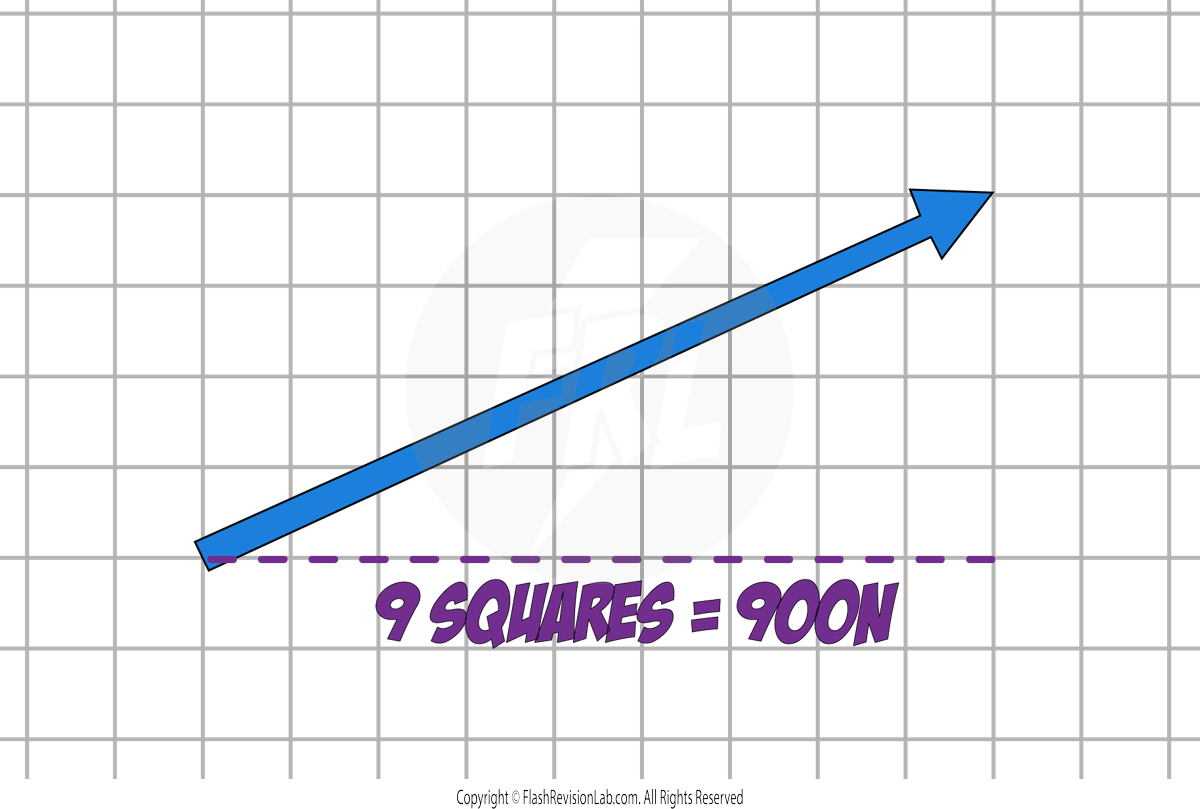
The VERTICAL COMPONENT can be found by measuring the VERTICAL LENGTH of the force.
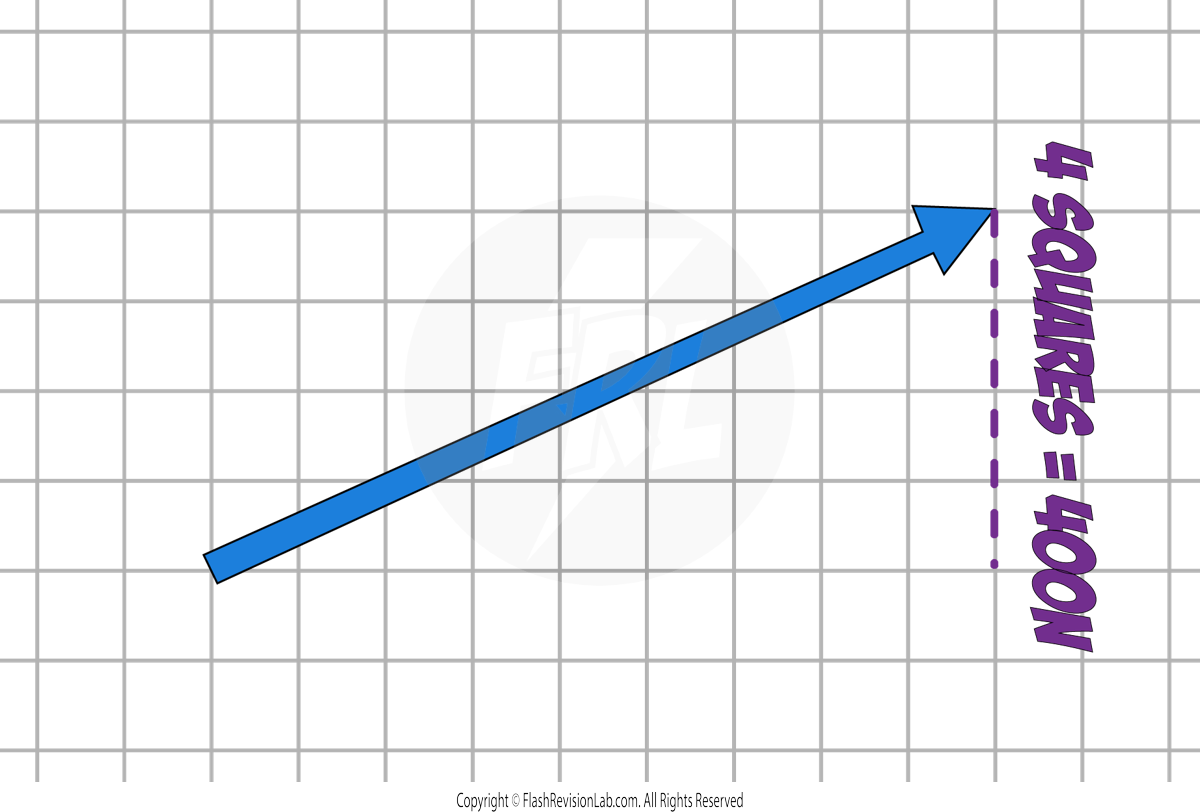
The two component forces COMBINED TOGETHER have the same effect as the ORIGINAL single force.
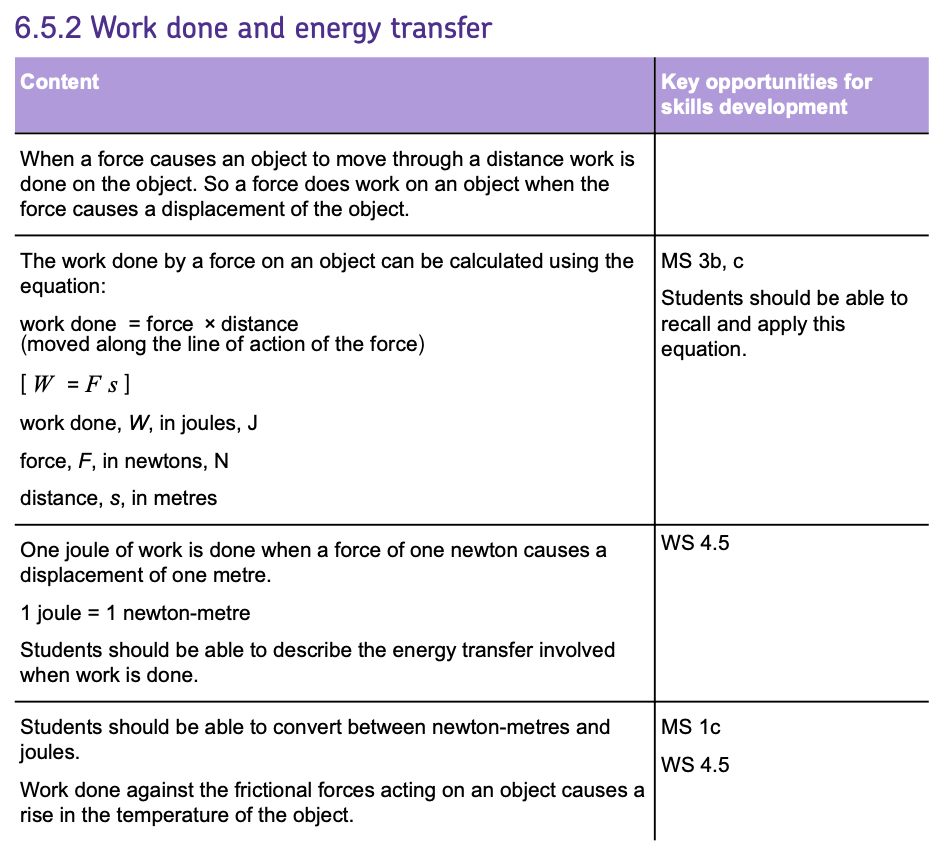
Work Done and Energy Transfer
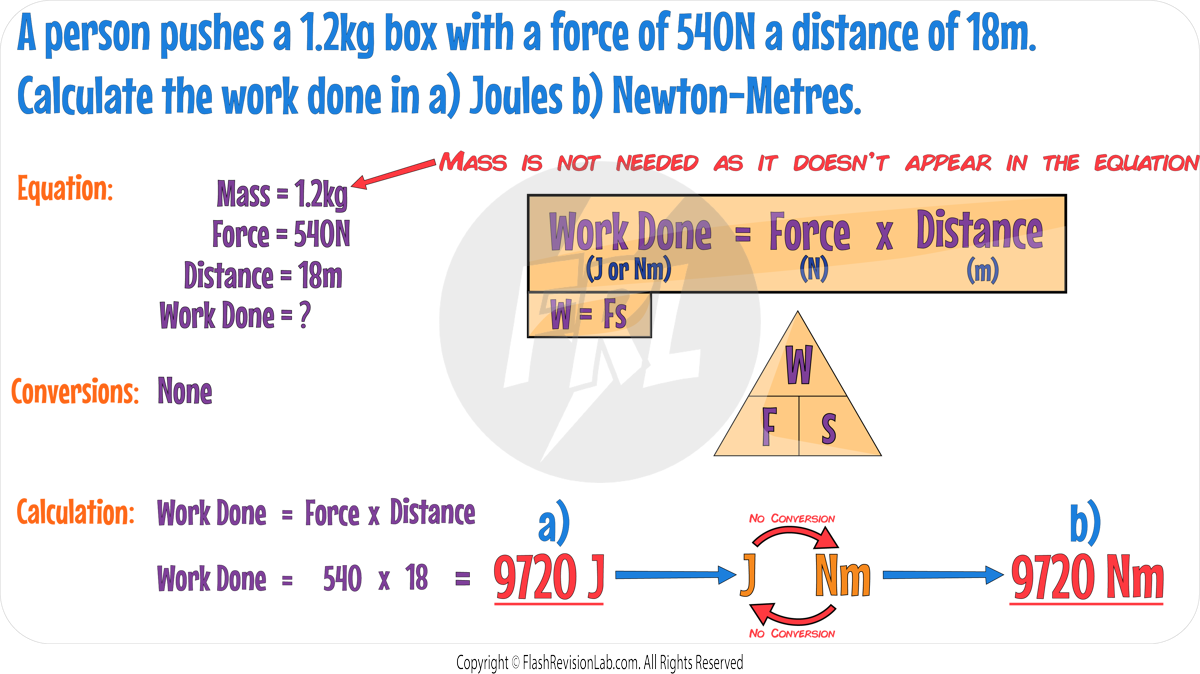
WORK is DONE on an object when it is MOVED through a distance by a particular force.
Calculating Work Done
The equation to calculate work done is:
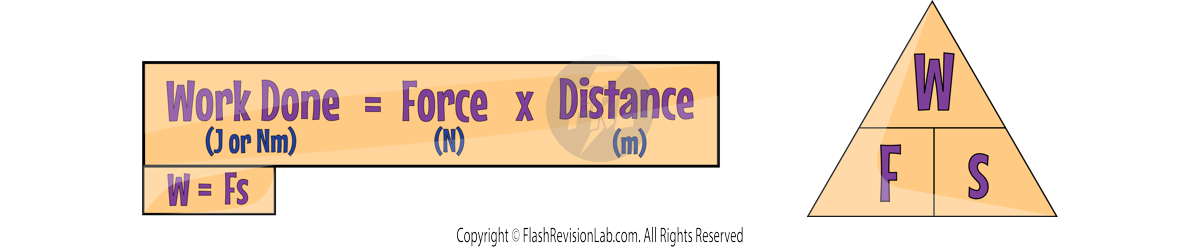
where:
- W represents work done and is measured in Joules (J) or Newton-metres (Nm).
- F represents the force applied and is measured in Newtons (N).
- s represents the distance moved by the object in the direction of the force and is measured in Metres (m).
Units of Work
- One JOULE of work is done when a force of ONE NEWTON causes an object to move a distance of ONE METRE.
- Work done in joules can also be expressed in NEWTON-METRES (Nm). Both units are EQUIVALENT to each other.
Energy Transfer
When work is done, ENERGY is transferred from one form to another.
For example, the chemical energy in muscles is converted into kinetic energy when a person PUSHES an object.
Heat Energy from Work Done
If work is done against frictional forces, the KINETIC energy is often transformed into THERMAL ENERGY, which can cause a RISE IN THE TEMPERATURE of the object involved.
For example, when a car BRAKES, the KINETIC ENERGY of the car, is converted into THERMAL ENERGY in the brake pads, which causes the temperature of the brake pads to INCREASE.
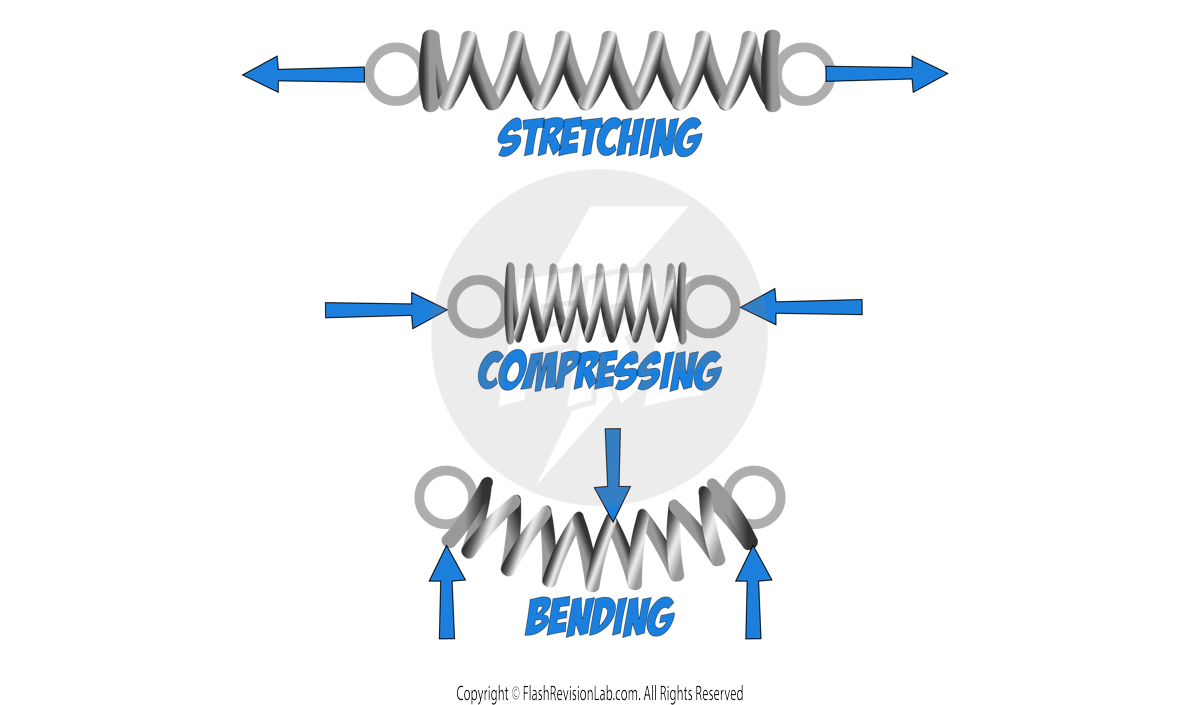
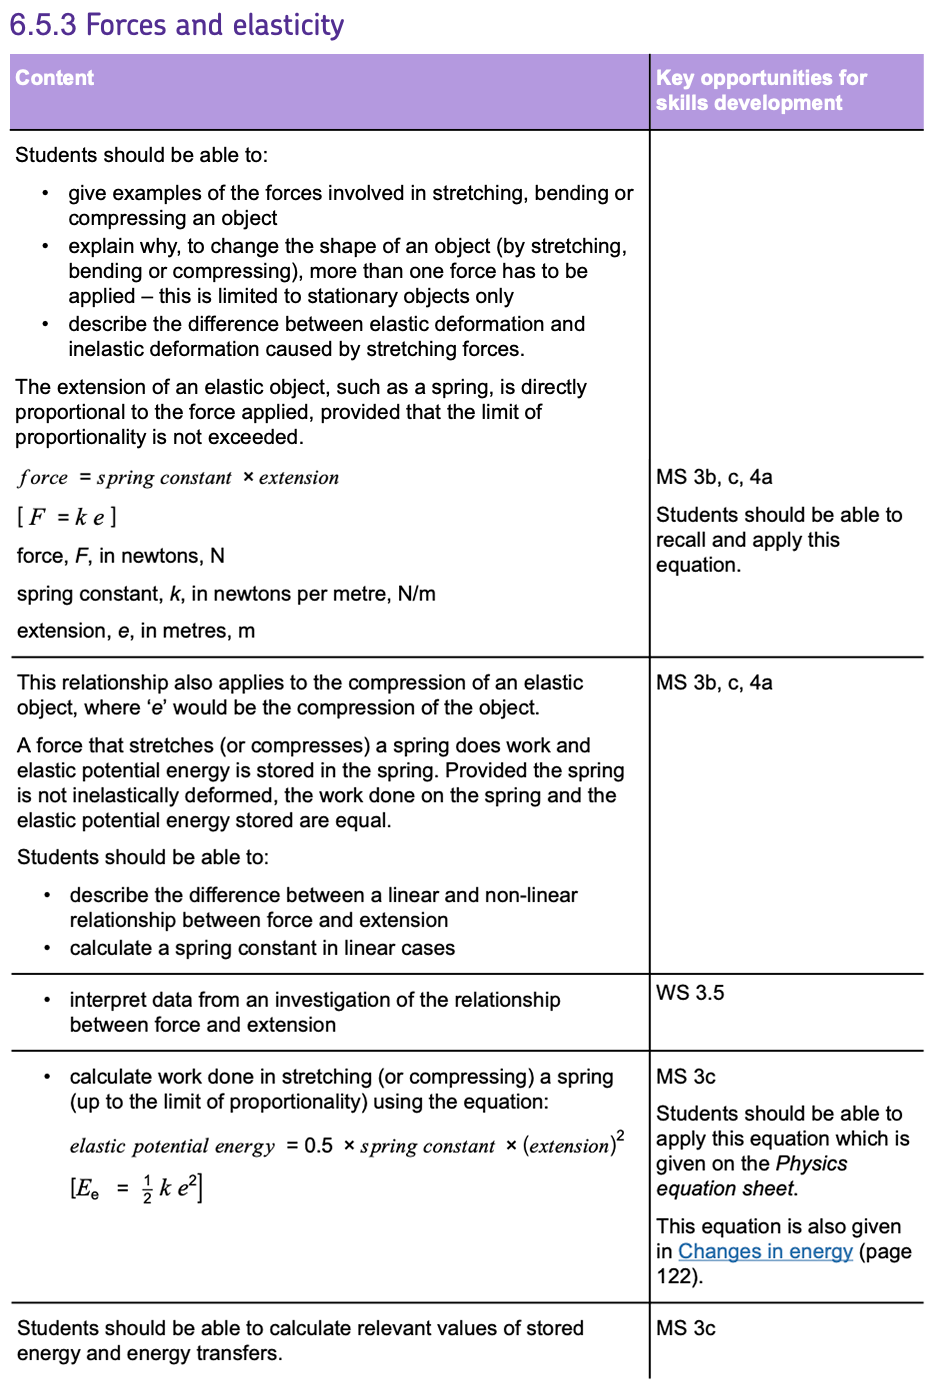
Forces and Elasticity
- When we apply more than one FORCE to a stationary object, it can cause DEFORMATION.
- Deformation is when the object CHANGES SHAPE.
- The DIRECTION the forces act in, and the POSITION they act from, determine the way the object will deform:
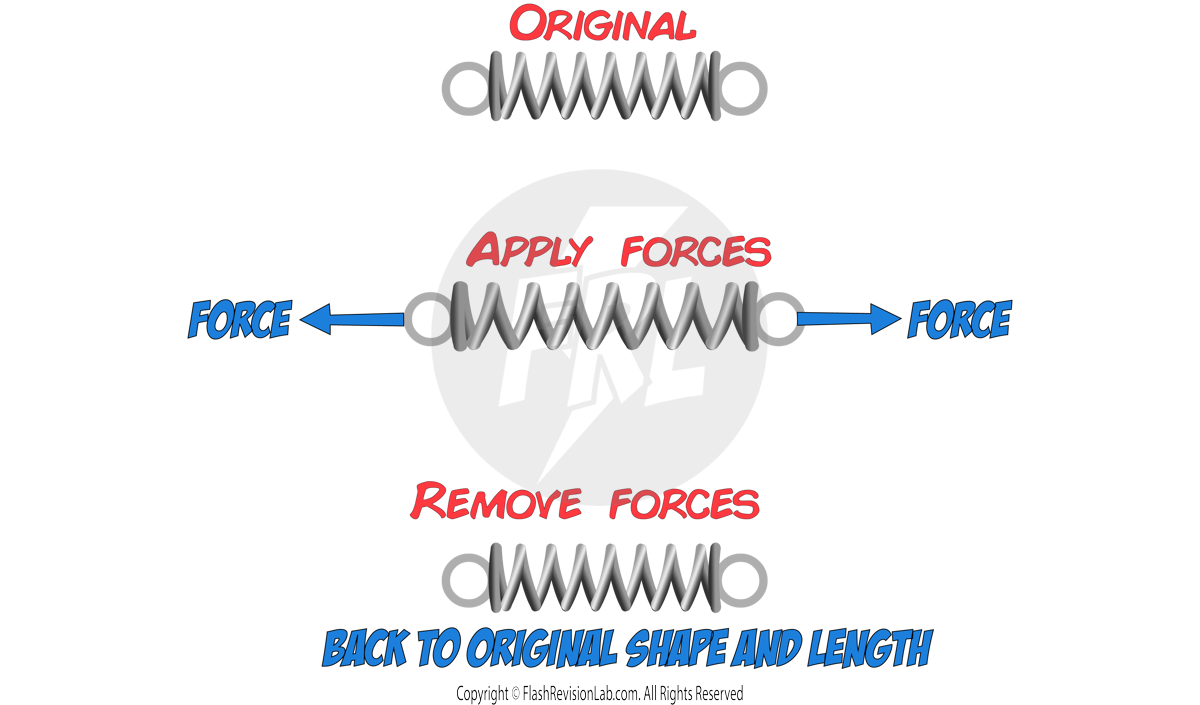
Elastic and Inelastic Deformation
There are TWO types of deformation:
1. ELASTIC deformation
This is when the object RETURNS TO ITS ORIGINAL SHAPE AND LENGTH after the forces have been removed.
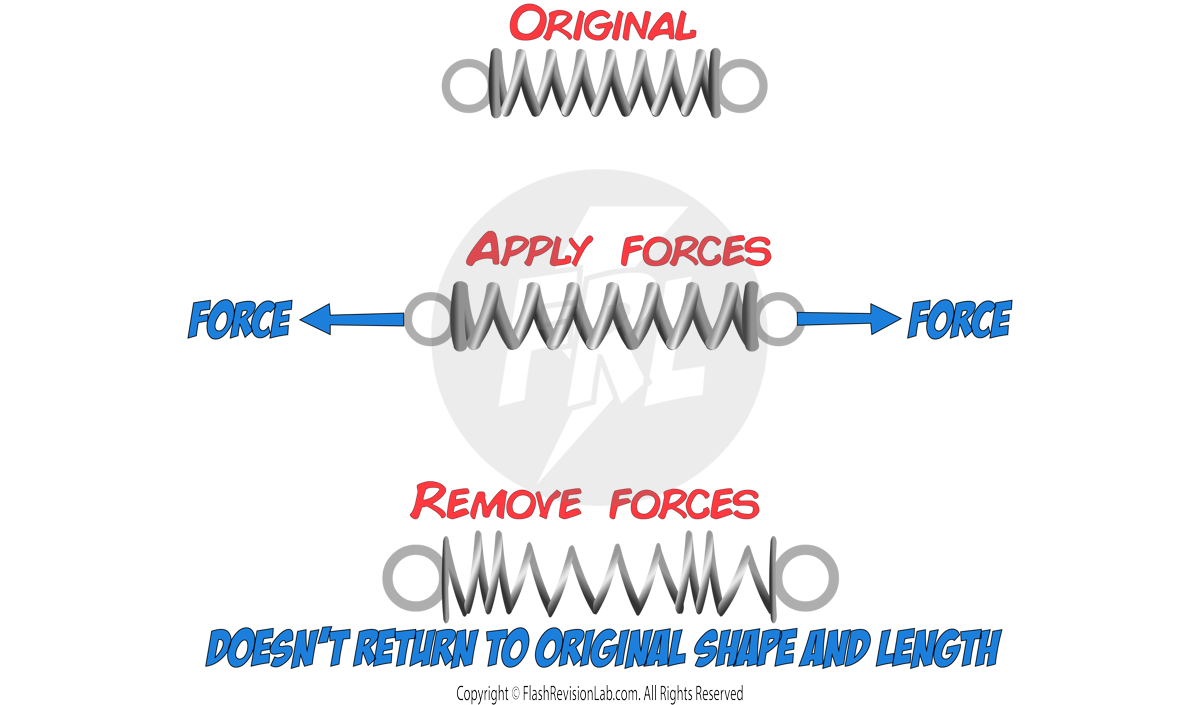
2. INELASTIC deformation
This is when the object DOESN’T return to its original shape and length after the forces have been removed.
Hooke's Law
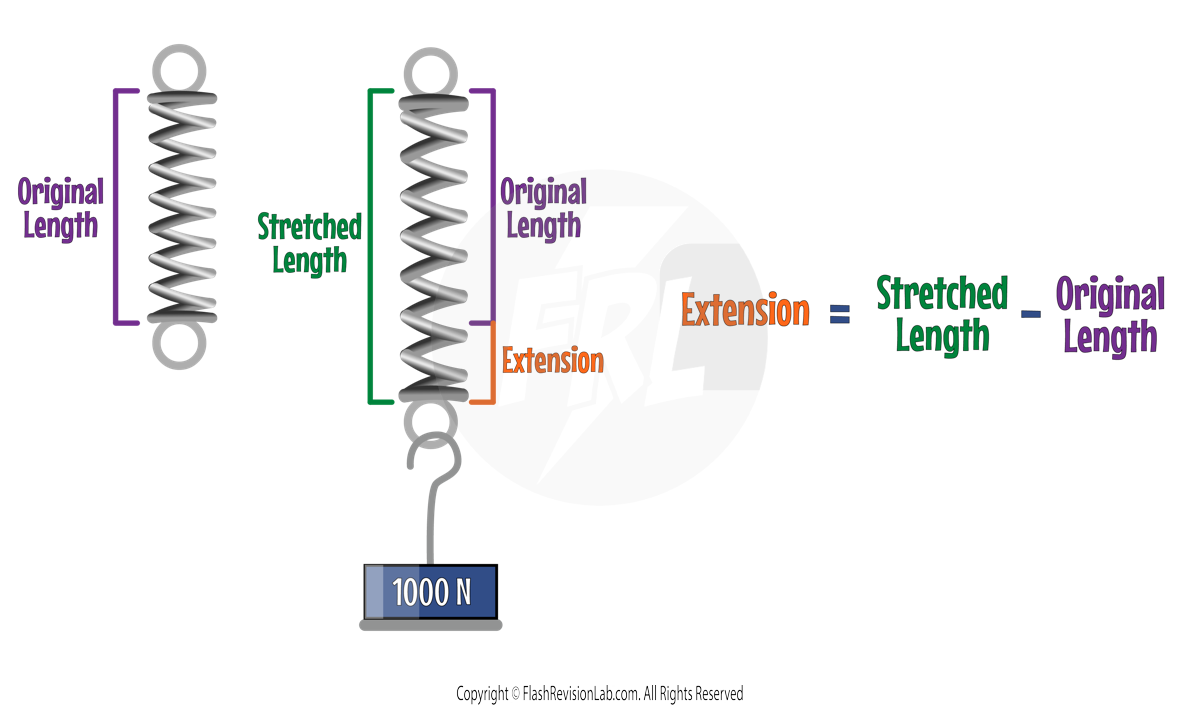
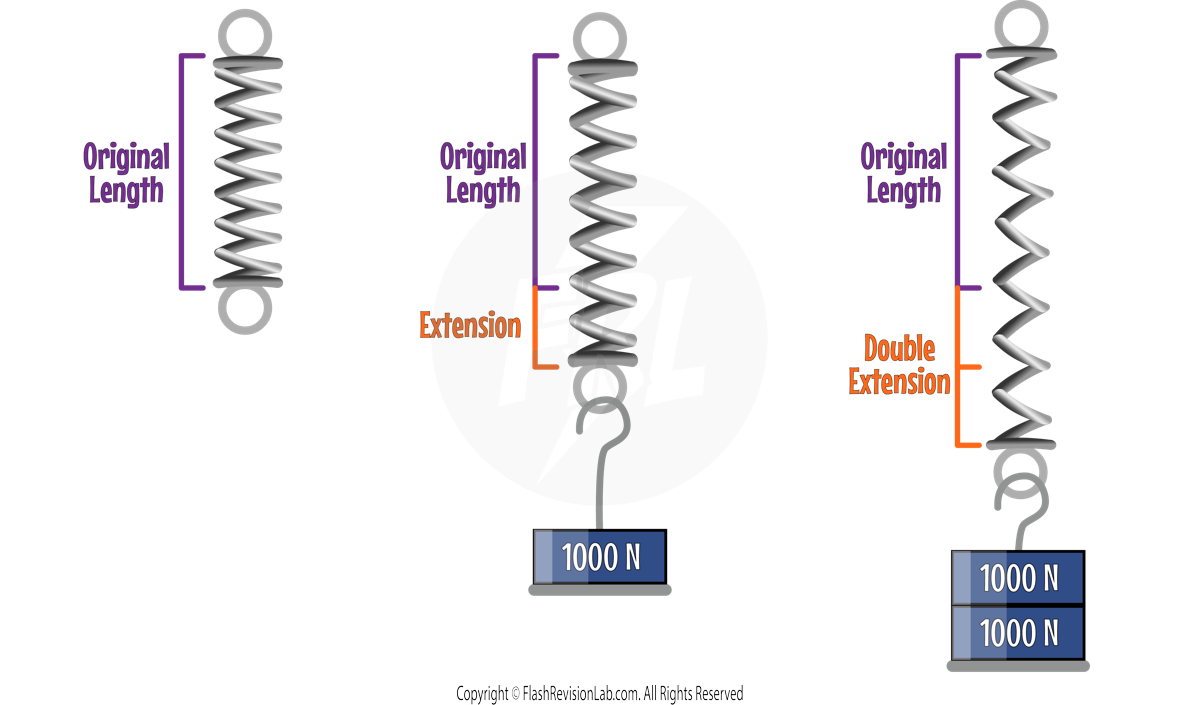
Consider adding a force of 1000N on a spring causing it to be stretched.
The EXTENSION is the DIFFERENCE between the length of STRETCHED SPRING and the ORIGINAL LENGTH of the unstretched spring:
If ANOTHER 1000N was added, the EXTENSION would DOUBLE.
This can be explained by Hooke’s Law which states that:
The extension of an elastic object like a spring is DIRECTLY PROPORTIONAL to the force applied, given the LIMIT OF PROPORTIONALITY is not exceeded.
Hookes Law can be represented with the following equation:
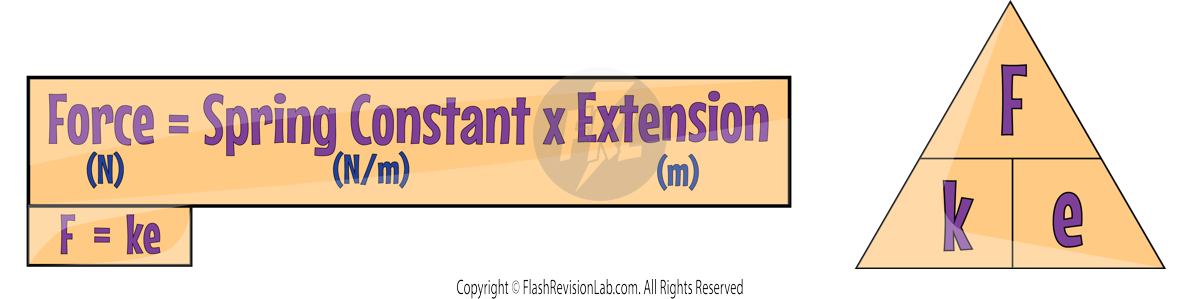
Where:
- F is the force applied in Newtons (N).
- k is the spring constant in Newtons per meter (N/m). The GREATER the spring constant, the STIFFER the spring, and the more DIFFICULT it is to stretch.
- e is the extension (or compression) in Metres (m).
Graph for Hooke’s Law
The relationship between the force applied and extension can be shown on a FORCE-EXTENSION graph:
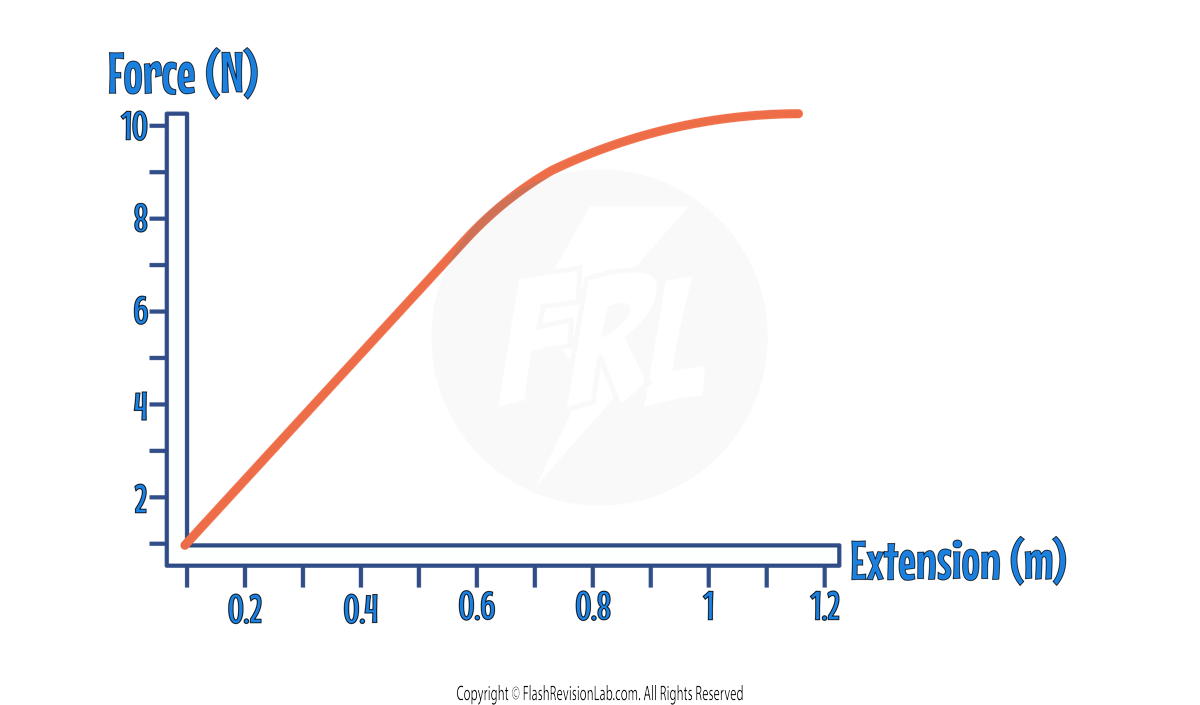
This graph shows a LINEAR relationship until an extension of around 0.7m. This shows force and extension is DIRECTLY PROPORTIONAL until the object is stretched to 0.7m.
LIMIT OF PROPORTIONALITY
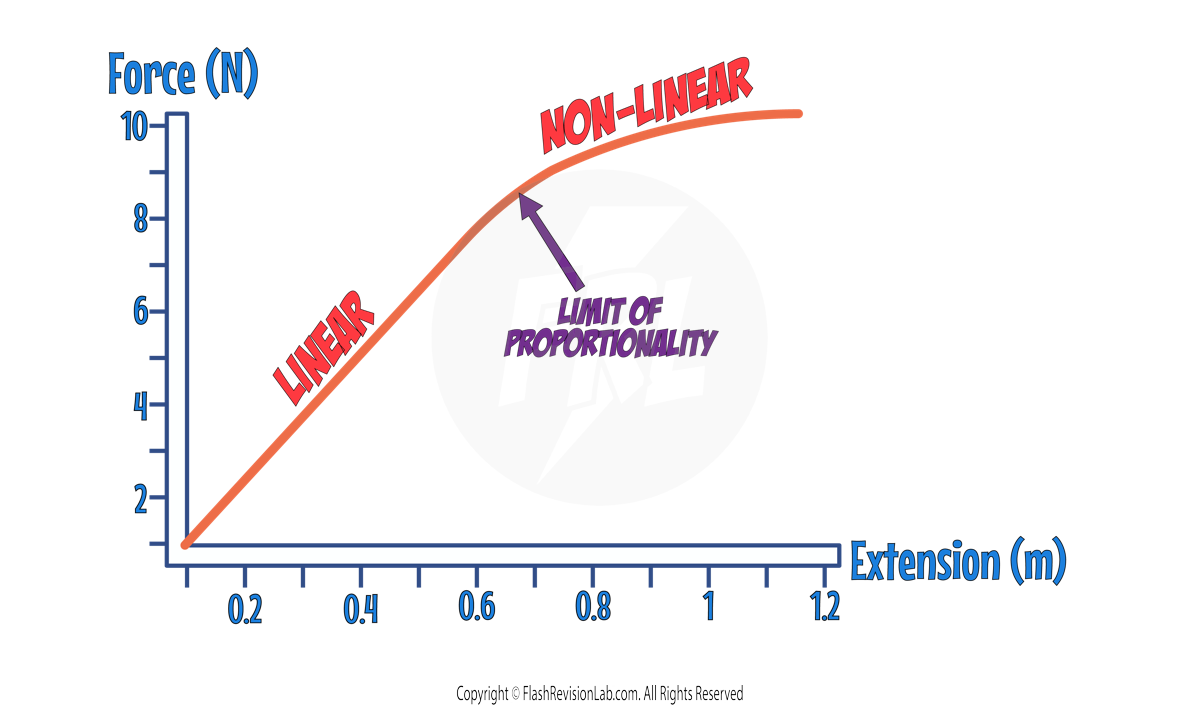
The point at which the graph becomes NON-LINEAR (0.7m) is known as the LIMIT OF PROPORTIONALITY, and if the object is stretched to more than this extension, the force is NO LONGER proportional to the extension.
ELASTIC LIMIT
Eventually, if you add enough force to a spring, it will deform INELASTICALLY and will NOT return to its original shape and length. The point at which this happens is known as the ELASTIC LIMIT.
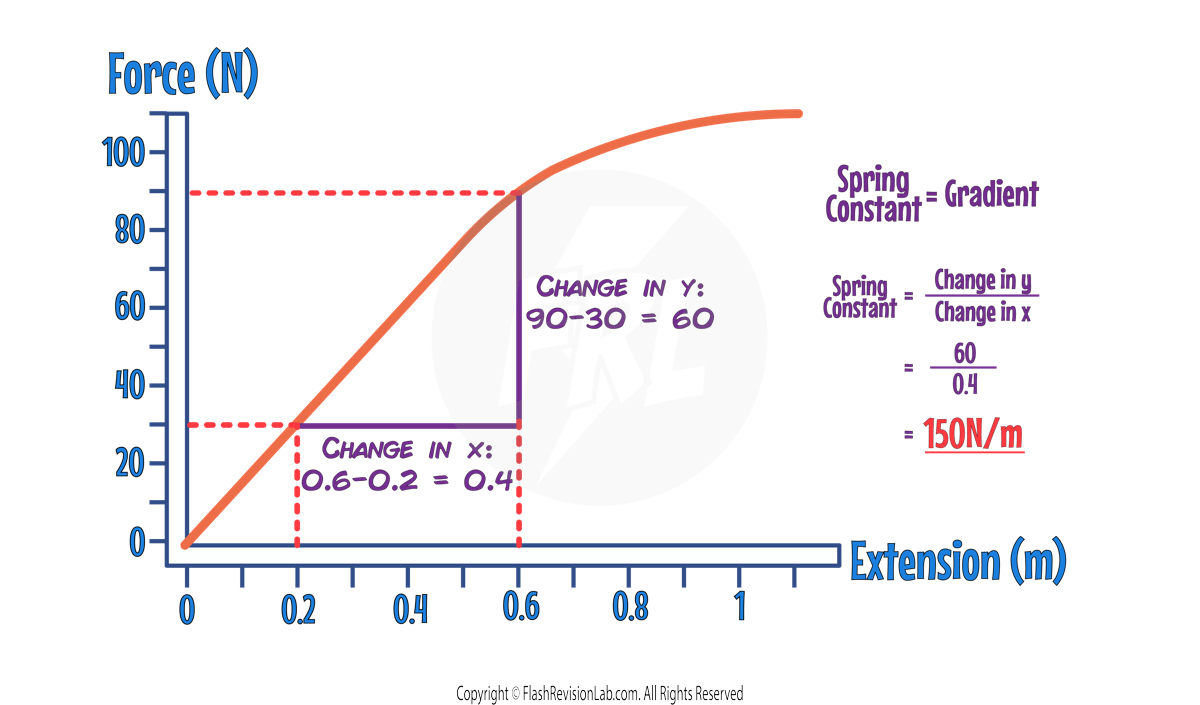
You can work out the SPRING CONSTANT using the graph, by finding the GRADIENT of the LINEAR section:
ELASTIC POTENTIAL ENERGY
The WORK DONE in stretching (or compressing) an elastic object is stored as ELASTIC POTENTIAL ENERGY within the object.
During ELASTIC DEFORMATION: The WORK DONE is EQUAL to the ELASTIC POTENTIAL ENERGY stored in the object
During INELASTIC DEFORMATION: Some of the WORK DONE is DISSIPATED as heat, meaning the object does NOT return to its original shape and size.
- The elastic potential energy stored during ELASTIC DEFORMATION can be calculated using the equation:
- Elastic Potential Energy is measured in Joules (J).
- Spring Constant (k) is measured in Newtons per Metre (N/m).
- Extension (e) is measured in Metres (m).
Required Practical: Force and Extension
This experiment investigates the relationship between the FORCE and EXTENSION of a spring.
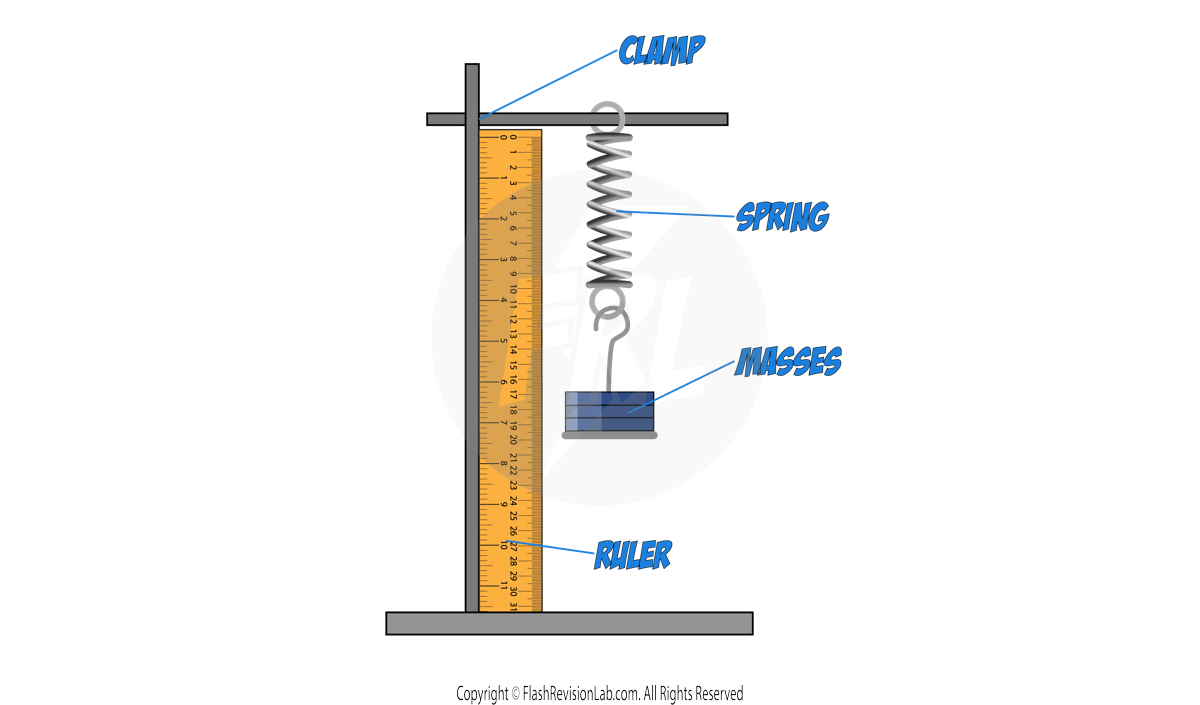
- Setup: Position the spring and attach a RULER beside it for measuring extension.
- Initial Measurement: Record the spring's length without any added mass, which is its ORIGINAL LENGTH.
- Adding Mass: Place a 100 g mass hanger on the spring, which will extend due to the added weight.
- Recording Data: Note the mass in kilograms (convert grams to kilograms by dividing by 1000) and the extended length from the ruler in centimetres (convert to metres by dividing by 100).
- Incremental Increases: Continue to add 100 g increments to the mass hanger, each time recording the new total mass and the extension.
- Repetition for Accuracy: Remove the masses and repeat the process SEVERAL TIMES and find an AVERAGE.
Analysis of Results
- To find the EXTENSION of the spring, subtract the ORIGINAL LENGTH from the FINAL LENGTH for each measurement.
- To find the FORCE from the added MASSES, you can use the equation:

Plotting the Force-Extension Graph
- Plot the calculated values on a FORCE against EXTENSION graph.
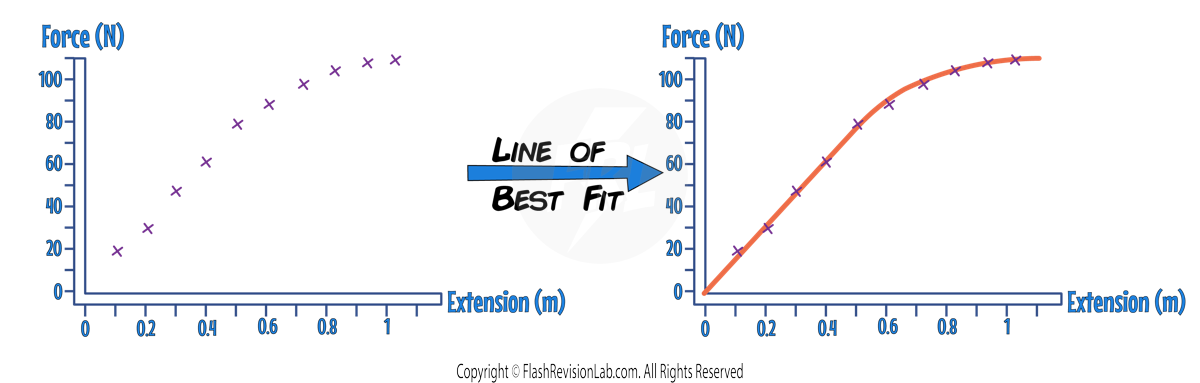
- Draw a LINE OF BEST FIT and note the linear region. If it's a straight line, the force and extension are proportional, and Hooke's law applies.
- If the graph curves, the point at which it begins to curve indicates the LIMIT OF PROPORTIONALITY.
- You can work out the SPRING CONSTANT using the graph, by finding the GRADIENT of the LINEAR section:

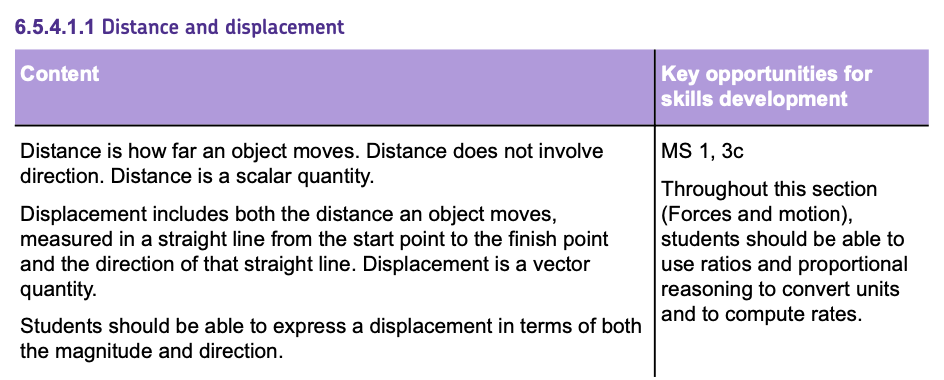
Distance and Displacement
Distance
DISTANCE measures how far an object has travelled, regardless of its starting point or final position. It is a SCALAR quantity, meaning it only has magnitude and NO direction.
e.g. Let’s say a person travels from location A to B to C in the following diagram:
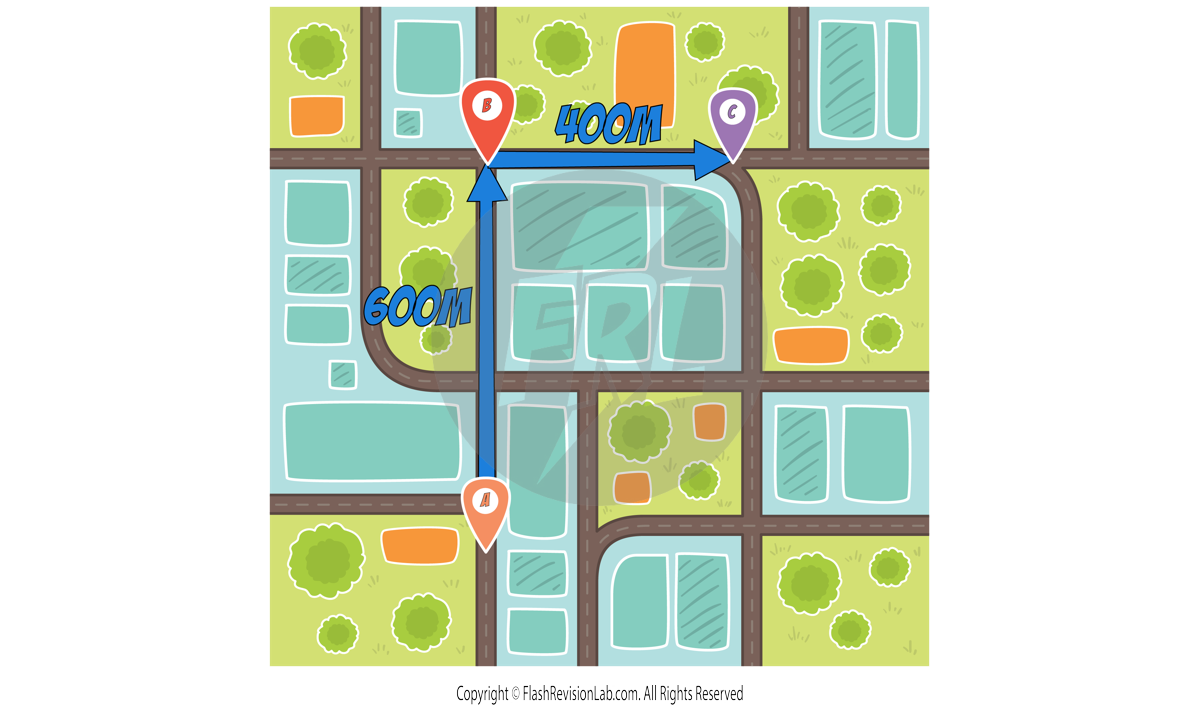
The total DISTANCE travelled by the person would be:
600m + 400m = 1000m
Displacement
DISPLACEMENT refers to how far an object is from its starting point and in what direction — it's a straight-line measurement from START to FINISH.
Unlike distance, displacement is a VECTOR quantity because it considers both magnitude AND direction.
e.g. To find the DISPLACEMENT of the same example, you would look at the DIRECT distance from the START (point A) to the FINISH (point C).
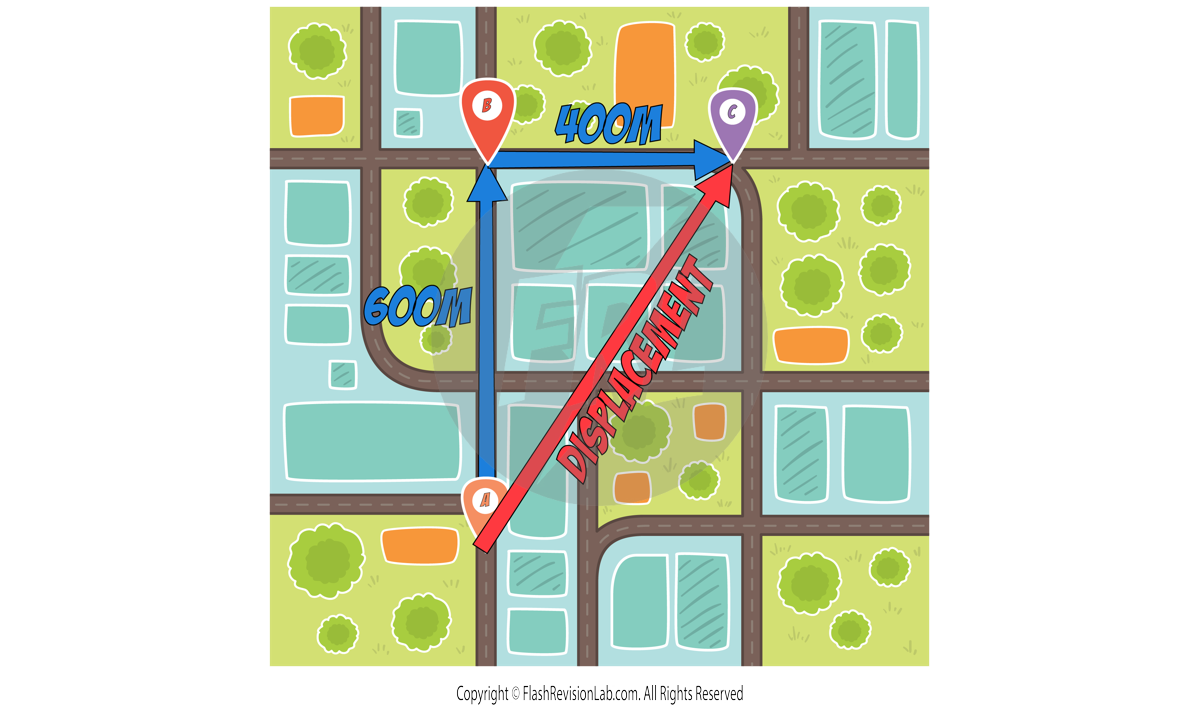
You would also need to give a DIRECTION from the START to the FINISH. This could be in the form of an ANGLE and can be found using a PROTRACTOR on a scale diagram.
Speed and Velocity
Speed
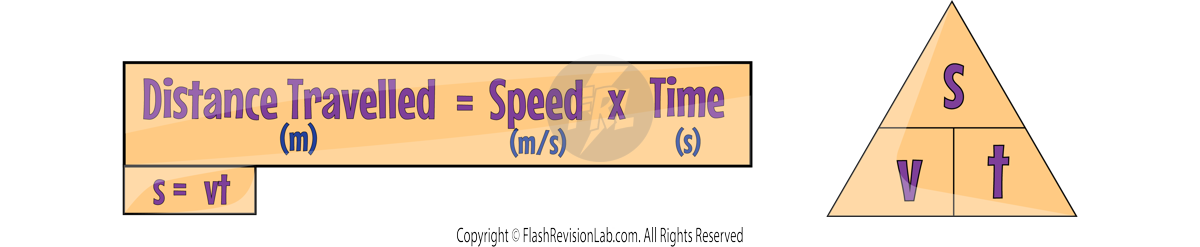
SPEED is a measure of how fast an object is moving and is defined as the DISTANCE TRAVELLED in a given TIME.
It is a SCALAR quantity, meaning it only considers magnitude and NOT direction.
The formula for speed is:
Where:
- Distance is measured in Metres (m).
- Time is measurerd in Seconds (s).
- Speed is measured in Meters per second (m/s).
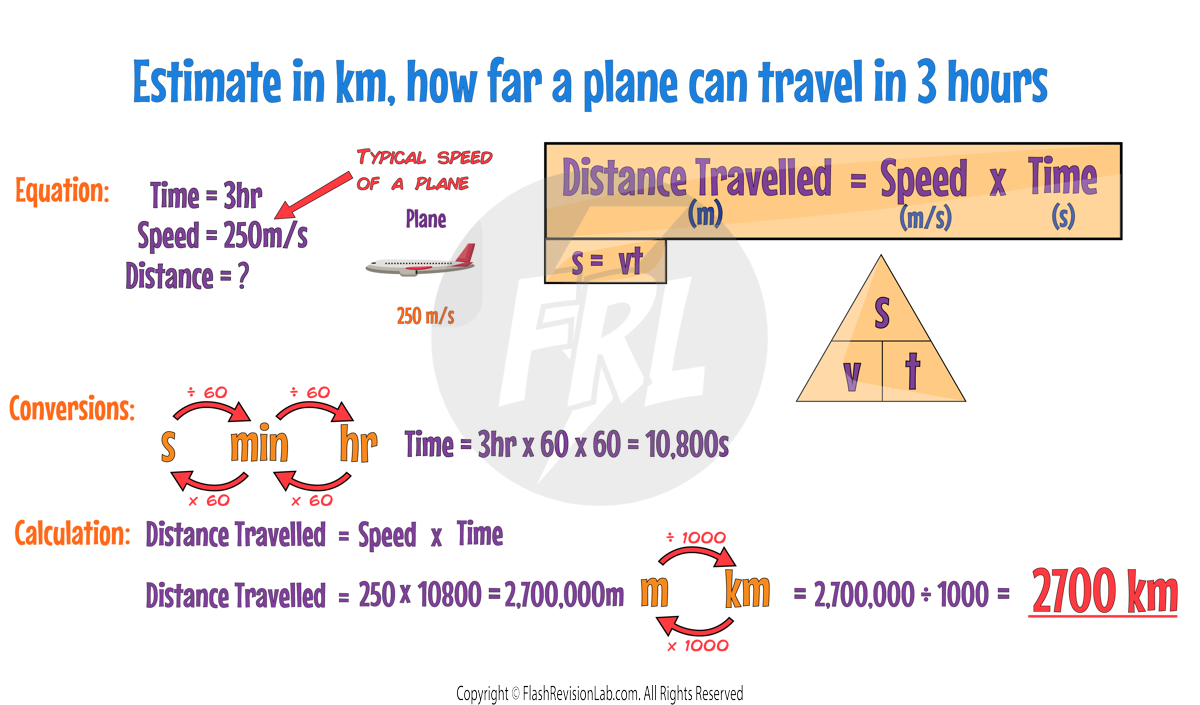
Typical Speed Values
The speed of a moving object is rarely constant. When people walk, run or travel in a car their speed is constantly CHANGING.
The speed at which a person can walk, run or cycle depends on many factors including: age, terrain, fitness and distance travelled.
On AVERAGE typical speeds might include:
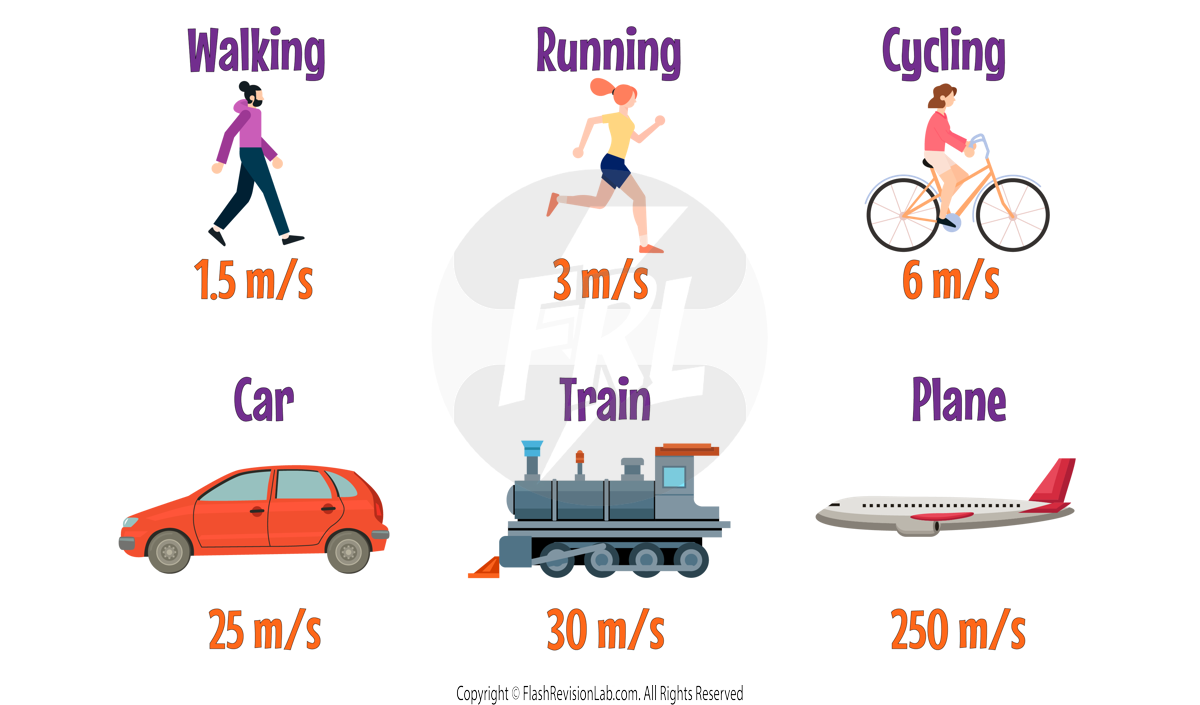
The SPEED OF SOUND in air, is roughly 330 m/s, and it can vary depending on what substance it travels through.
Velocity
VELOCITY is the speed of an object in a given DIRECTION, which makes it a VECTOR.
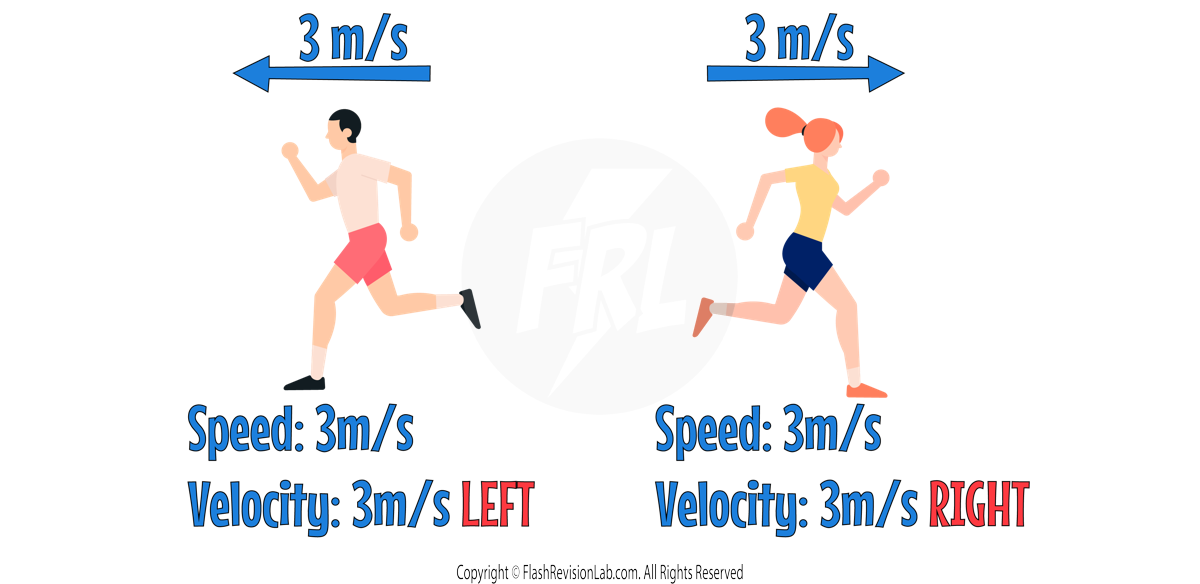
In the above example, the SPEED of both runners is the SAME, but the VELOCITY is different as they are running in DIFFERENT DIRECTIONS.
Now consider a car driving around a roundabout in CIRCULAR MOTION at a CONSTANT SPEED of 30 m/s:
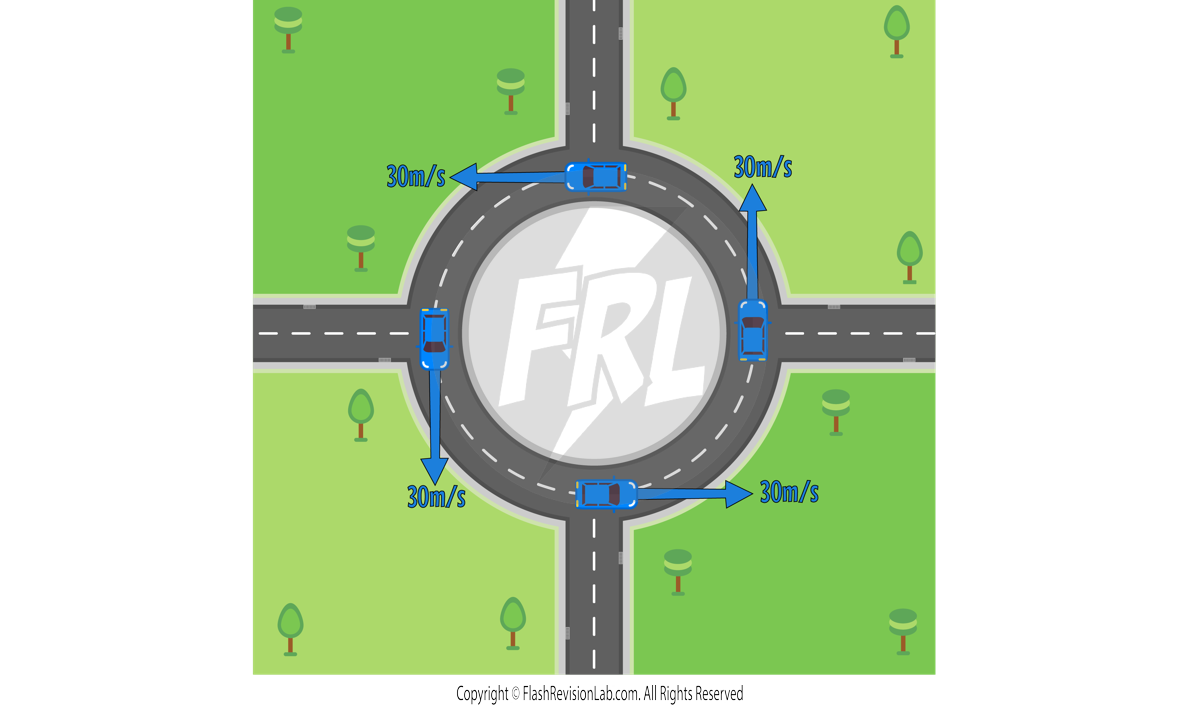
Even though the SPEED is CONSTANT, the VELOCITY is NOT because the DIRECTION that the car moves in is ALWAYS CHANGING.
Distance-Time Graphs
If an object moves along a straight line, the distance it travels can be represented by a DISTANCE-TIME graph.
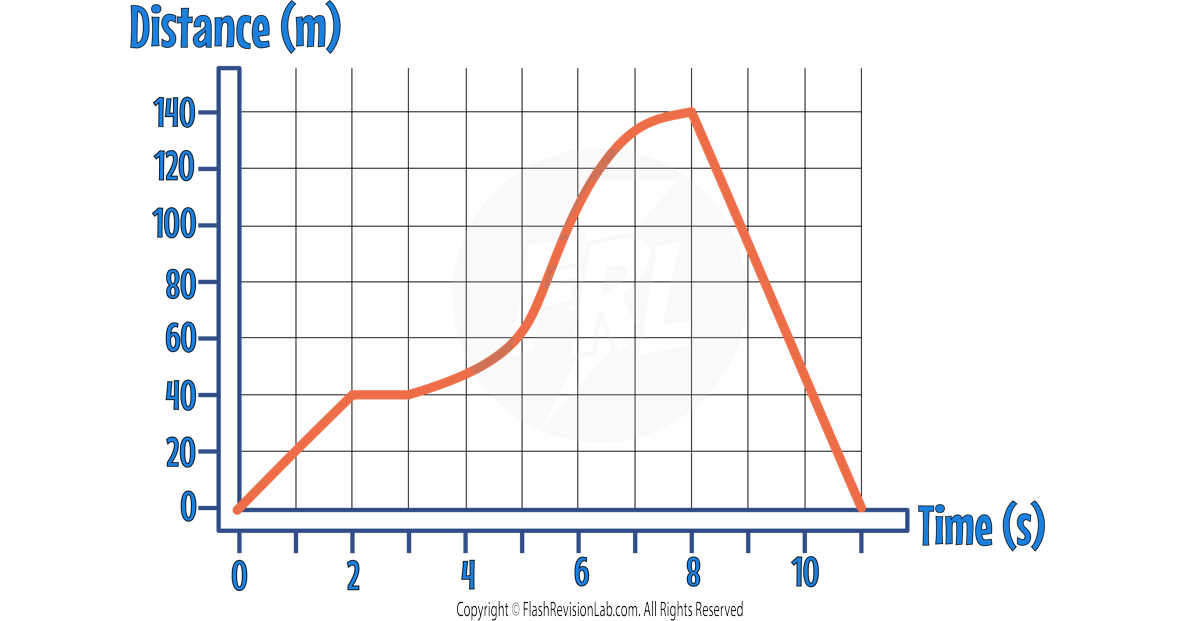
The GRADIENT (steepness) of the line tells you the SPEED of the object. The STEEPER the line, the GREATER the speed.
Different features on a distance-time graph can tell you different information about how an object is travelling.
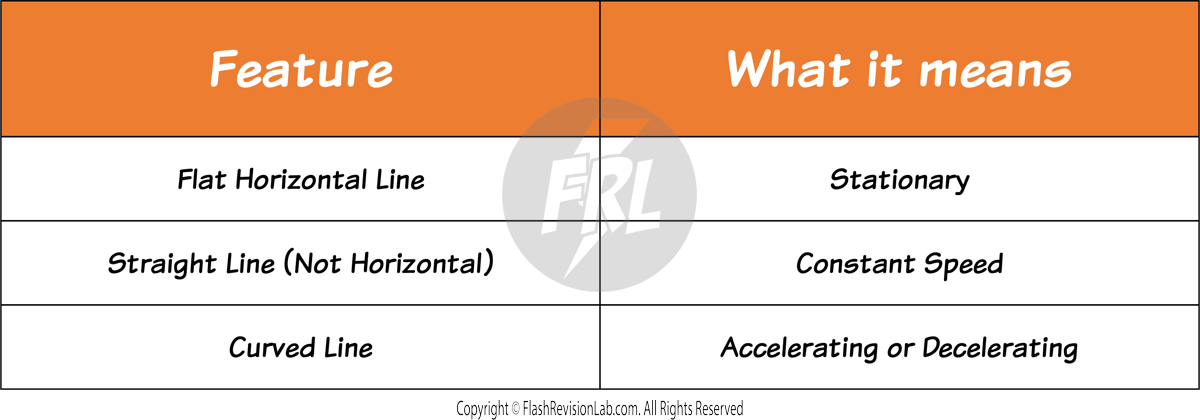
Let’s use this information to describe the motion of an object with the following distance-time graph:

Section 1:
A STRAIGHT LINE means the object is travelling at a CONSTANT SPEED. You can calculate the speed by using the equation:
Speed = Distance/Time = 40/2 = 20m/s
Section 2:
A FLAT HORIZONTAL line means the object is STATIONARY for 1s.
Section 3:
The CURVED line is getting STEEPER, which means the GRADIENT is INCREASING.
This means the SPEED is INCREASING, so the object is ACCELERATING.
Section 4:
The CURVED line is getting LESS STEEP, which means the GRADIENT is DECREASING.
This means the SPEED is DECREASING, so the object is DECELERATING.
Section 5:
The STRAIGHT LINE means the object is travelling at a CONSTANT SPEED. You can calculate the speed by using the equation:
Speed = Distance/Time = 120/(11-8) = 40m/s
The fact that the line goes DOWNWARDS, tells you the object is travelling back to a distance of 0, which means it's travelling BACKWARDS to return to its starting position.
Using Tangents
CURVED LINES on distance-time graphs mean the object is ACCELERATING or DECELERATING.
You can work out its SPEED at a particular time by drawing a TANGENT and finding its GRADIENT.
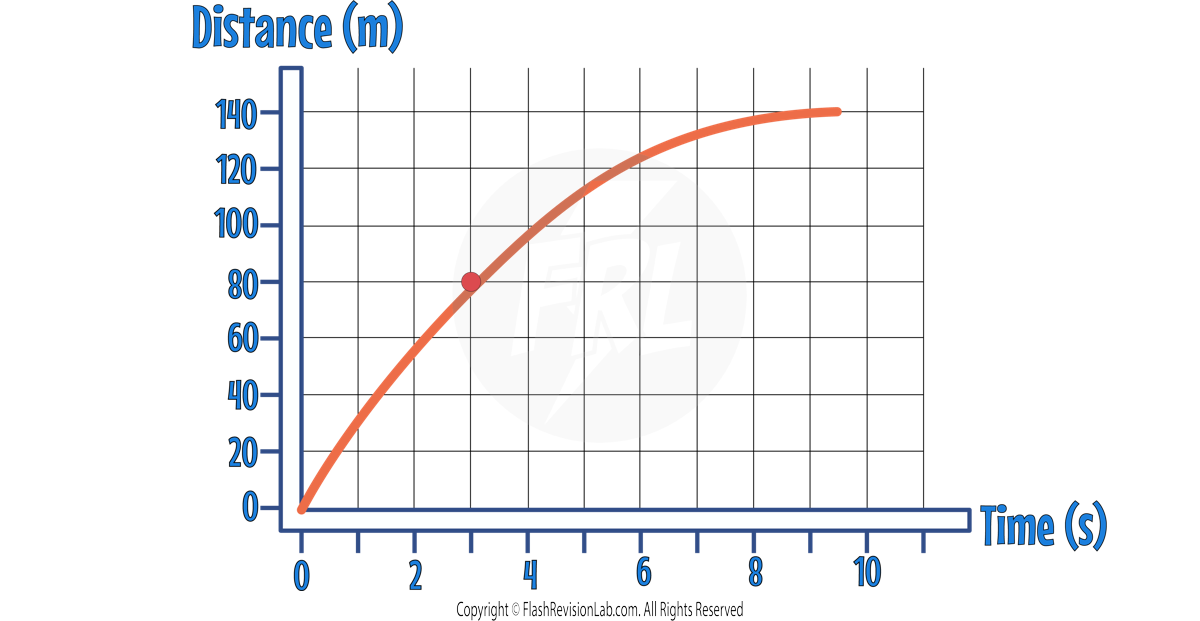
This graph shows an object DECELERATING. You can find the SPEED at 3s by drawing a TANGENT at 3s and finding its GRADIENT.
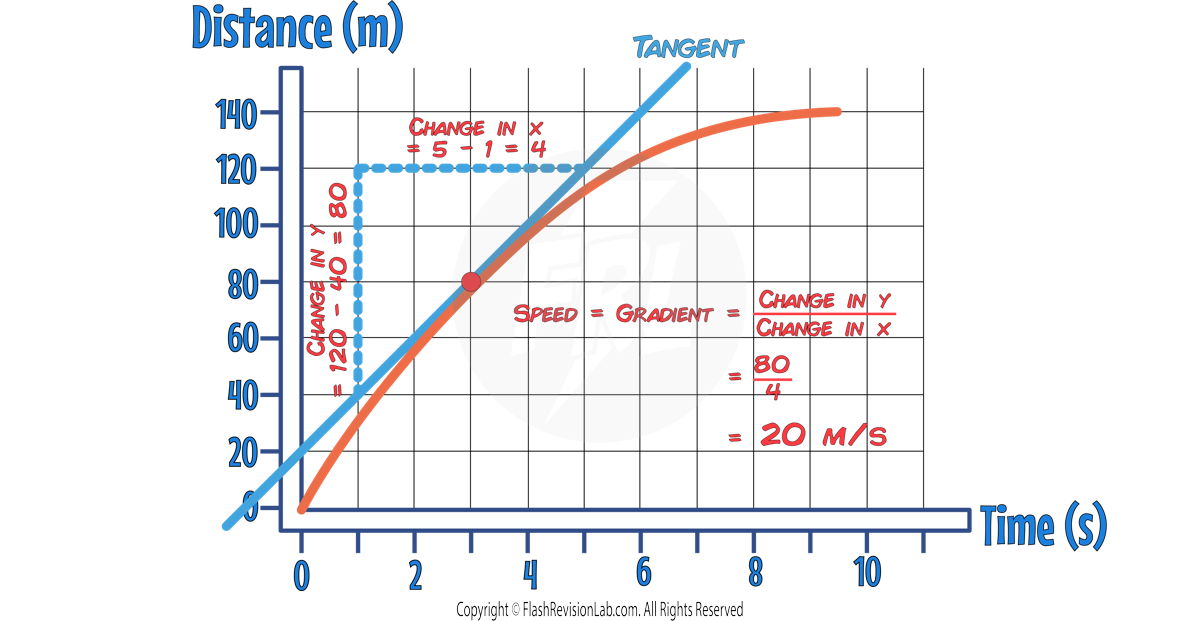
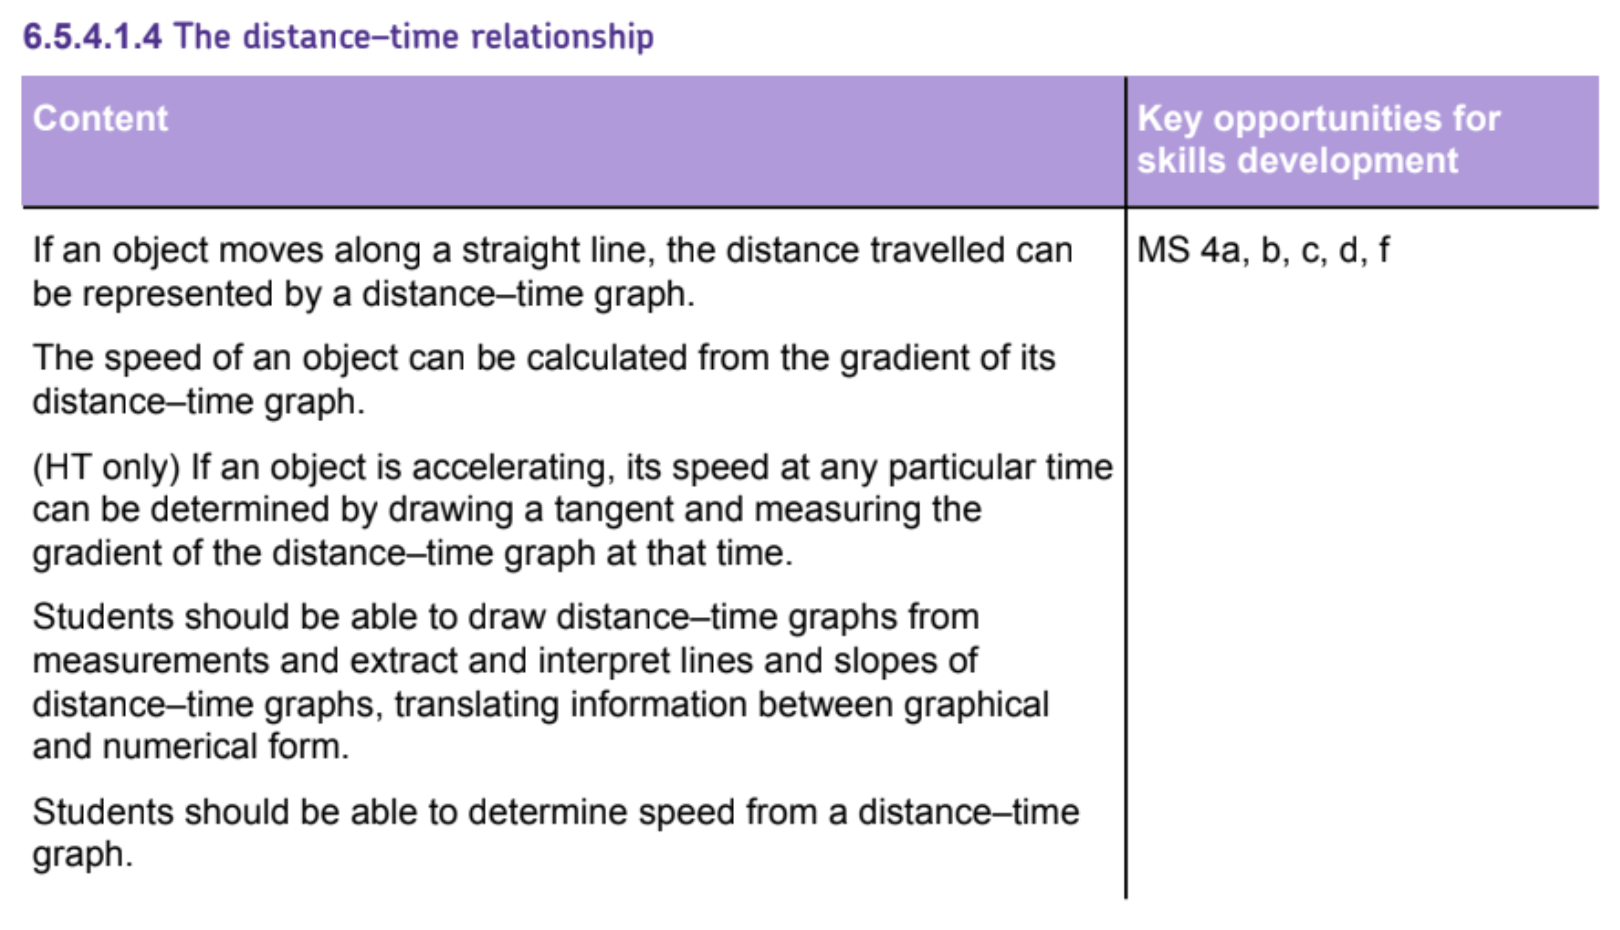
Acceleration
ACCELERATION is the rate at which an object changes its velocity.
It is a VECTOR quantity, which means it includes both magnitude and DIRECTION.
If the value of ACCELERATION is POSTIVE, the object is getting FASTER (accelerating).
If the value of ACCELERATION is NEGATIVE, the object is getting SLOWER (decelerating).
Average Acceleration
To find average acceleration, we use the equation:
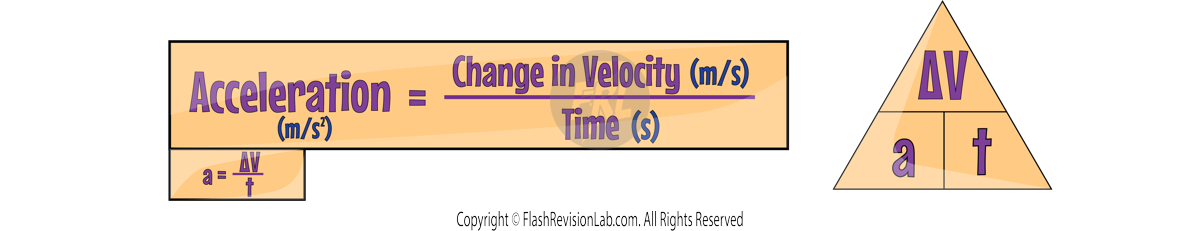
Where:
- Δv is the change in VELOCITY in Metres per second (m/s).
- t is the TIME taken for this change in Seconds) (s).
- a is the ACCELERATION in Metres per second squared (m/s²).
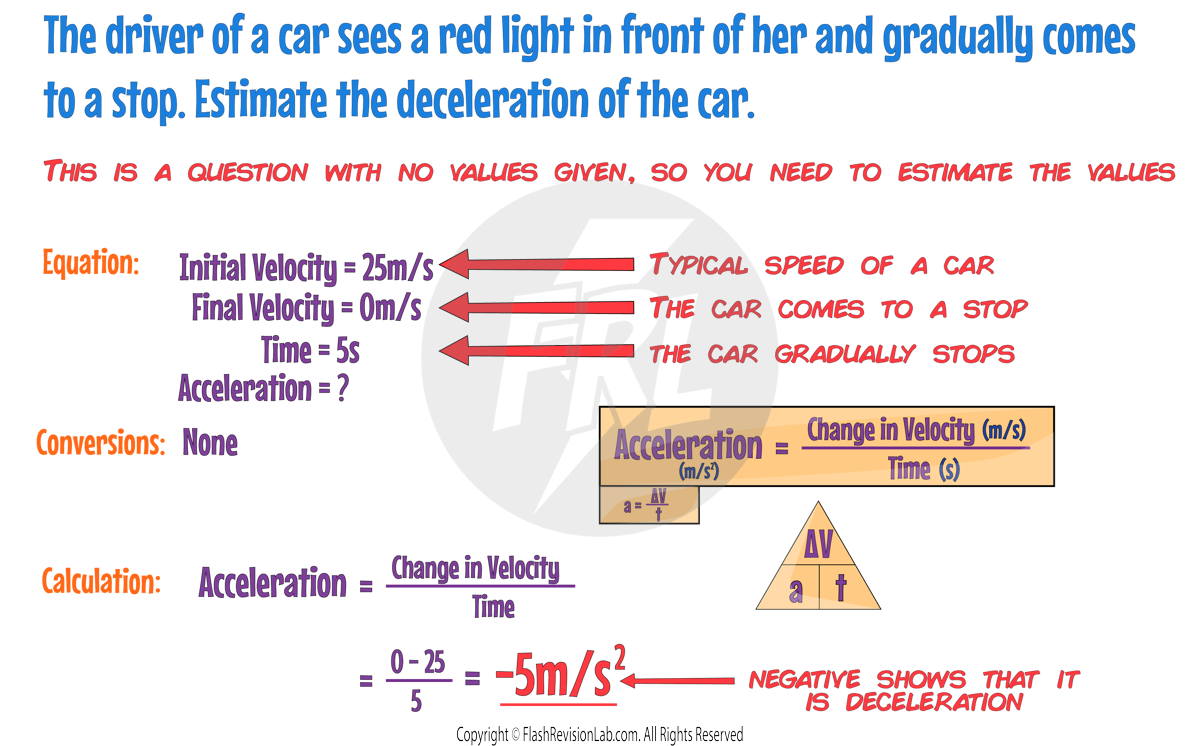
Uniform Acceleration
For uniform acceleration, the following equation can be used:
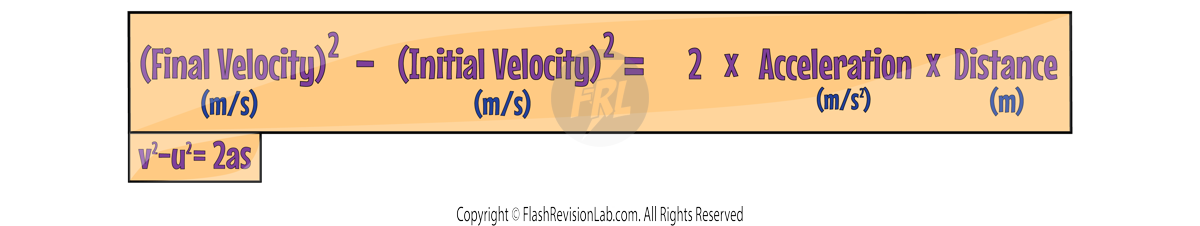
Where:
- v is the FINAL VELOCITY.
- u is the INITIAL VELOCITY.
- a is the ACCELERATION.
- s is the DISTANCE travelled.
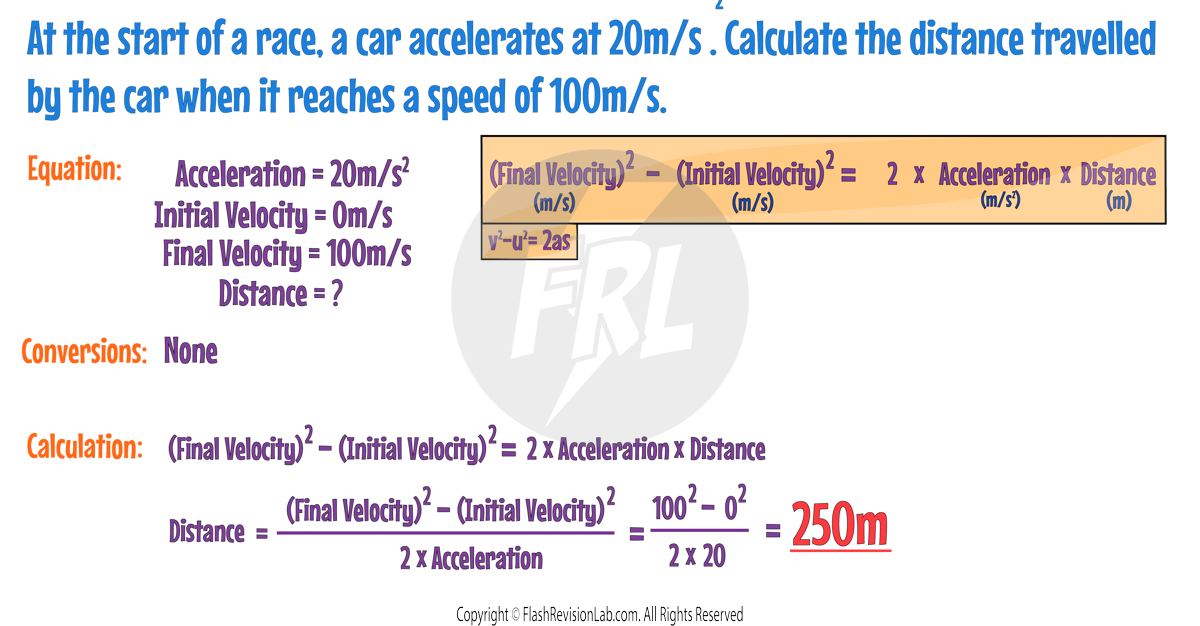
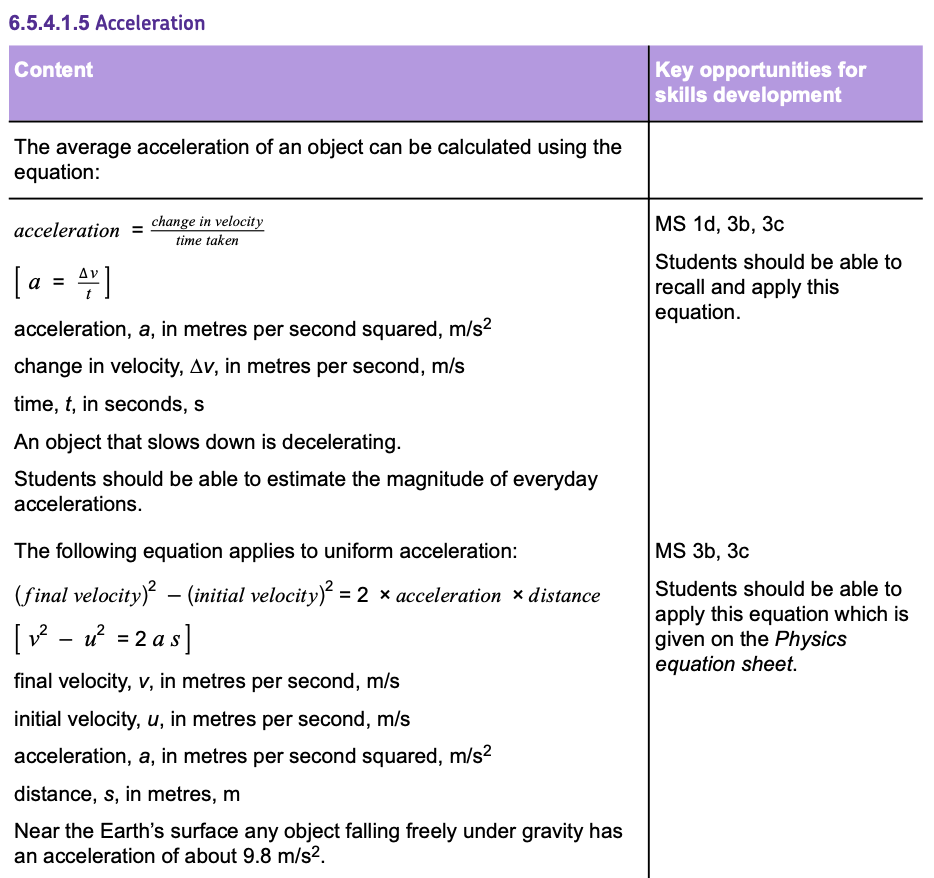
Velocity-Time Graphs
If an object moves along a straight line, the velocity it travels at can be represented by a velocity–time graph:
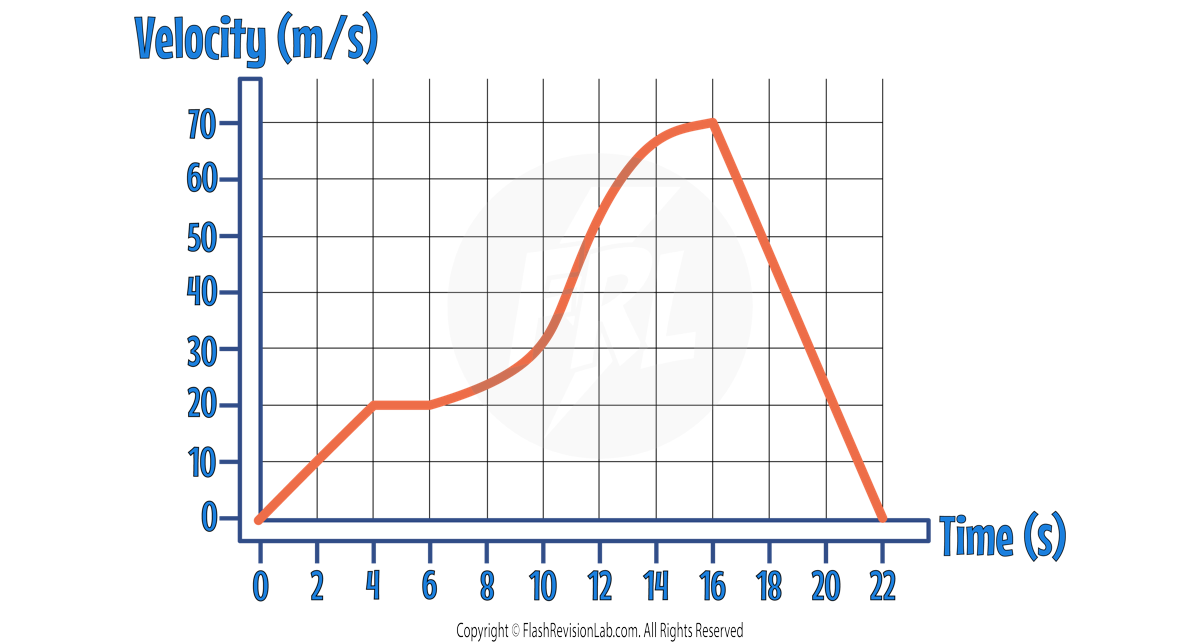
The GRADIENT (steepness) of the line tells you the ACCELERATION of the object. The STEEPER the line, the GREATER the ACCELERATION.
Different features on a velocity-time graph can tell you different information about how an object is travelling.
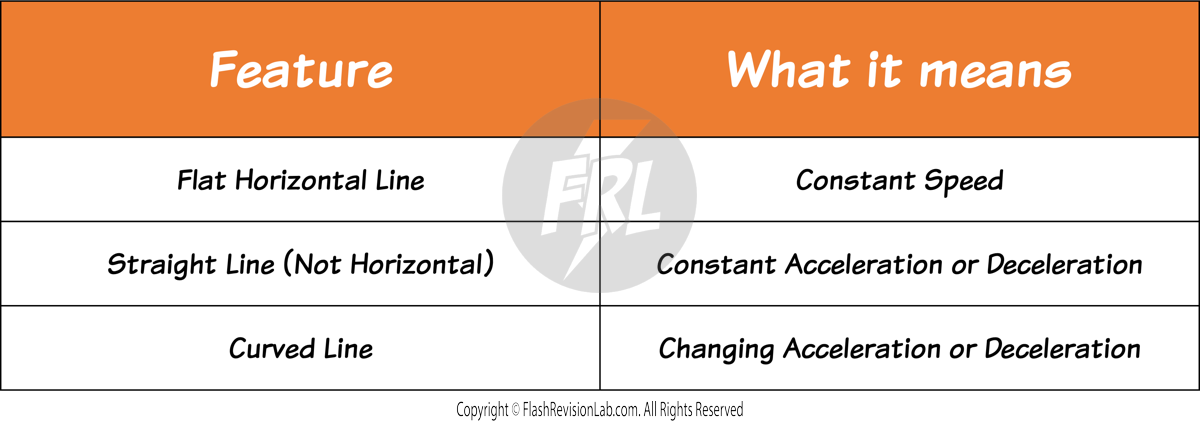
Let’s use this information to describe the motion of an object with the following velocity-time graph:
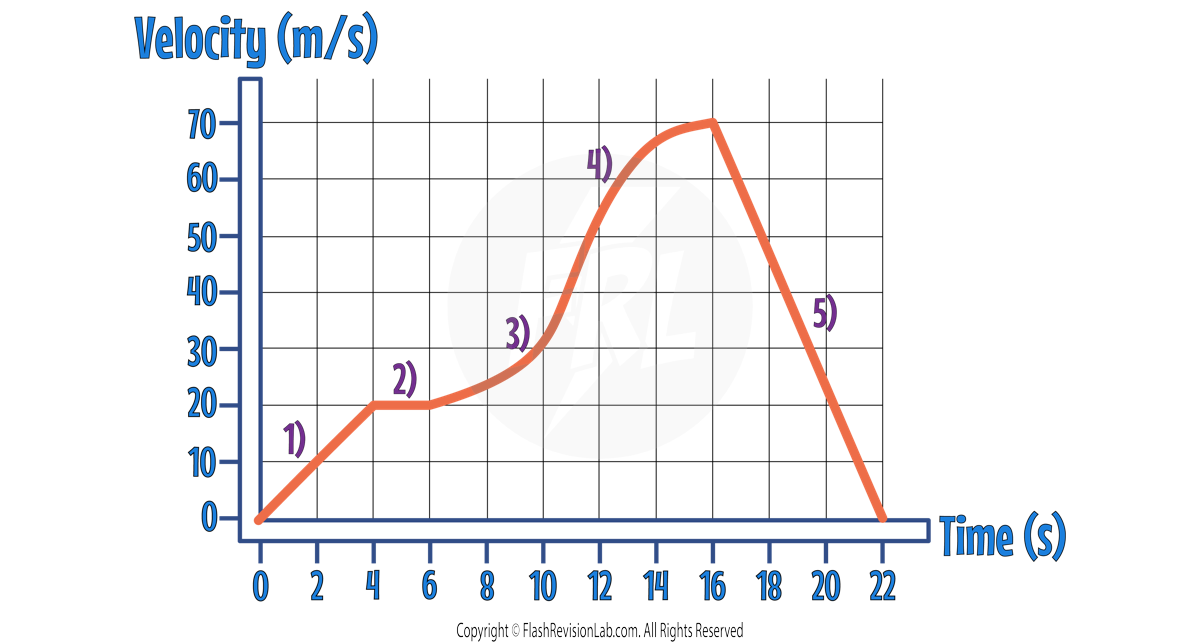
Section 1:
A STRAIGHT LINE means the object is travelling at a CONSTANT ACCELERATION. You can calculate the acceleration by using the equation:
Acceleration = Change in velocity/Time = 20/4 = 5m/s2
Section 2:
A FLAT HORIZONTAL line means the object is travelling at a CONSTANT SPEED of 20m/s for 2s.
Section 3:
The CURVED line is getting STEEPER, which means the GRADIENT is INCREASING.
This means the ACCELERATION is INCREASING.
Section 4:
The CURVED line is getting LESS STEEP, which means the GRADIENT is DECREASING.
This means the ACCELERATION is DECREASING.
Section 5:
The STRAIGHT LINE means the object is travelling at a CONSTANT ACCELERATION. You can calculate the acceleration by using the equation:
acceleration = change in velocity/time = 70/22-16 = 11.7m/s2
The fact that the line goes DOWNWARDS, tells you the VELOCITY IS DECREASING, meaning the object is DECELERATING.
This means the acceleration is NEGATIVE so the value is -11.7m/s2.
Using Tangents
CURVED LINES on velocity-time graphs mean the object has a CHANGING ACCELERATION or DECELERATION.
You can work out its ACCELERATION at a particular time by drawing a TANGENT and finding its GRADIENT.
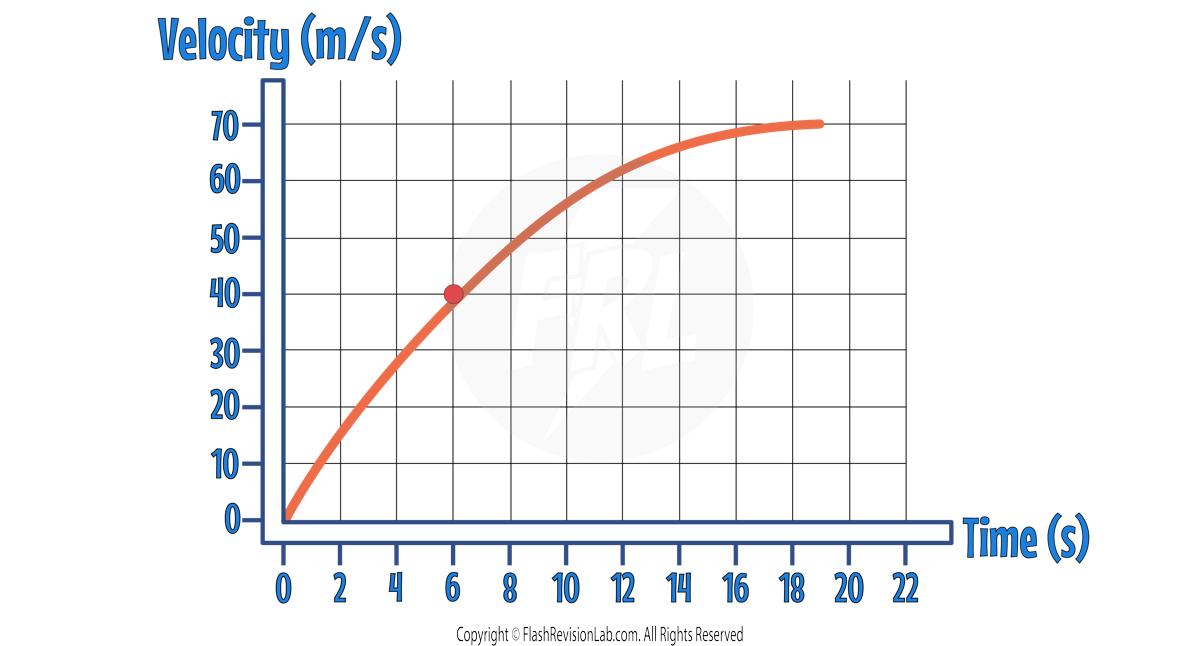
This graph shows an object DECELERATING. You can find the ACCELERATION at 6s by drawing a TANGENT at 6s and finding its GRADIENT.
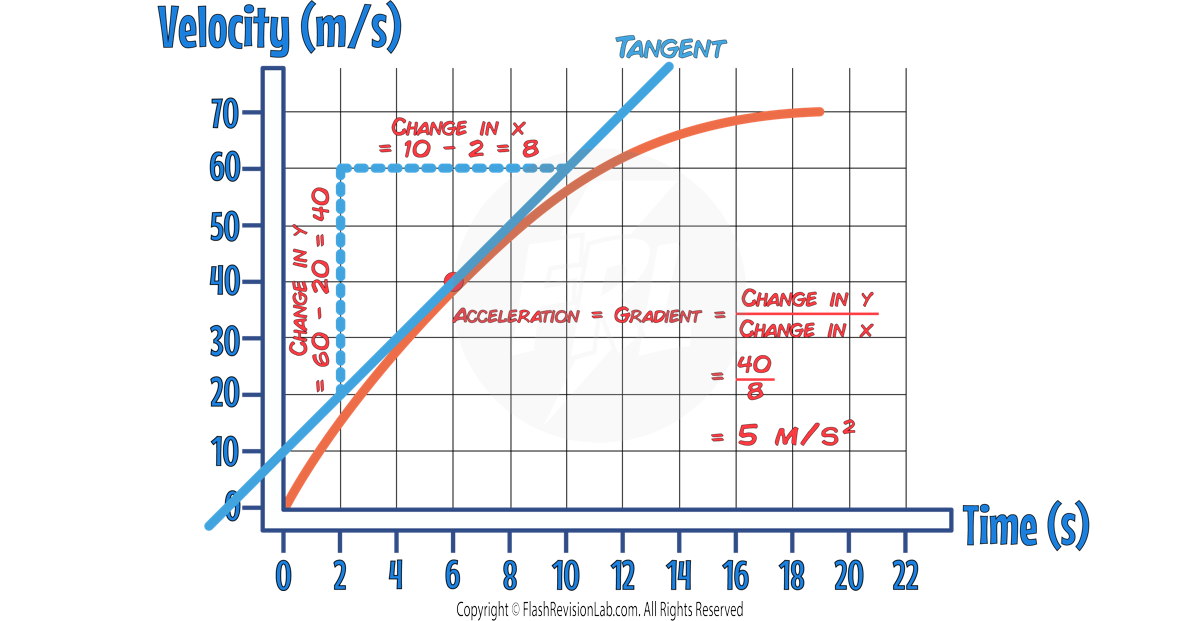
The Area Under the Graph
You can find the DISTANCE travelled by an object by working out the AREA UNDER THE GRAPH:
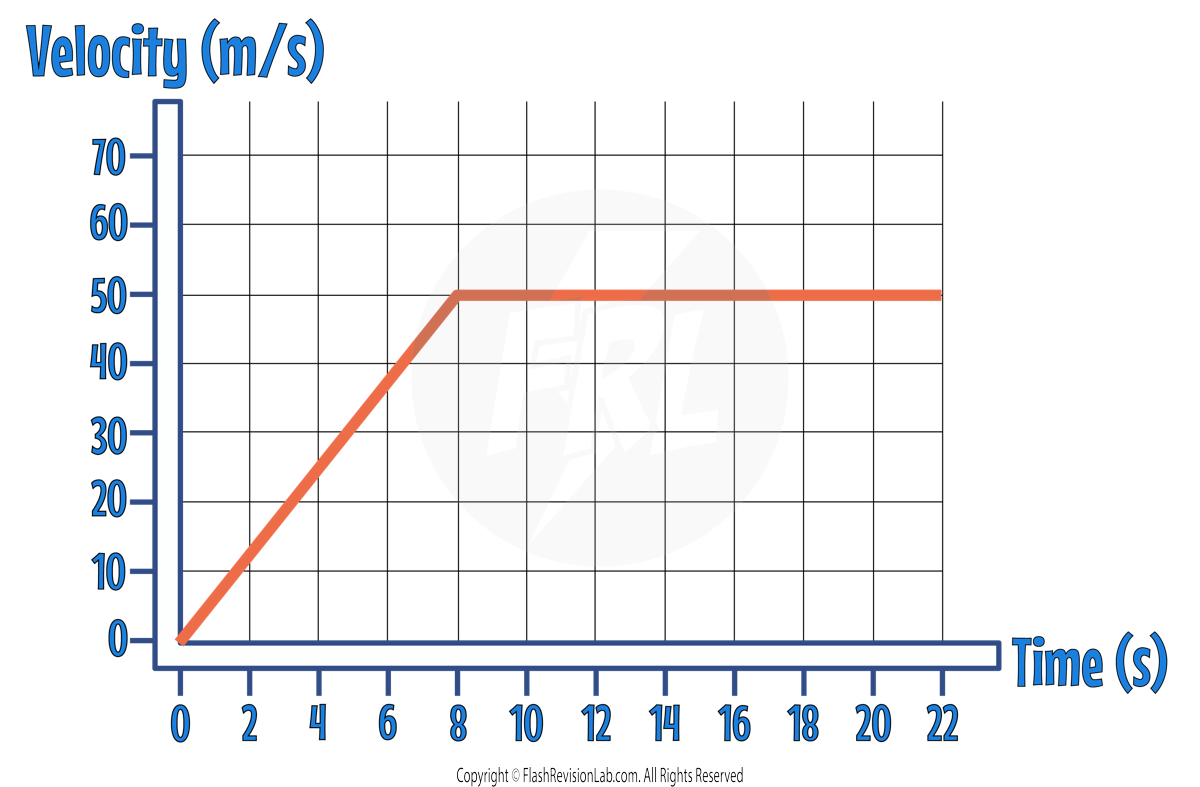
E.g. To find the distance travelled by the object after 22s, you need to find the TOTAL AREA under the graph up until 22s.
The total area can be broken down into a TRIANGLE and a RECTANGLE:
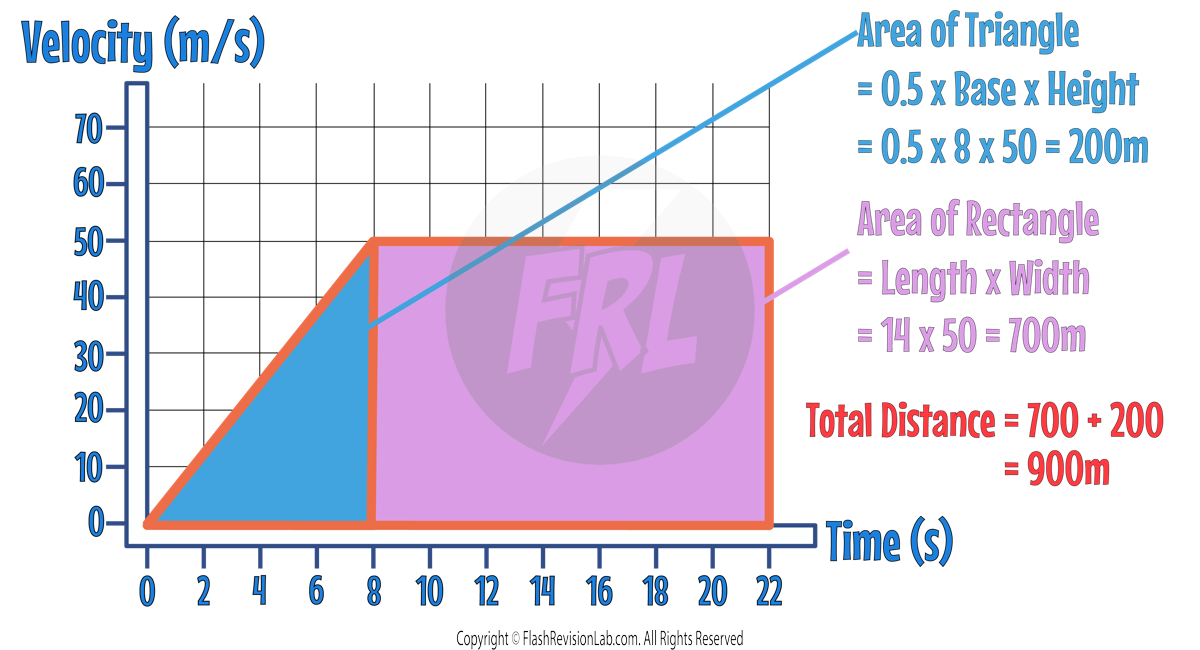
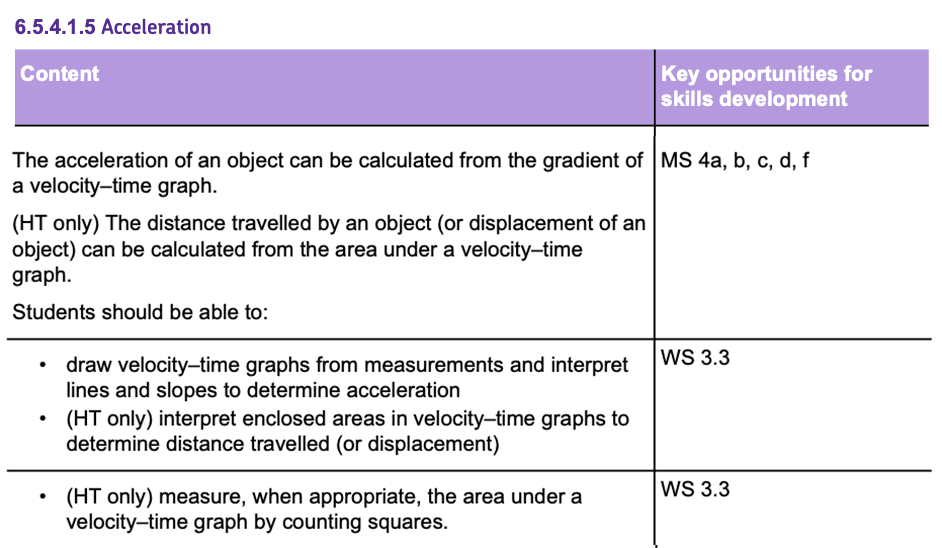
Terminal Velocity
Acceleration due to Gravity
All objects on Earth experience GRAVITATIONAL ATTRACTION towards the centre of the planet. This means when an object is in FREE FALL, it moves DOWNWARDS.
NEAR the surface of the Earth, you can assume ALL objects fall with an acceleration of 9.8m/s2.
This assumption can be made when you assume there is NO DRAG (AIR RESISTANCE), meaning there is a CONSTANT acceleration.
In real life however, when an object moves through a liquid or gas, there IS a DRAG FORCE present which affects the motion.
Drag
- DRAG is a resisting force encountered by an object moving through a FLUID (a GAS or LIQUID).
- It always acts in the OPPOSITE direction to the motion of the object.
- Examples of DRAG are AIR RESISTANCE and WATER RESISTANCE.
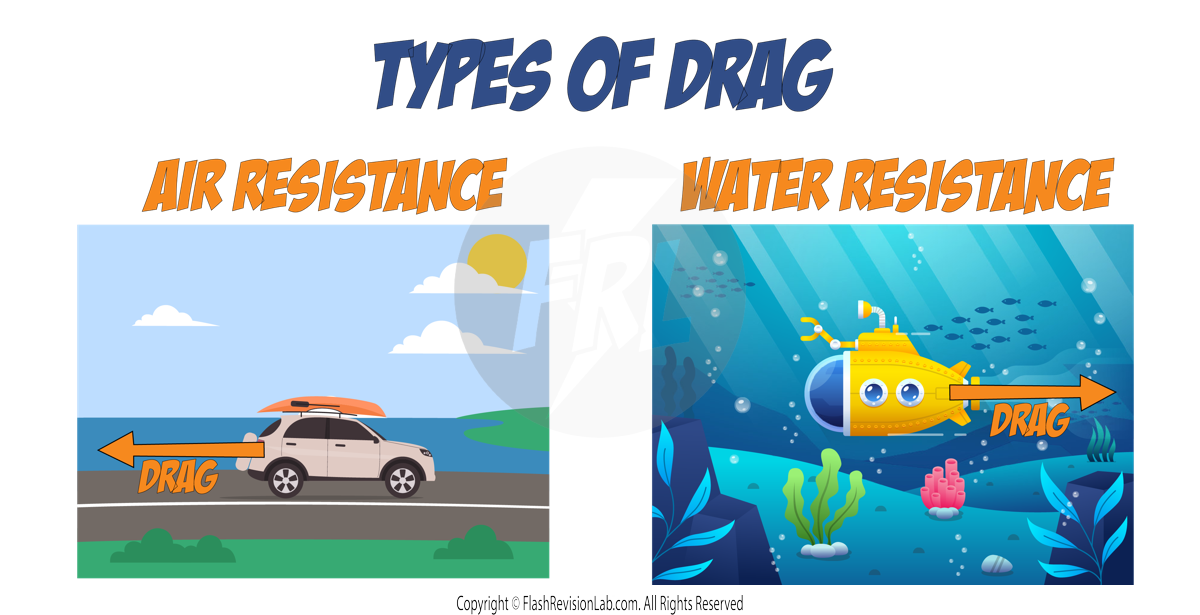
Drag is affected by the SPEED of the object and its SHAPE.
You can REDUCE the drag experienced by a moving object by:
1. DECREASING the SPEED of the object.
2. Making the object MORE STREAMLINED.

Terminal Velocity
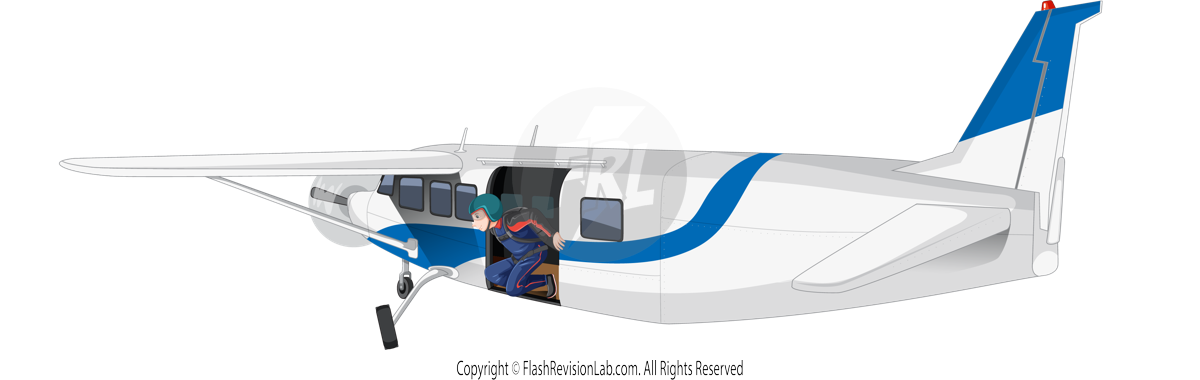
Consider a skydiver jumping out of a plane. Initially, the only force acting on him is WEIGHT due to gravity. This causes him to ACCELERATE downwards.
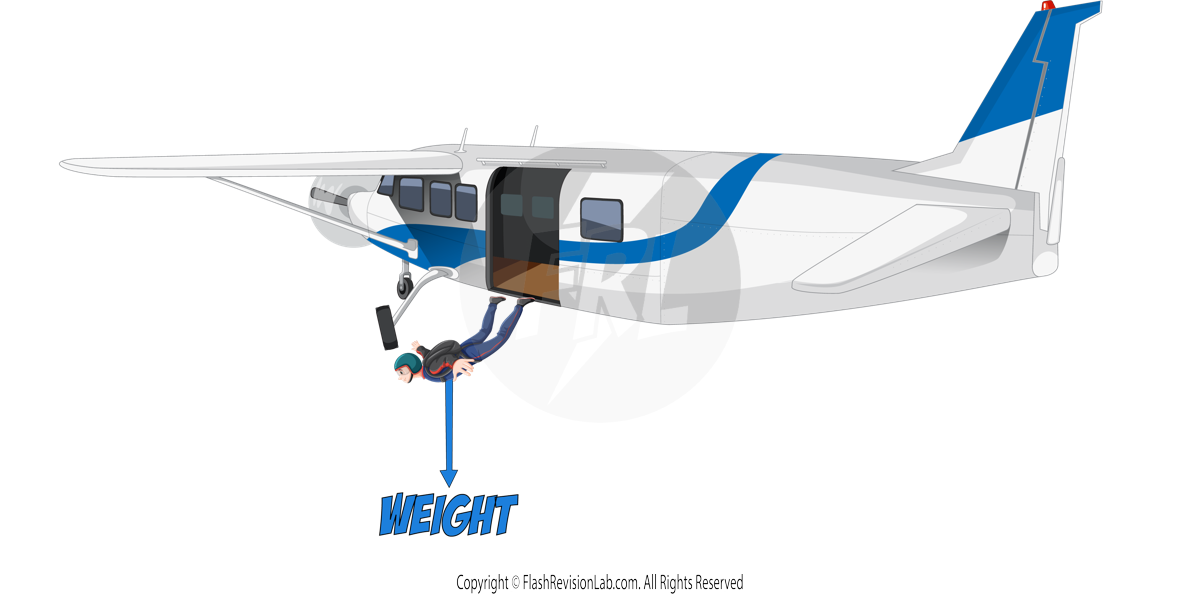
As the skydiver ACCELERATES, the speed INCREASES which means the DRAG also INCREASES.
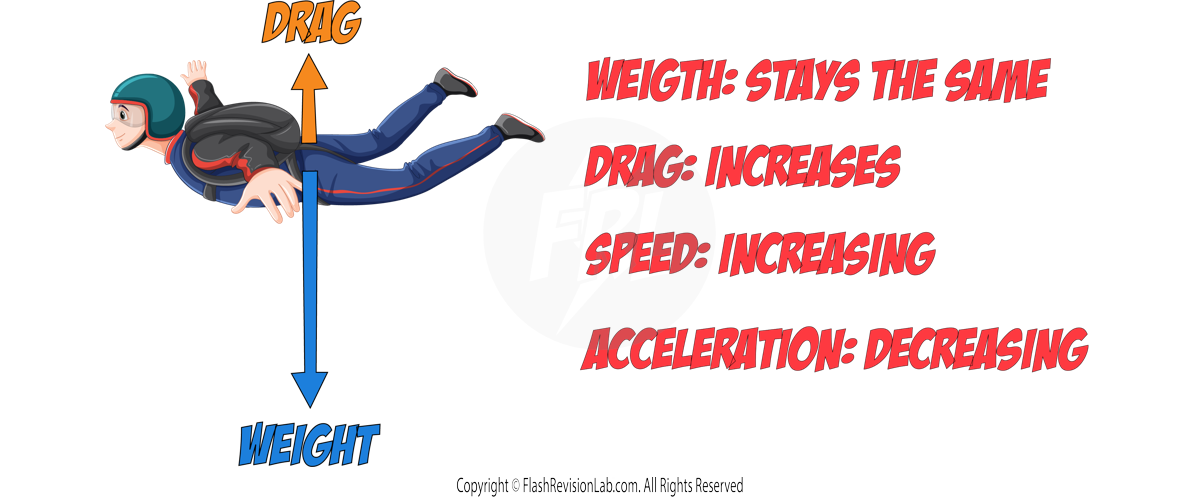
This means the RESULTANT FORCE on the skydiver DECREASES so the ACCELERATION also DECREASES.
The drag force keeps INCREASING until it becomes EQUAL to the weight.
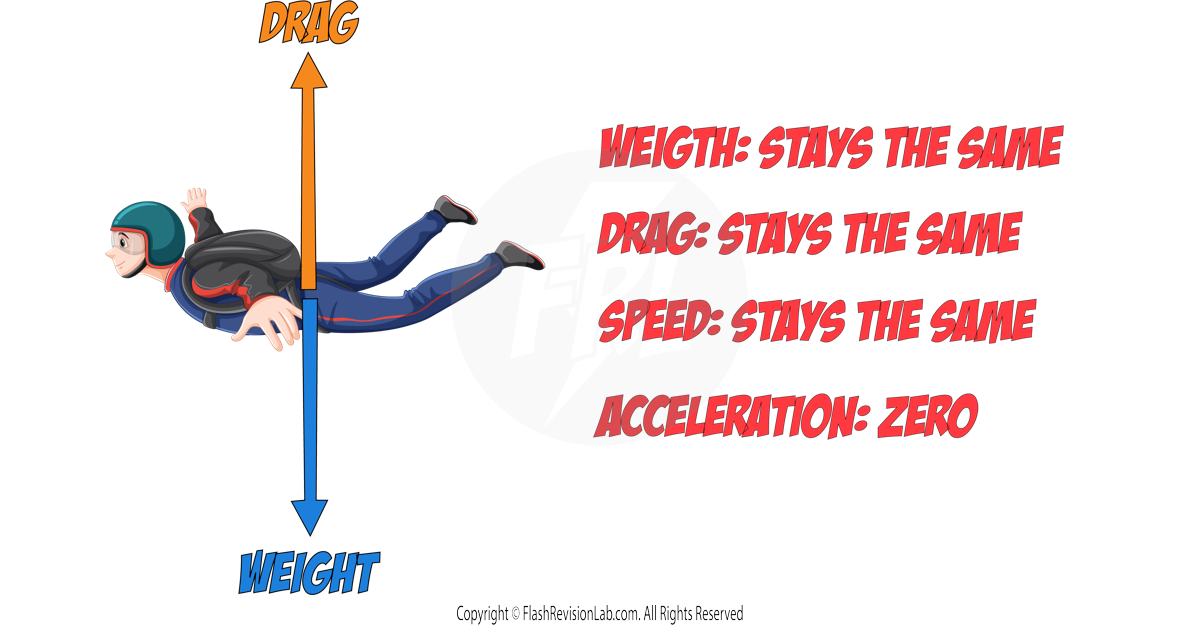
At this point, the resultant force is ZERO which means there is NO ACCELERATION and the skydiver travels at a CONSTANT SPEED (Newton’s 1st Law). This speed is known as the TERMINAL VELOCITY and is the MAXIMUM SPEED the skydiver reaches.
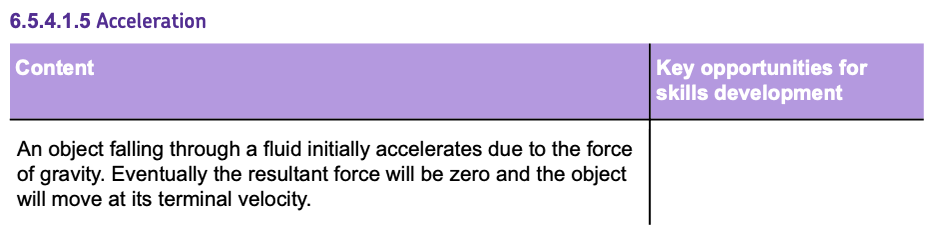
Newton's First and Second Law
Newton's First Law
NEWTON'S FIRST LAW states that if there is NO RESULTANT force on an object and:
- the object is STATIONARY, it will REMAIN STATIONARY.
- the object is MOVING, the object continues to move at the SAME VELOCITY (same speed and direction).
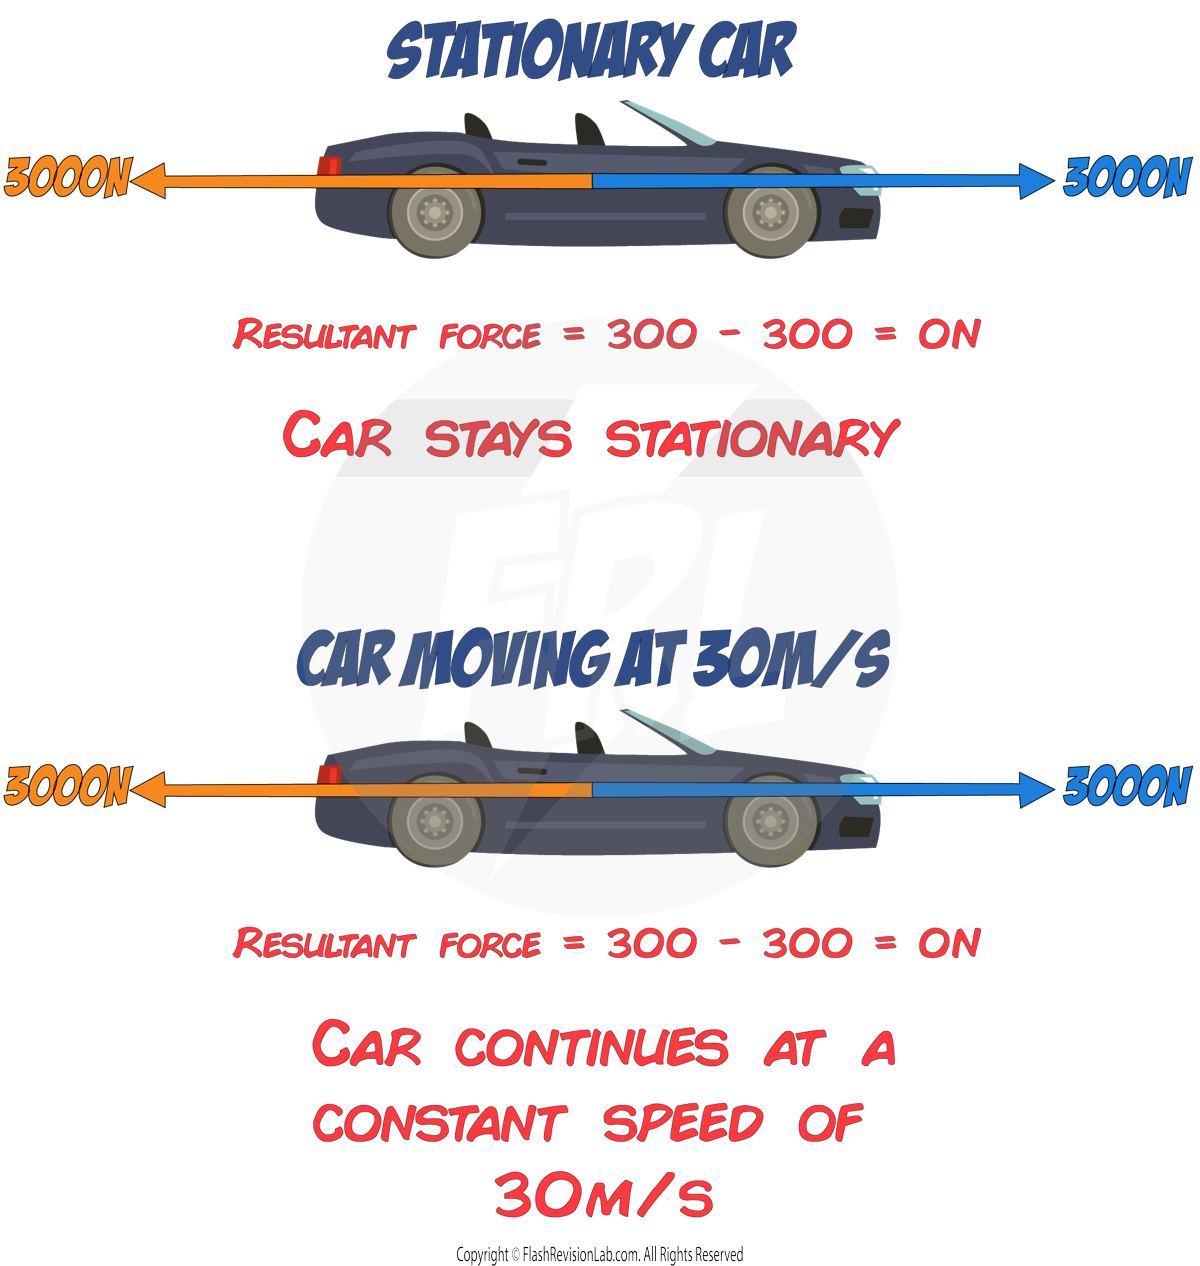
Newton’s Second Law
NEWTON'S SECOND LAW states that if there IS a RESULTANT force on an object, the object will ACCELERATE with an ACCELERATION that is DIRECTLY PROPORTIONAL to its RESULTANT FORCE and INVERSELY PROPORTIONAL to its mass.
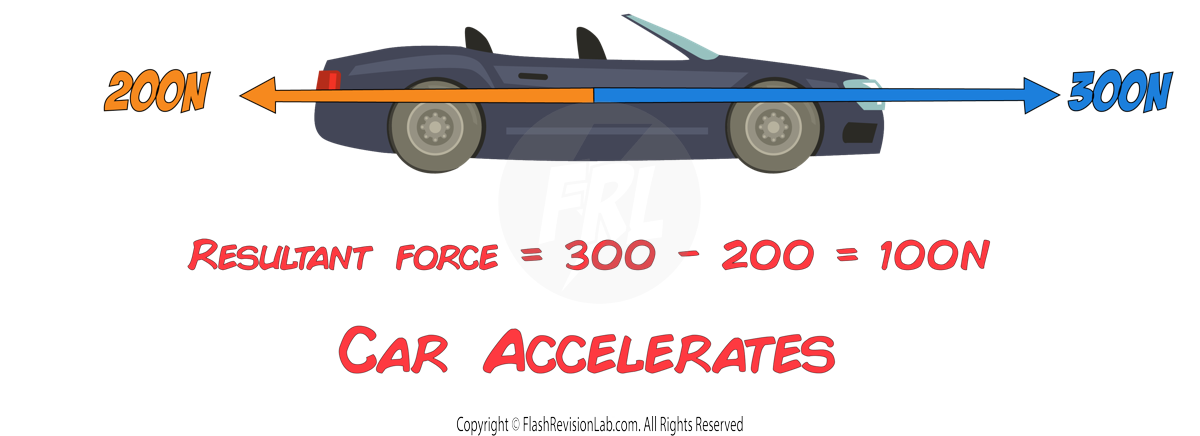
The law can be summarised by the equation:
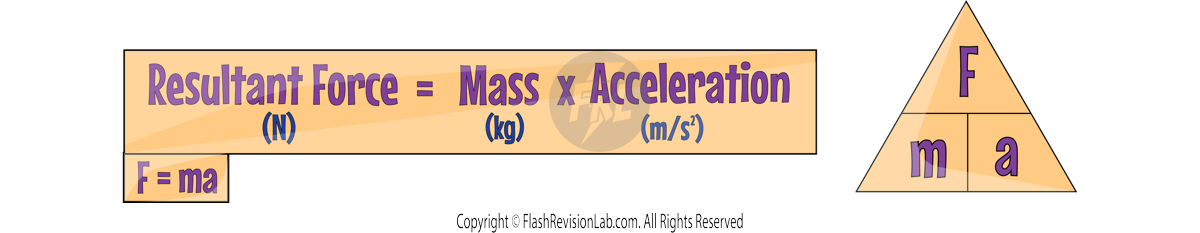
- F is the resultant force in newtons (N)
- m is the mass in kilograms (kg)
- a is the acceleration in metres per second squared (m/s²).
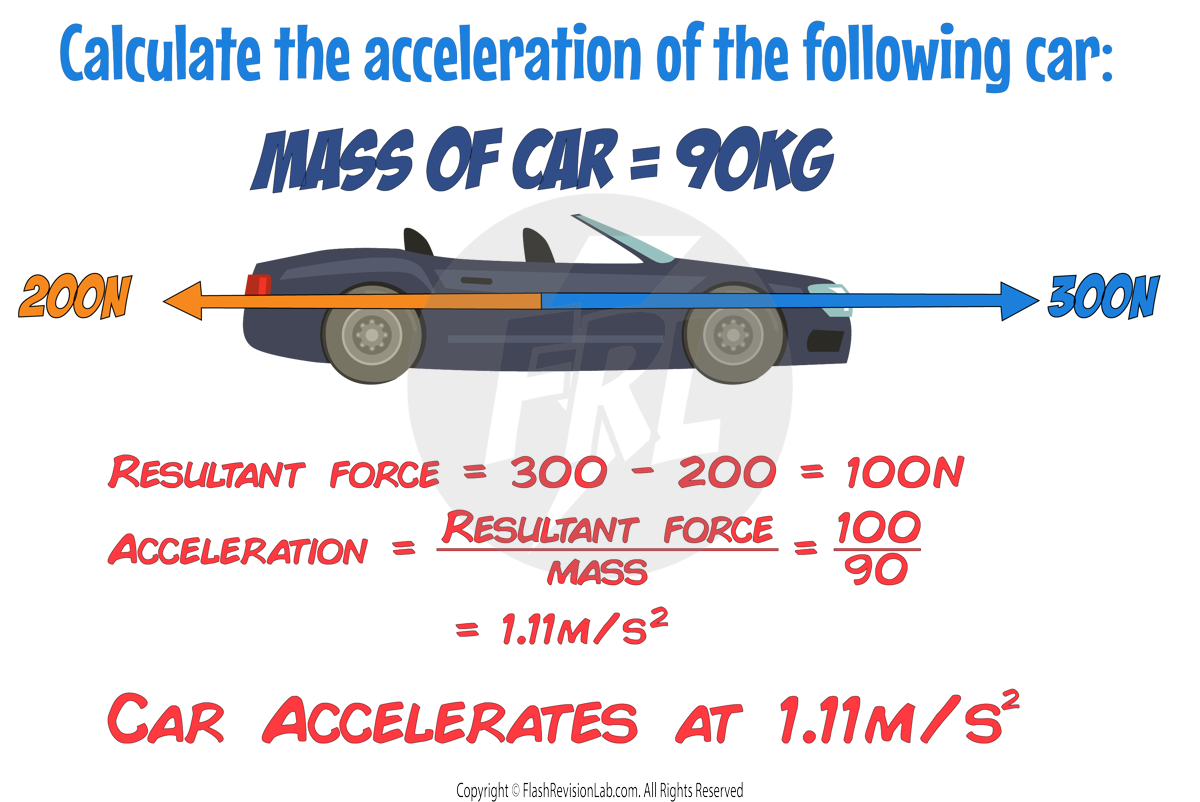
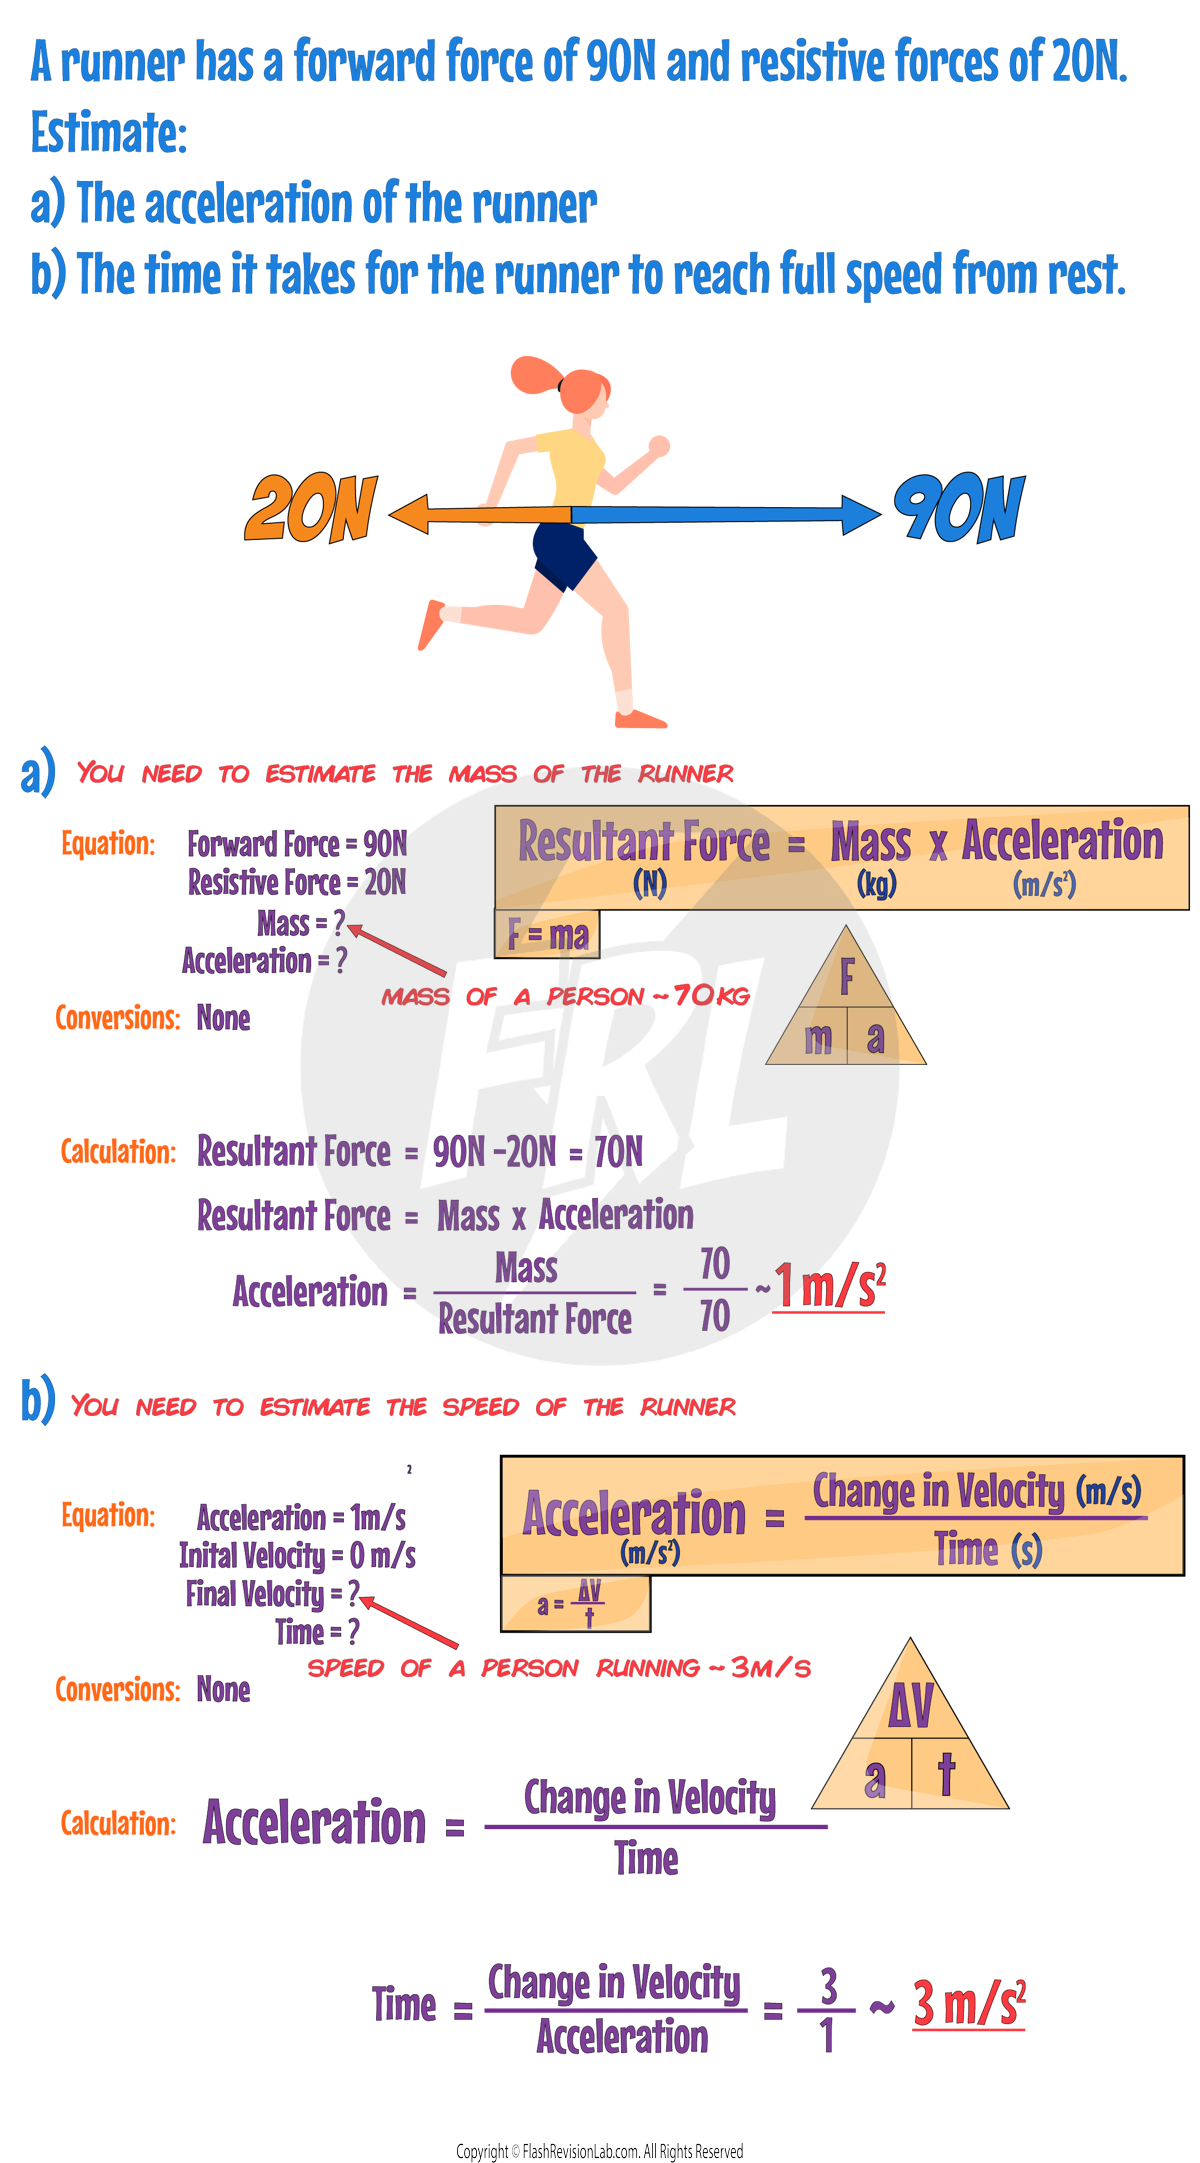
Required Practical: Force, Mass and Acceleration
This practical involves TWO experiments :
- Investigating the effect of varying the FORCE on the ACCELERATION of an object of CONSTANT MASS.
- Investigating the effect of varying the MASS of an object on the ACCELERATION produced by a CONSTANT FORCE.
Light Gates
In both experiments, a LIGHT GATE with a DATA LOGGER is used:
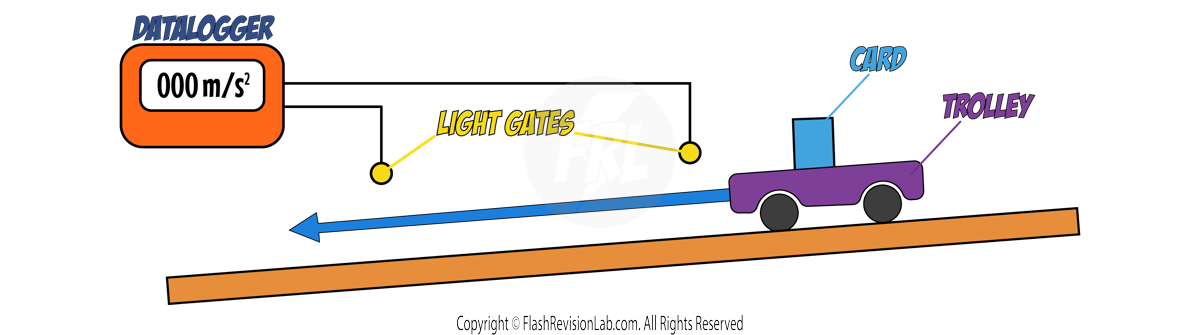
The trolley with the card interrupts the signal of the LIGHT GATE when it rolls down the ramp.
The LIGHT GATE divides the LENGTH of the CARD by the TIME the signal is interrupted for, and calculates the SPEED of the trolley.
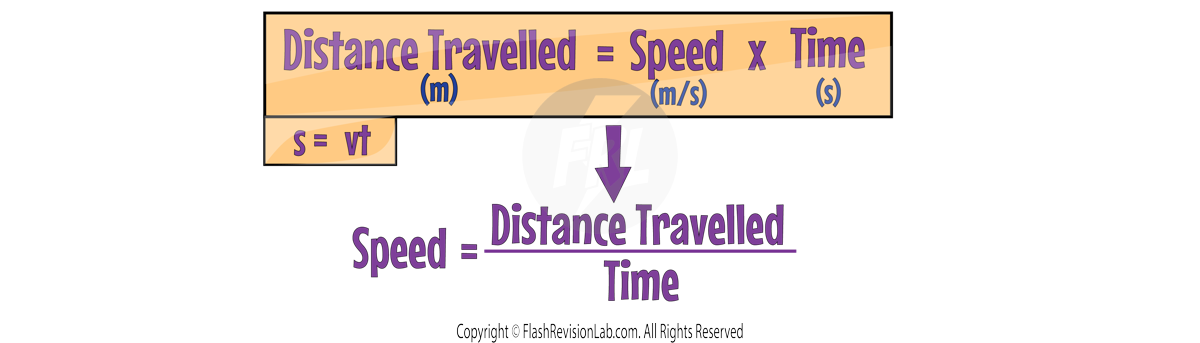
Using a LIGHT GATE and DATA LOGGER is BETTER than using a person with a STOPWATCH, as there is:
- Less ERROR due to the human's REACTION TIME
- The CALCULATION of speed can be done AUTOMATICALLY
Effect of Force on Acceleration
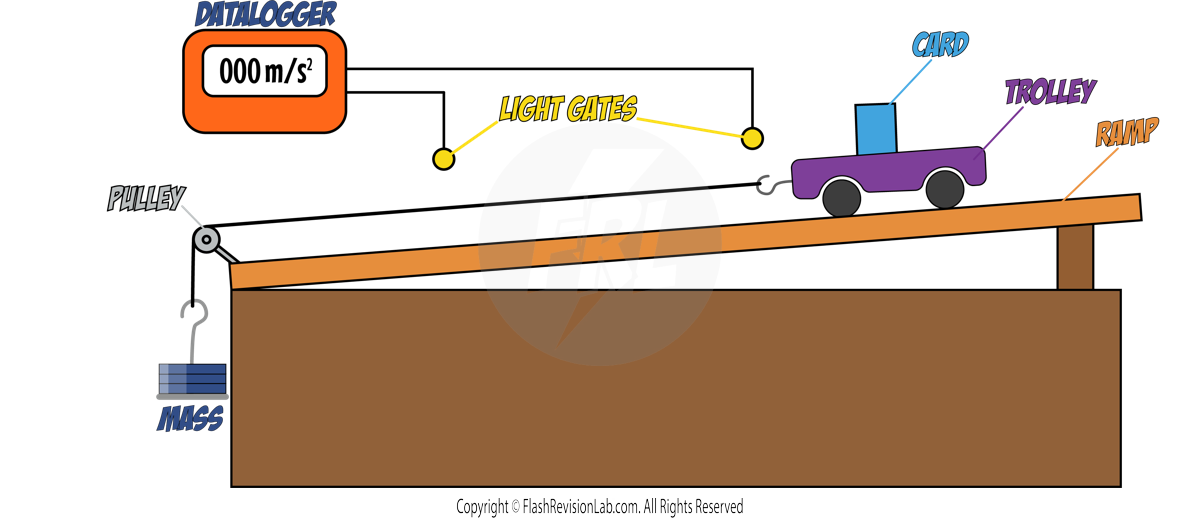
Method:
- Mark a STARTING LINE at a fixed distance from the light gate.
- Release the trolley from the top of the runway.
- As the card passes each light gate a timer turns on and off.
- The data logger calculates the velocity of the trolley at light gate A and at light gate B.
- The data logger calculates the acceleration using the two velocities and the equation:
- Repeat steps 1 to 5 using different masses HANGING off the table.
- Plot a graph of ACCELERATION against FORCE and draw a LINE OF BEST FIT.
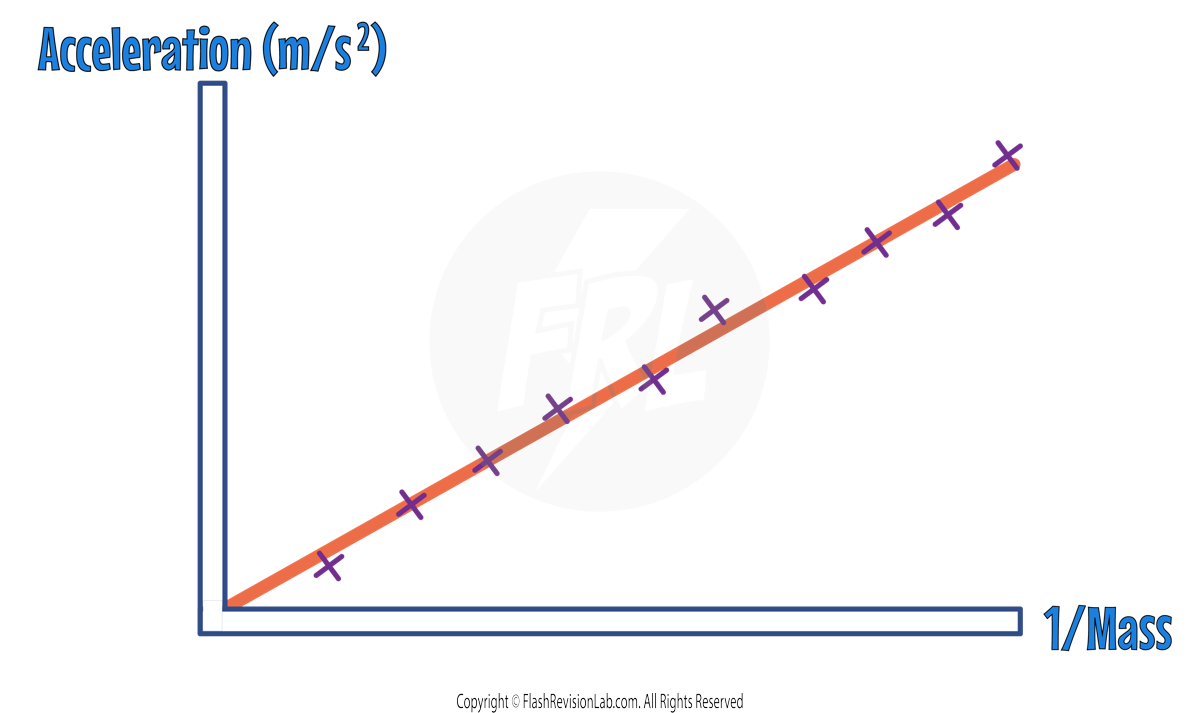
A straight line through the origin shows the FORCE and ACCELERATION are DIRECTLY PROPORTIONAL.
Effect of Mass on Acceleration
For this experiment, all the steps are the SAME however, instead of changing the mass HANGING from the table, you change the mass of the TROLLEY.
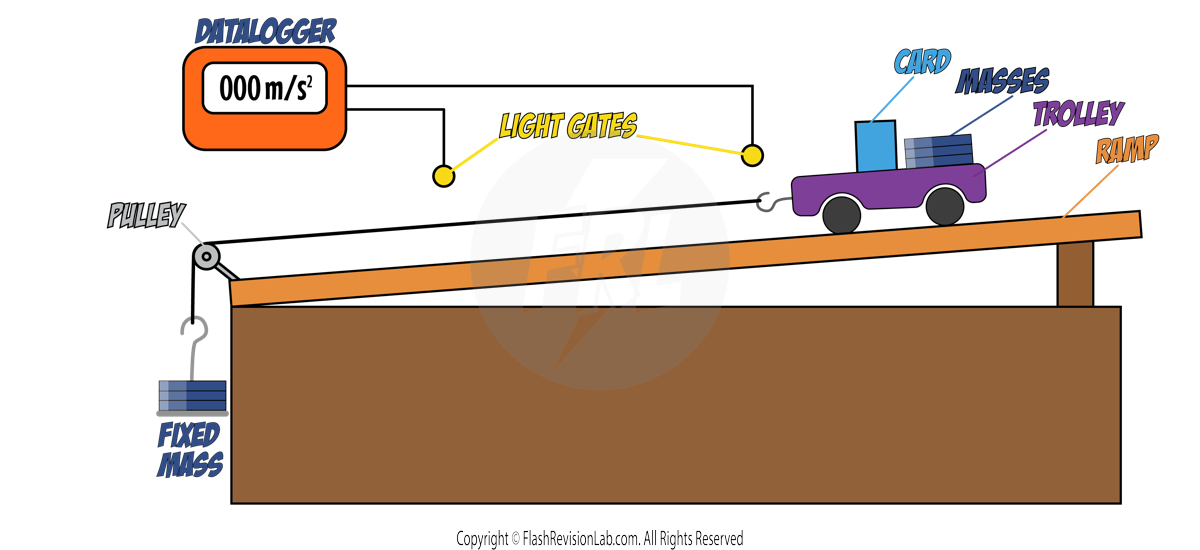
Method:
- Mark a STARTING LINE at a fixed distance from the light gate.
- Release the trolley from the top of the runway.
- As the card passes each light gate a timer turns on and off.
- The data logger calculates the velocity of the trolley at light gate A and at light gate B.
- The data logger calculates the acceleration using the two velocities.
- Repeat steps 1 to 5 using different masses added on the TROLLEY
- Plot a graph of ACCELERATION against 1/MASS and draw a LINE OF BEST FIT.
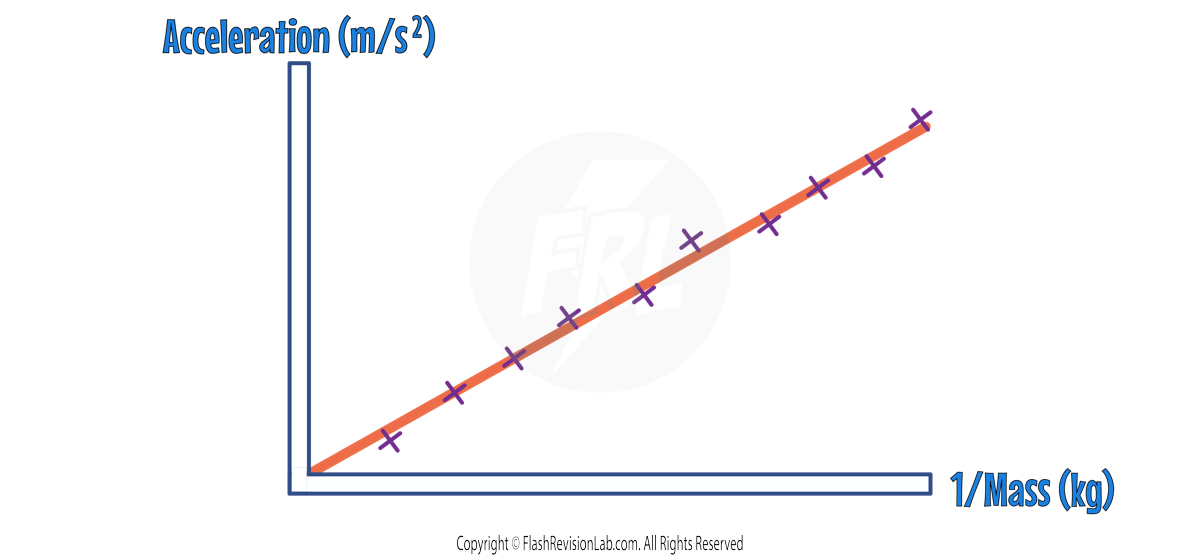
This shows that acceleration and 1/mass are directly proportional, which means ACCELERATION and MASS are INVERSELY PROPORTIONAL.
Reducing Friction
Friction between the wheels of the trolley and the ramp can cause inaccuracies in the experiment.
These frictional forces can be reduced by:
- SLOPING the ramp.
- Using a GLIDER and AIR TRACK (a track which hovers a trolley on jets of air).

Newton’s Third Law
NEWTON'S THIRD LAW states that when TWO objects interact, the forces they exert on each other are EQUAL and OPPOSITE.
In other words, if OBJECT A exerts a force on OBJECT B, OBJECT B will exert an EQUAL and OPPOSITE force back onto OBJECT A.
Example: Pushing Against a Wall
If you stand and PUSH against a wall with your hands, you are exerting a force on the wall (the action force). According to Newton's Third Law, the wall PUSHES BACK against your hands with an EQUAL and OPPOSITE force (the reaction force). Even though it might not be obvious, because the wall is sturdy and doesn't move, the forces are still present and EQUAL in magnitude.
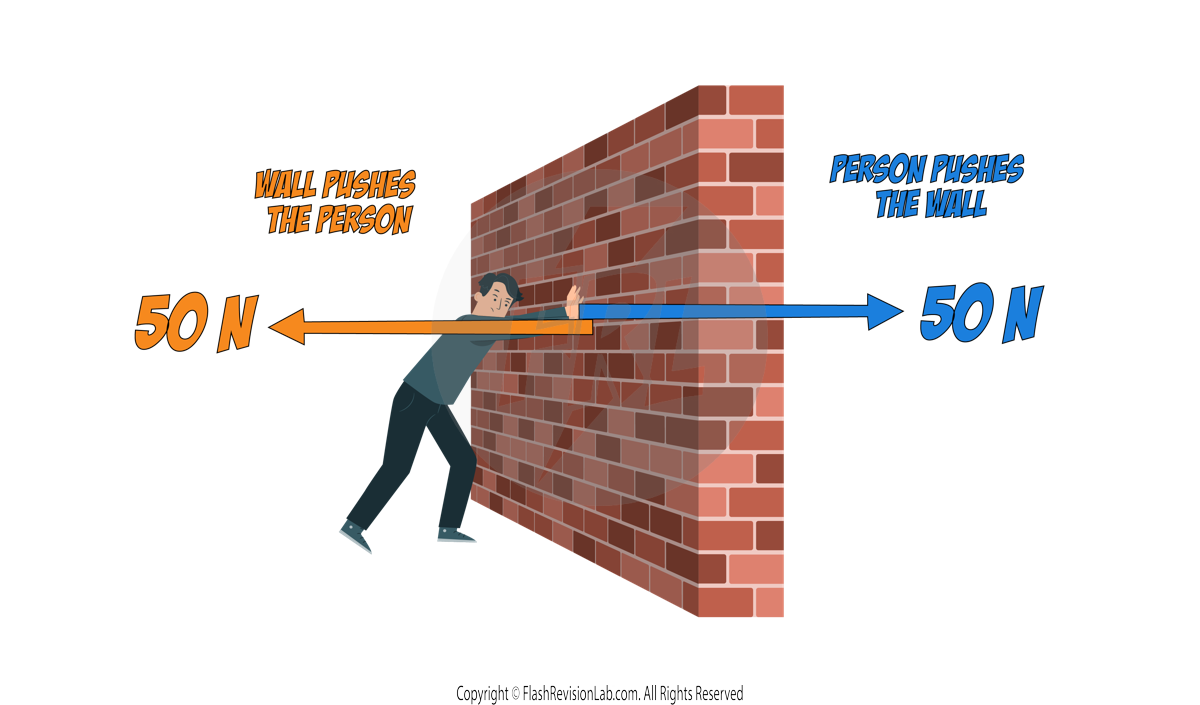
In this situation, you DON'T move, nor does the wall, but the force pairs are there, EQUAL in size and OPPOSITE in direction. The reason you and the wall don't move (assuming it's a solid wall) is because the wall is strong enough to withstand your push without breaking or moving, and your muscles are reacting to the resistance provided by the wall, allowing you to maintain your balance and not fall backward.
Example: Bowling Ball Hitting a Pin
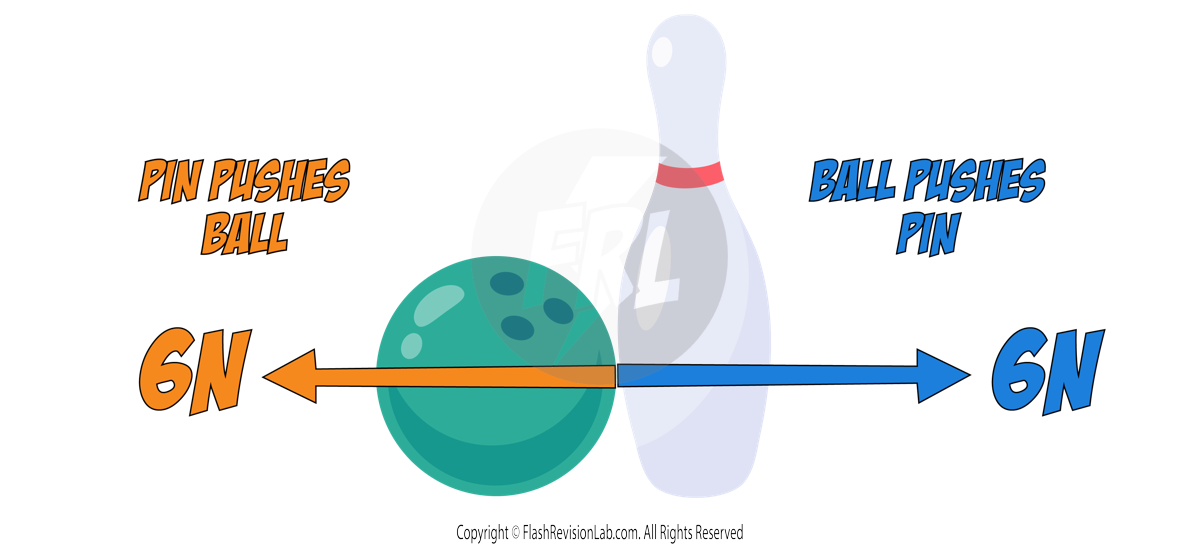
- The bowling ball exerts a FORCE on the pin in the direction of its motion (action force).
- In response, the pin exerts an EQUAL and OPPOSITE force back on the bowling ball (reaction force).
This interaction causes the pin to be knocked over (if the force is sufficient) while the bowling ball experiences a small change in velocity due to the force exerted by the pin. The effect on the bowling ball is less noticeable due to its much greater mass compared to the pin.
INERTIA
INERTIA is an object's natural tendency to keep doing what it's currently doing — to stay still if at rest, or keep moving if in motion, unless an external force acts on it.
It is not just a measure of how much something weighs (that's mass), but how much it resists speeding up or slowing down.
INERTIAL MASS is a measure of how difficult it is to CHANGE the VELOCITY of an object. It tells us how much force would be required to give an object a certain acceleration. It's the ratio of FORCE OVER ACCELERATION.

A larger inertial mass means an object will NOT speed up or slow down as easily — it will RESIST changes in motion more than an object with a smaller inertial mass.
This is why a bowling ball is harder to start rolling, or stop, compared to a basketball.
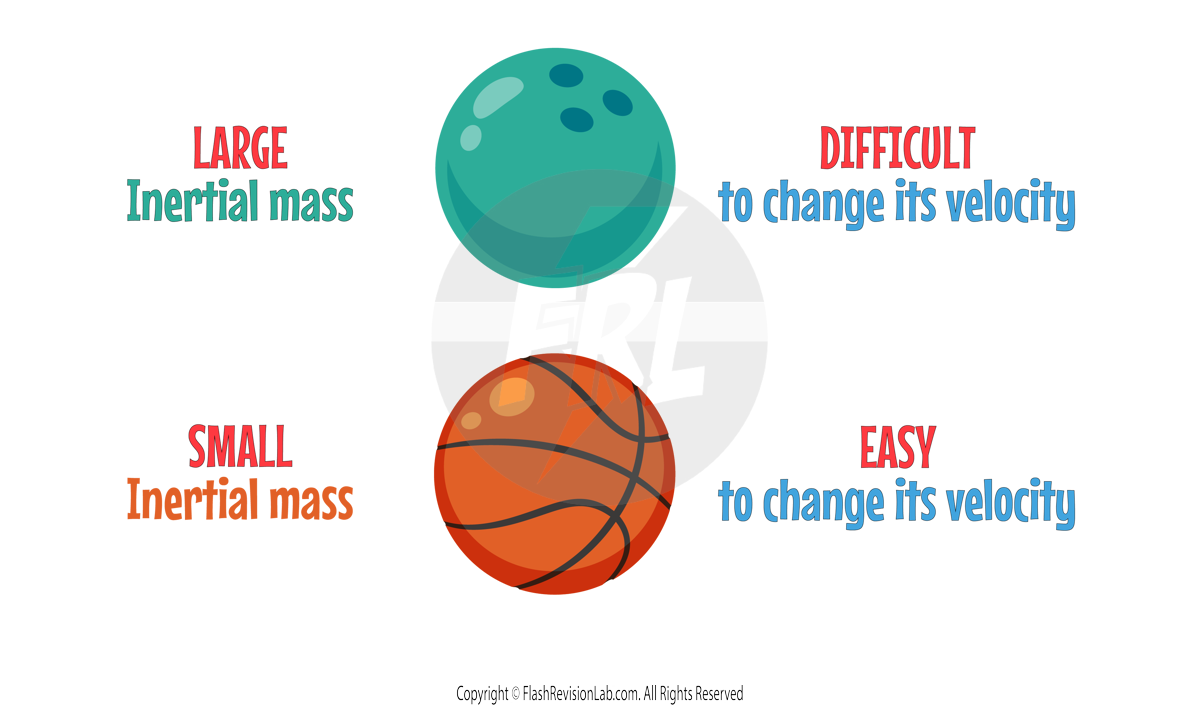
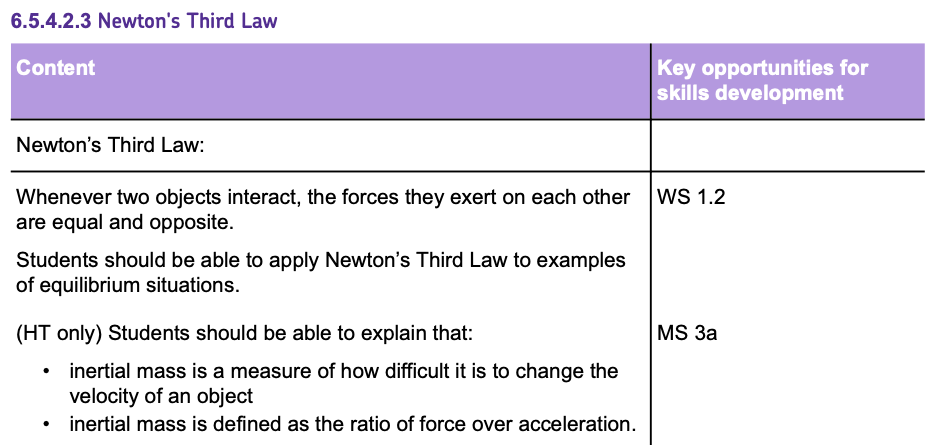
Stopping Distance
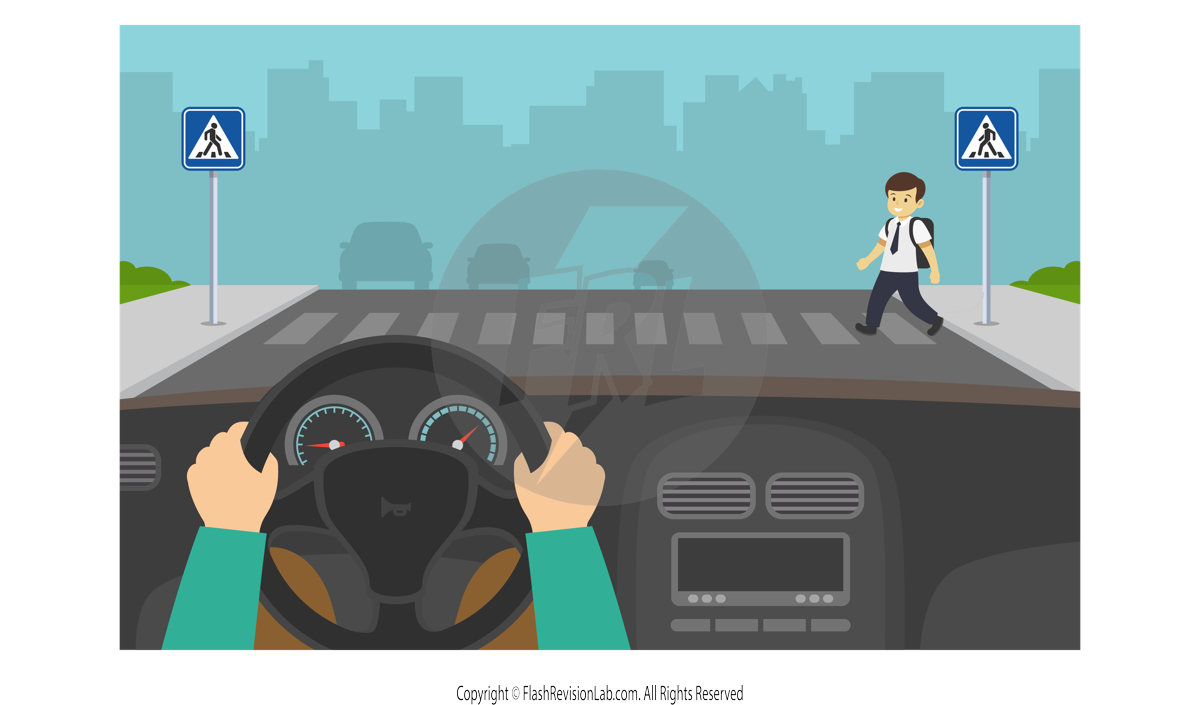
When a person drives a car and sees a hazard, they need to apply brakes to stop as fast as they can.
The DISTANCE they travel from the moment they PRESS THE BRAKES to the moment they STOP is known as the STOPPING DISTANCE.
The STOPPING DISTANCE of a vehicle is the SUM of TWO distances:
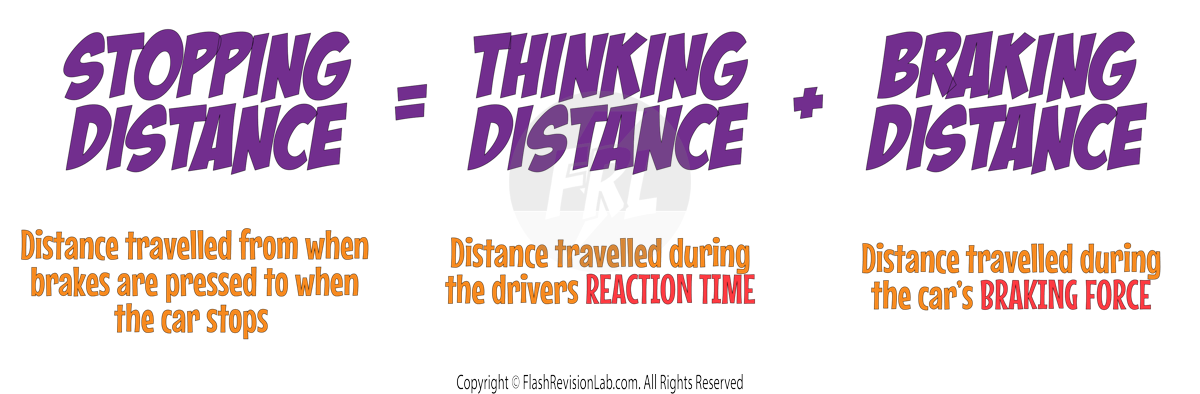
1. THINKING DISTANCE - This is the DISTANCE the vehicle travels during the DRIVER'S REACTION TIME, between the time the driver sees a hazard and the time they start to brake.
2. BRAKING DISTANCE - This is the DISTANCE the vehicle travels while the BRAKES ARE APPLIED.
For a given braking force the GREATER the SPEED of the vehicle, the GREATER the STOPPING DISTANCE.
This is because increasing the SPEED of the car increases BOTH the thinking distance AND the braking distance.
Thinking Distance
The THINKING DISTANCE of a car is based on the REACTION TIMES of the driver.
The longer the driver’s reaction time, the LONGER the THINKING DISTANCE.
The average human reaction time is around 0.2s – 0.9s.
There are a few factors that can INCREASE a person’s reaction time:
- ALCOHOL INTAKE
- DRUG USE
- TIREDNESS
- DISTRACTIONS
You can measure a person’s reaction time by using tests on the computer:

These tests often involve responding to a visual change, like a colour shift on the screen, by pressing a key or clicking the mouse as fast as possible.
Braking Distance
The braking distance of a vehicle is the distance it travels when the brakes are applied to bring it to a complete stop. Several factors can affect a vehicle's braking distance, which are:
- ROAD CONDITIONS
- Adverse road conditions such as WET or ICY roads can reduce the grip between the tyres and the road surface, which INCREASES the braking distance.
- VEHICLE CONDITIONS
- Poor vehicle condition, particularly relating to the BRAKES or TYRES, can significantly increase braking distance. WORN BRAKE PADS or DEFLATED TYRES will reduce the effectiveness of the braking system.
How Braking Works
When a force is applied to the brakes of a vehicle, WORK is DONE by the FRICTIONAL force between the brakes and the wheel.
This REDUCES the KINETIC ENERGY of the vehicle as it is TRANSFERRED to the THERMAL ENERGY stores of the brakes.
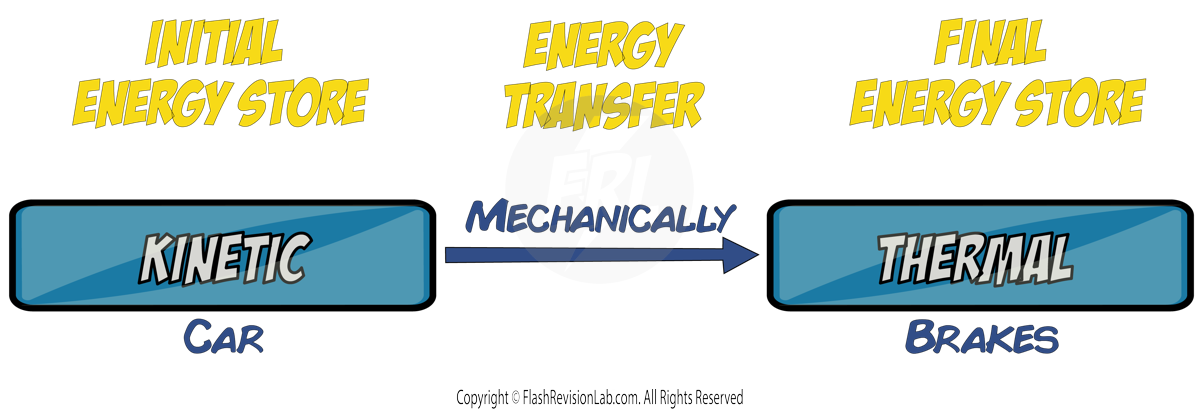
This causes the TEMPERATURE of the brakes to INCREASE.
This transfer of energy causes the car to DECELERATE (slow down).
The GREATER the speed of a vehicle, the GREATER the braking force required to bring the vehicle to a STOP for a given distance.
Since the BRAKING FORCE would need to be LARGER, the DECELERATION of the vehicle will be LARGE as well.
This is because the RESULTANT force of the car will be GREATER, leading to a GREATER DECELERATION (Newton's Second Law).
LARGE DECELERATIONS are dangerous as they could lead to the brakes OVERHEATING and a LOSS OF CONTROL of the vehicle.
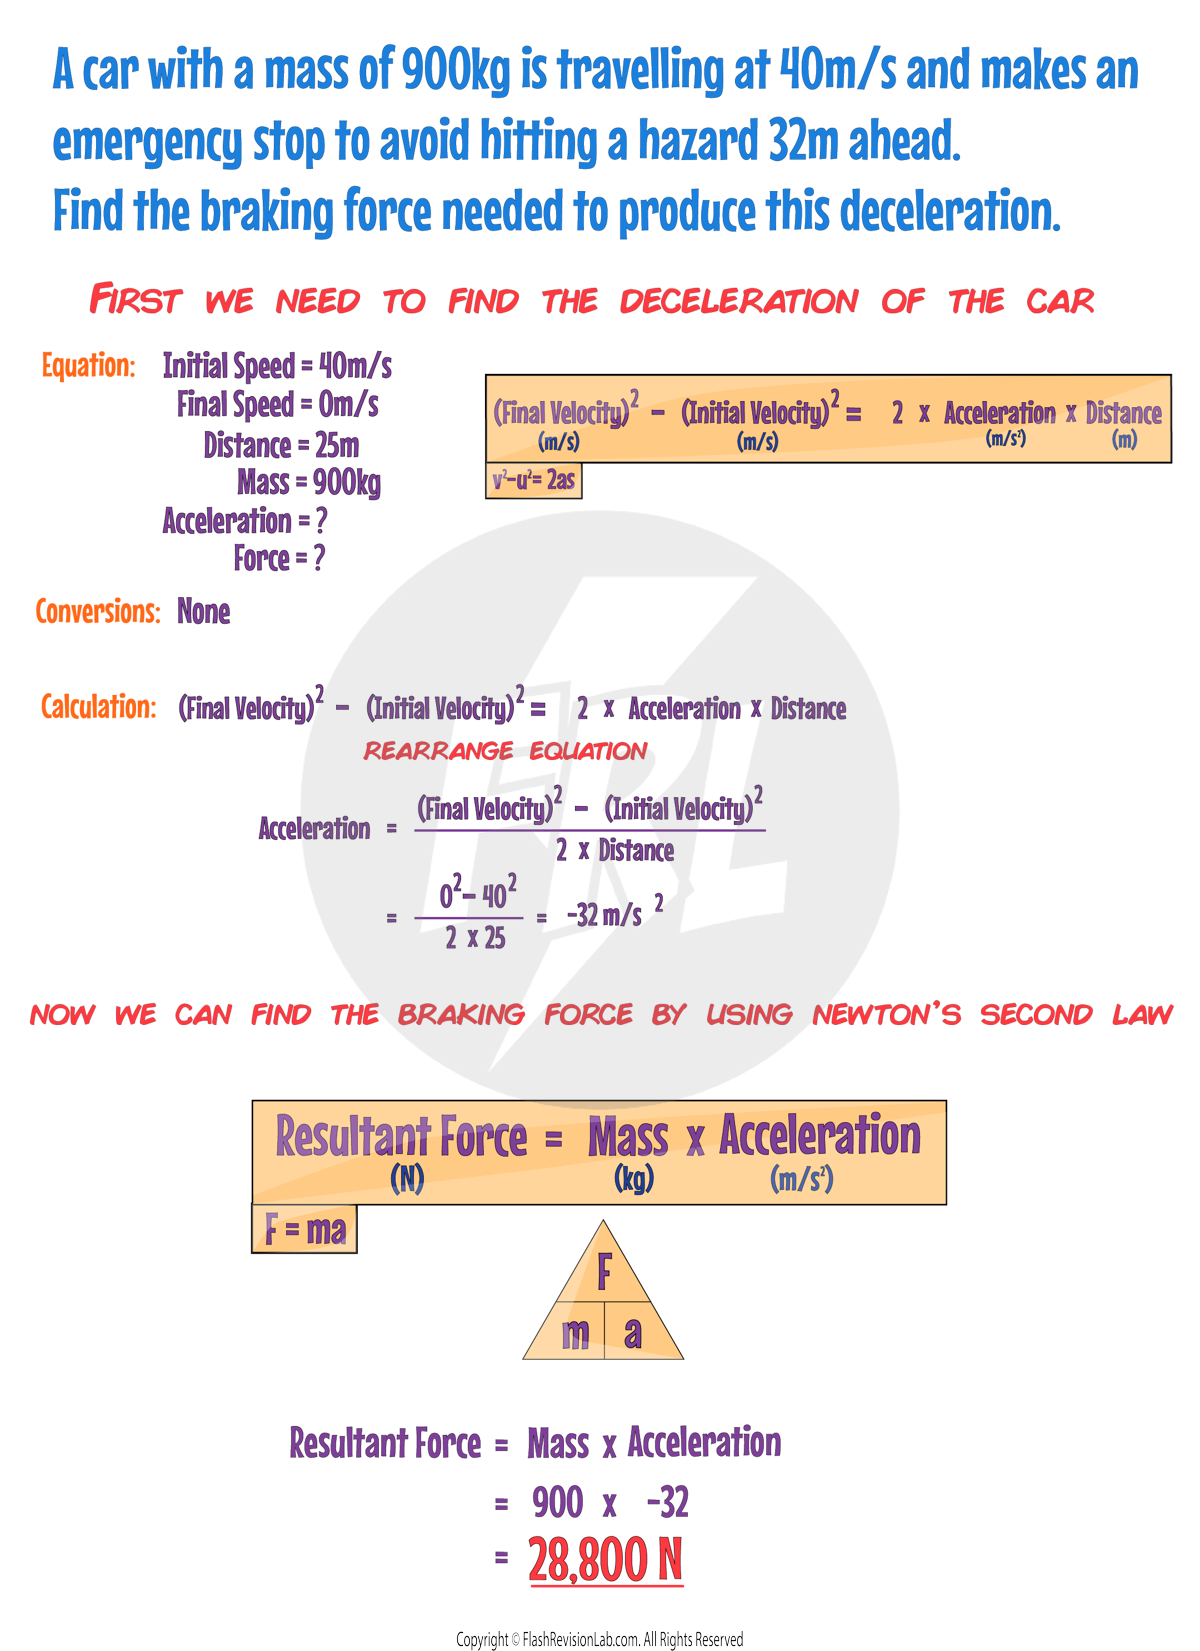
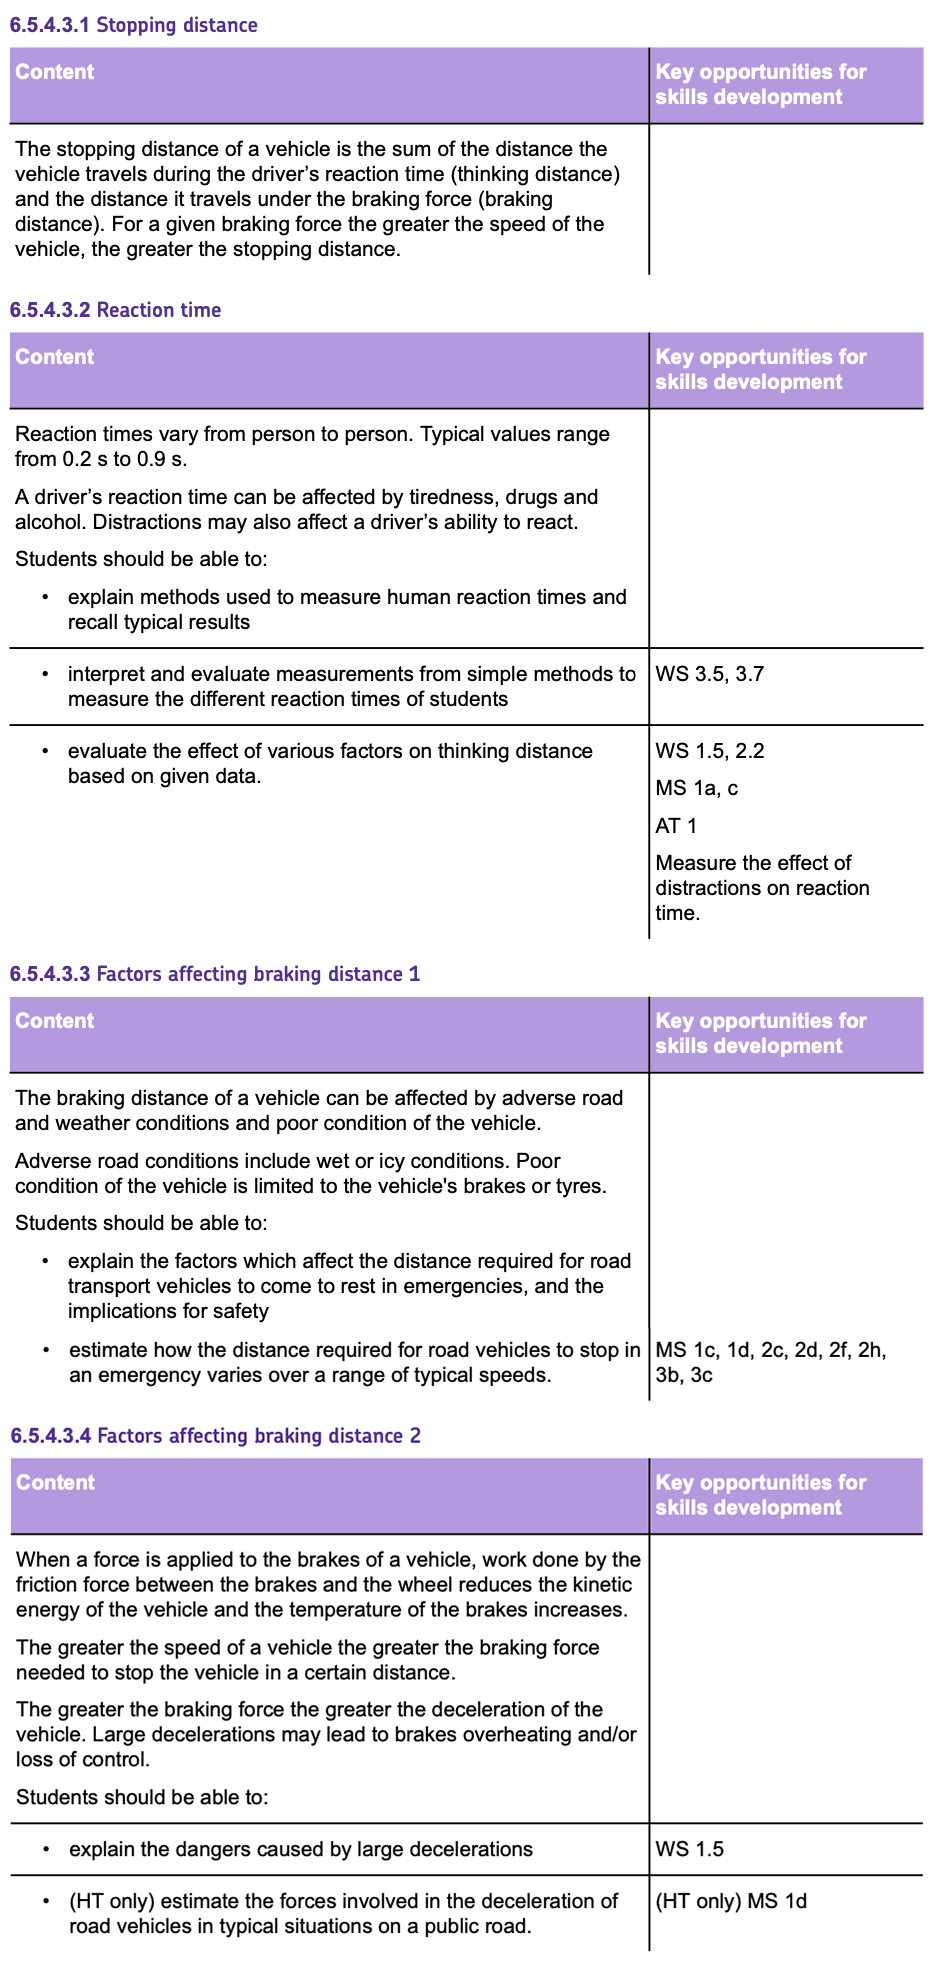
Momentum
MOMENTUM is a quality that every MOVING object possesses.
It depends on the MASS of the object and its VELOCITY.
You calculate MOMENTUM by using the equation:
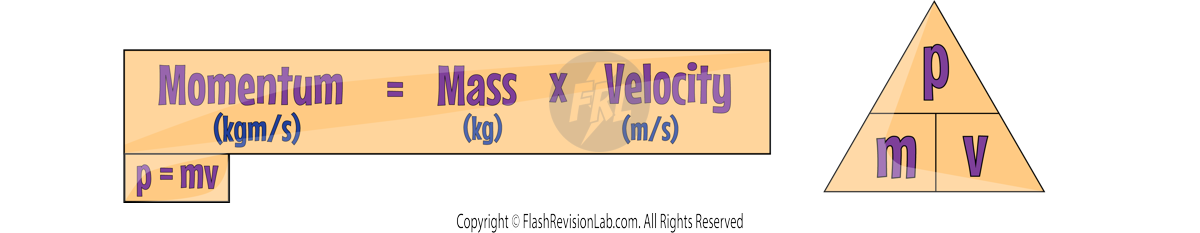
Where:
- p is the momentum, which is measured in Kilogram meters per second (kg m/s).
- m is the mass of the object in Kilograms (kg).
- v is the velocity of the object in Metres per second (m/s).
Conservation of Momentum
The CONSERVATION OF MOMENTUM states that in a CLOSED SYSTEM, the total momentum BEFORE an event is equal to the total momentum AFTER the event.

As an example, lets look at a pool cue ball hitting another ball:
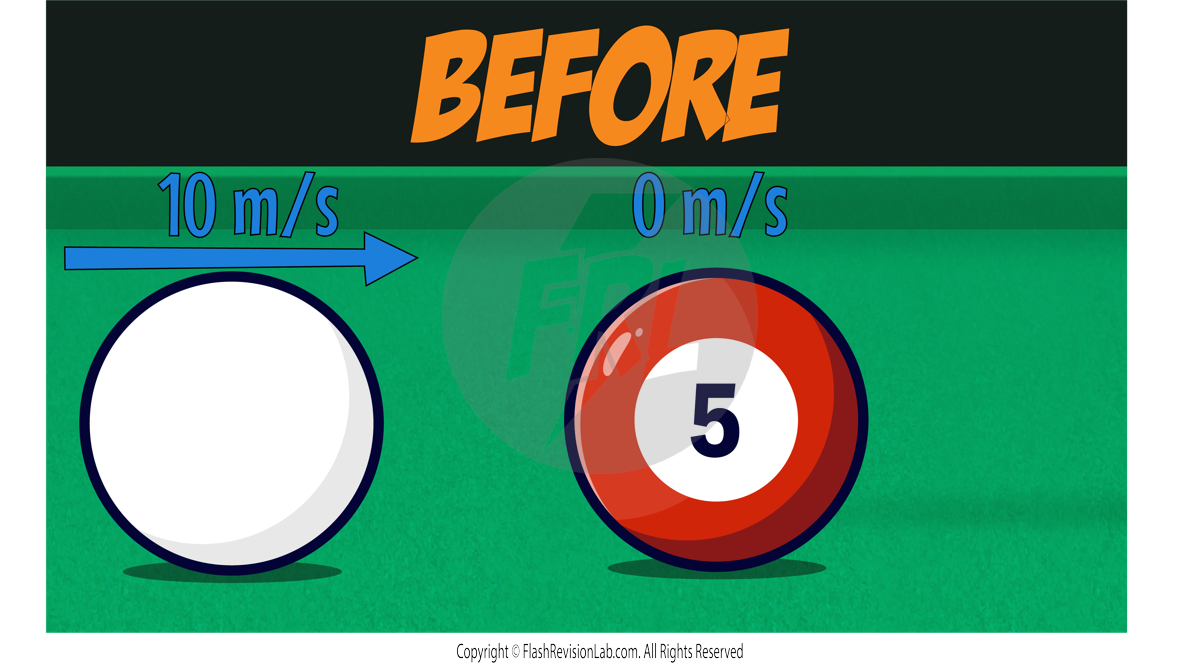
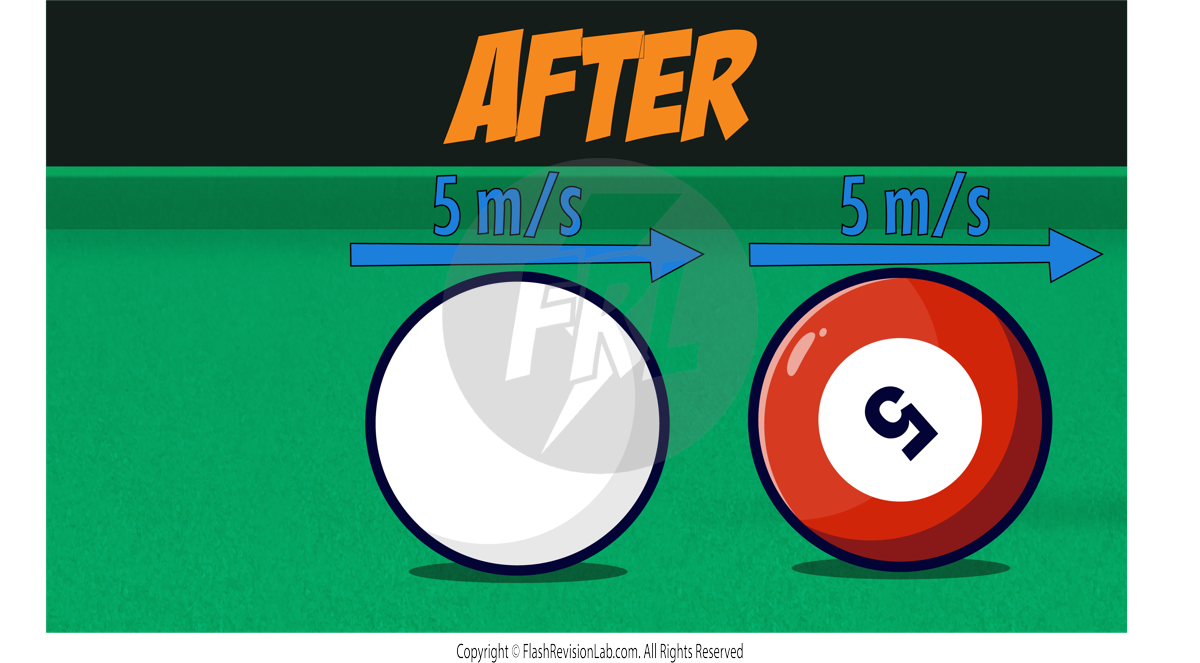
If we assume both balls are 1kg, we can show that TOTAL MOMENTUM is CONSERVED:
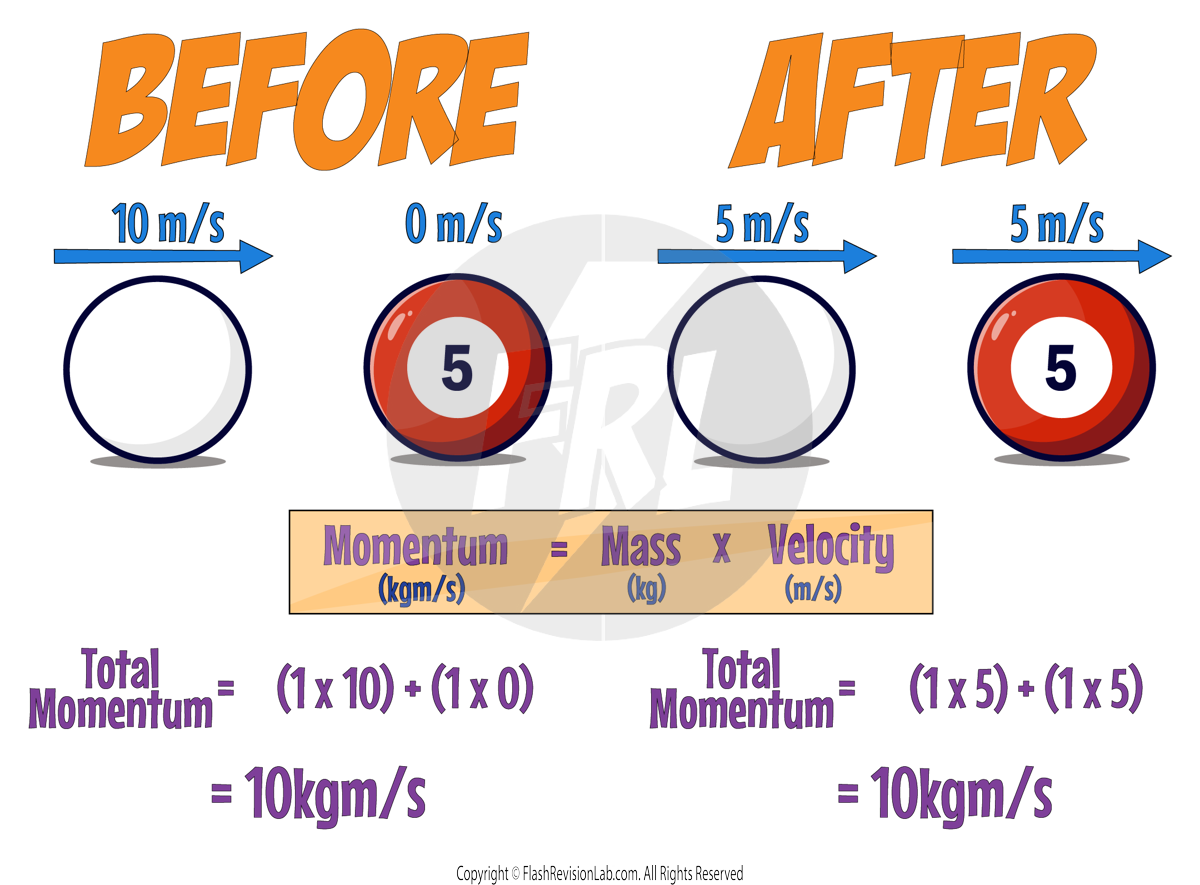
Here the white ball’s momentum DECREASES and the red ball’s momentum INCREASES.
This means the SPEED of the white ball DECREASES and the SPEED of the red ball INCREASES.
Sometimes, the collision causes the objects to JOIN TOGETHER after they come into contact with each other. In these examples, you treat the two objects as ONE and ADD their masses:
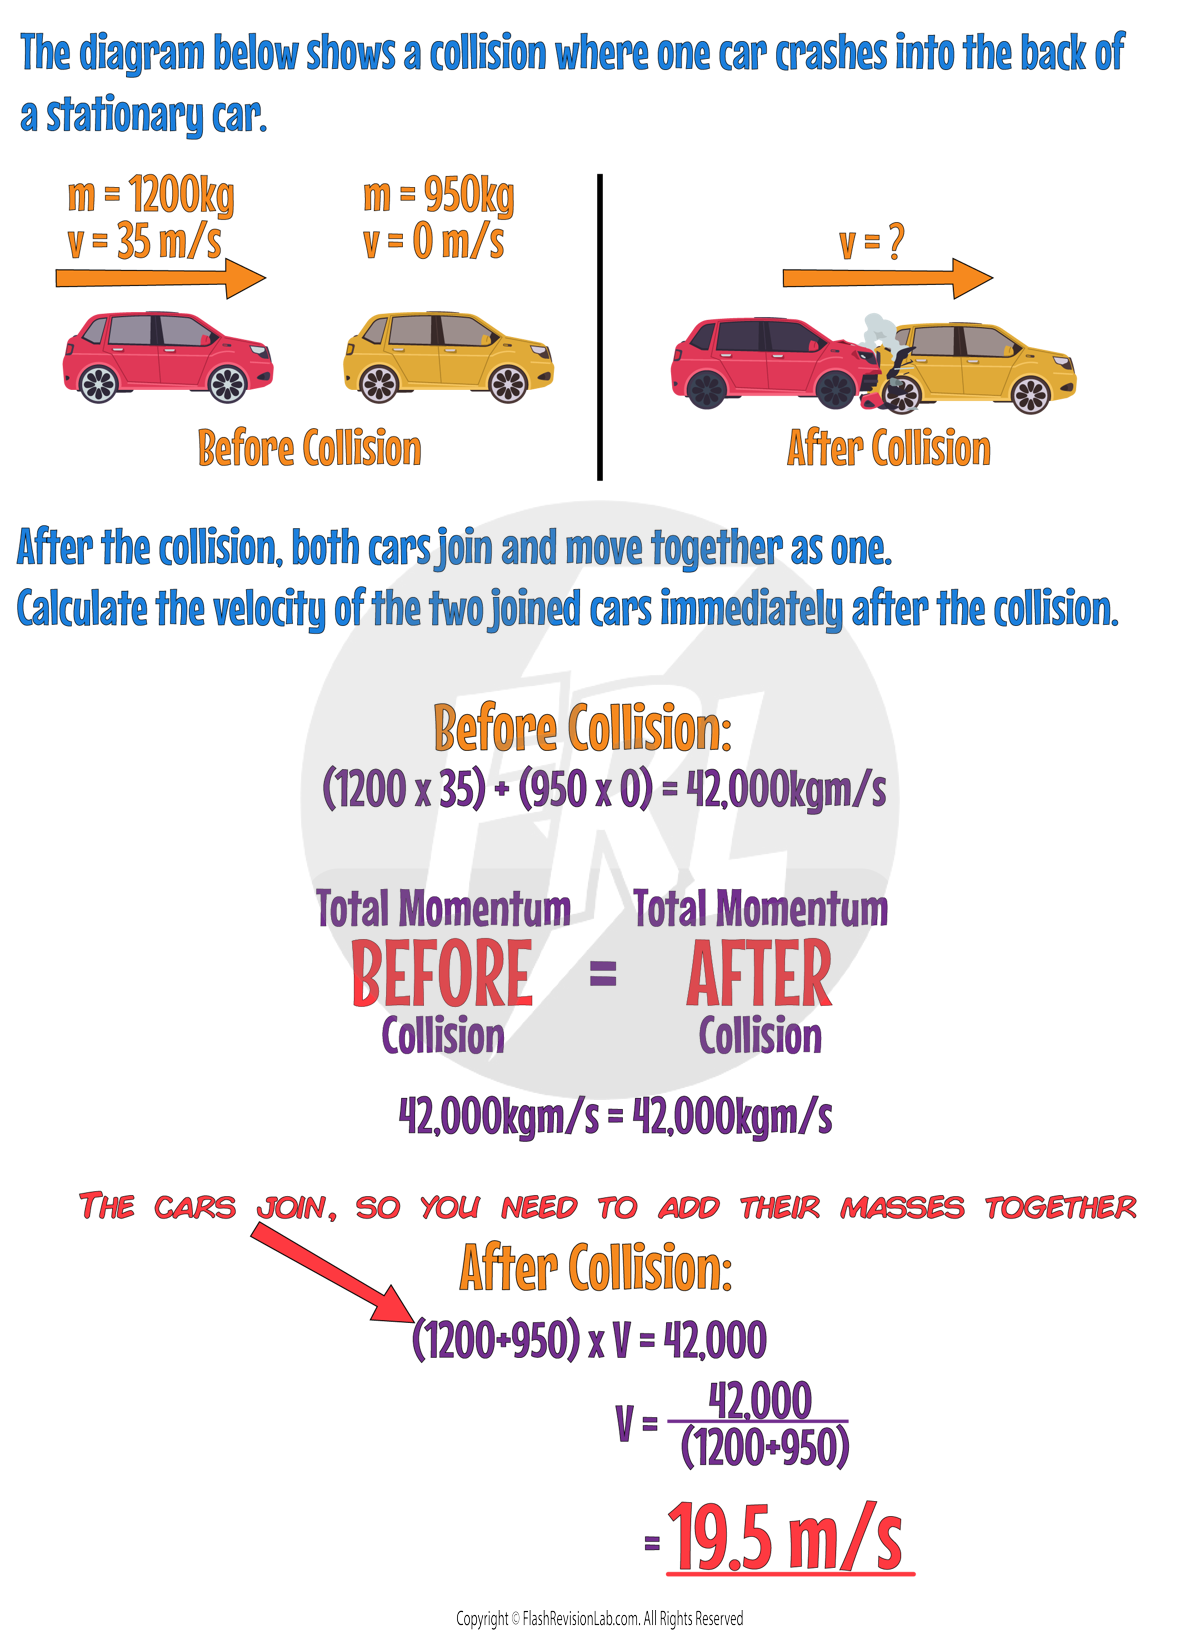
Transverse and Longitudinal Waves
Waves transfer ENERGY from one place to another WITHOUT transferring MATTER.
They do this by causing the PARTICLES in a MEDIUM (a substance) to OSCILLATE.
For Example:
1. Ripples on Water:

When you drop a stone into a still pond, you can see ripples forming in concentric circles moving outward from the point of impact.
The water molecules themselves only move UP AND DOWN, creating the ripples.
They do not move outward from the center; the molecules roughly remain in the same place.

If the water itself was travelling with the wave, anything floating on the surface, like a leaf or a piece of paper, would move outward too.
However, we observe that the floating objects only bob up and down, which indicates that the ENERGY moves through the water, NOT the water itself.
2. Sound Waves in Air:
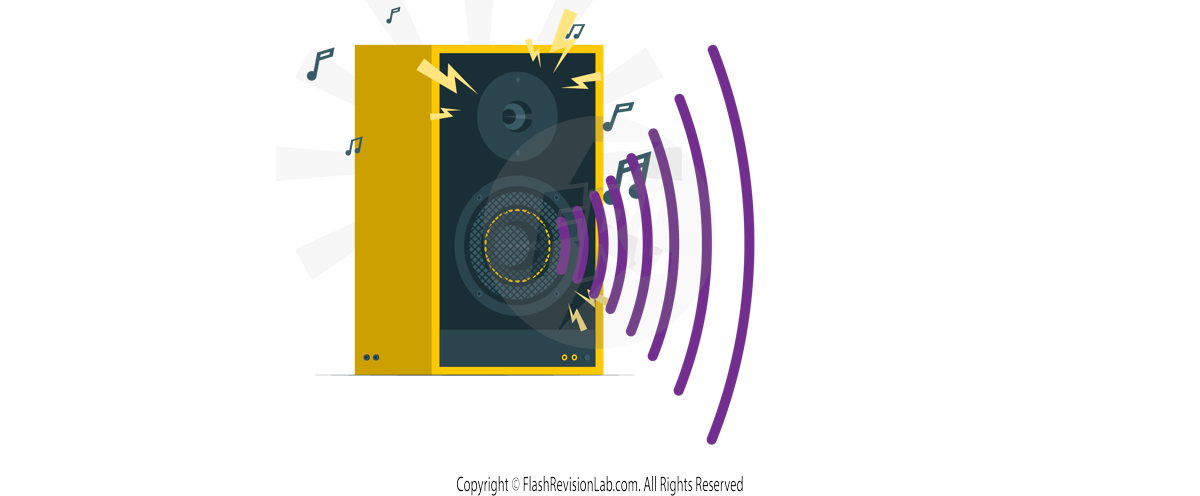
Consider a loudspeaker playing music. The sound you hear is the result of waves travelling from the speaker to your ears.
The air molecules VIBRATE BACK AND FORTH as the sound wave passes but do NOT travel from the speaker to you.
If the air traveled with the sound, you would feel a constant wind from the speaker when it was producing sound, which we do not.
Additionally, if we use smoke or a light object like a feather in front of a speaker, we can see that while the smoke or feather may flutter due to the vibrations, they do NOT move towards us with the sound.
Transverse Waves
These are waves where the OSCILLATIONS are PERPENDICULAR to the direction of ENERGY TRANSFER.
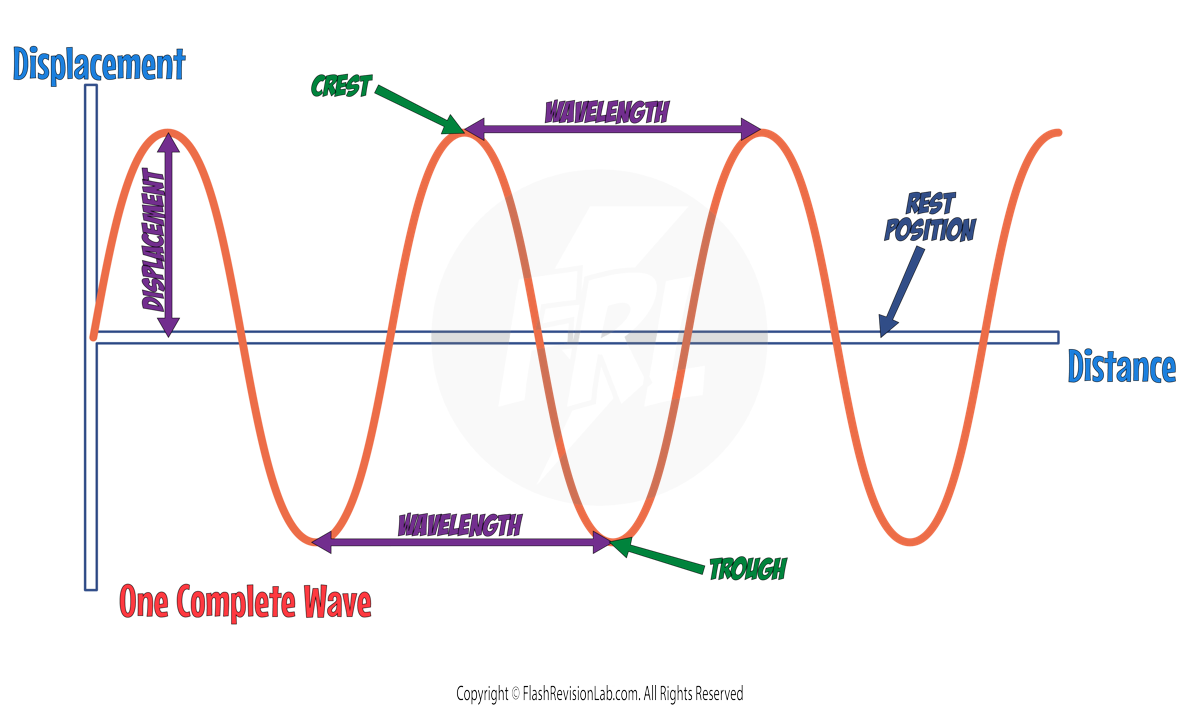
- CREST (PEAK): The HIGHEST POINT of a wave.
- TROUGH: The LOWEST POINT of a wave.
- DISPLACEMENT: How far a point on the wave has moved from its REST POSITION. It’s measured in METRES (m).
- AMPLITUDE: The MAXIMUM DISPLACEMENT of a point on a wave away from its REST POSITION. On a diagram it’s the HEIGHT from the REST POSITION (the middle line of the wave) to the CREST. It’s measured in METRES (m).
- WAVELENGTH: The distance from a point on one wave to the EQUIVALENT POINT on an ADJACENT wave, like from CREST TO CREST or TROUGH TO TROUGH. It's usually represented by the Greek letter lambda (λ) and measured in METRES (m).
Examples of transverse waves include:
- ELECTROMAGNETIC WAVES (like visible LIGHT)
- WATER WAVES
- SEISMIC WAVES (S-Waves)
Longitudinal Waves
These are waves where the OSCILLATIONS are PARALLEL to the direction of ENERGY TRANSFER.
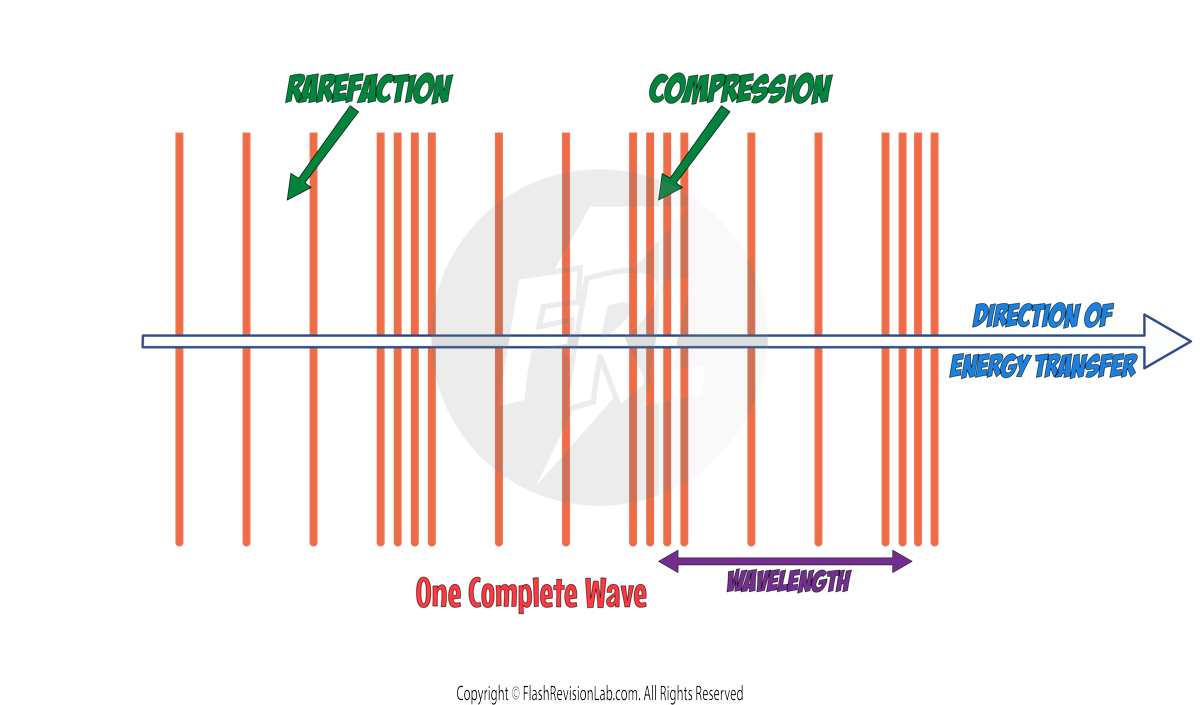
- COMPRESSION: The region where the particles of the medium are CLOSEST to each other.
- RAREFACTION: The opposite of compression. It's the part where the particles are SPREAD APART.
- WAVELENGTH: The distance between CONSECUTIVE COMPRESSIONS or between CONSECUTIVE RAREFACTIONS.
Examples of transverse waves include:
- SOUND WAVES
- SEISMIC WAVES (P-Waves)
Properties of Waves
Two additional properties of waves include FREQUENCY and PERIOD:
- FREQUENCY: The NUMBER OF WAVES that pass a certain point in ONE SECOND. It's measured in HERTZ (Hz).
- PERIOD (Time Period): The time it takes for ONE COMPLETE WAVE to pass a point. It’s measured in SECONDS (s).
FREQUENCY and PERIOD are connected by the following equation:

Where:
- f is frequency, measured in Hertz (Hz).
- T is period, measured in Seconds (s).
The Wave Equation
This equation is used to work out WAVE SPEED, which is defined as the SPEED at which ENERGY is TRANSFERRED (or the wave moves) through a MEDIUM:
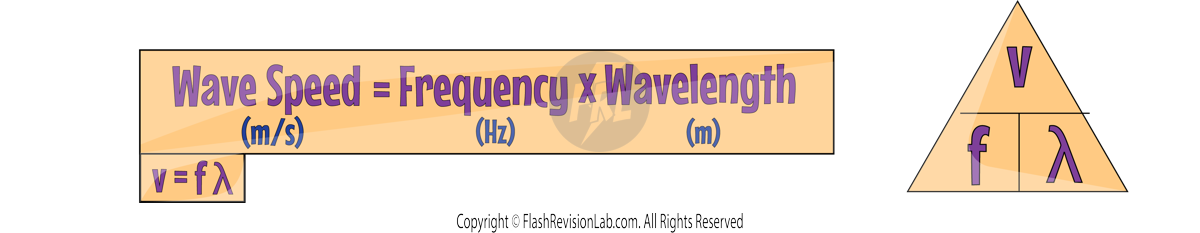
Where:
- v is wave speed, measured in m/s.
- f is frequency, measured in Hz.
- λ is wavelength, measured in m.
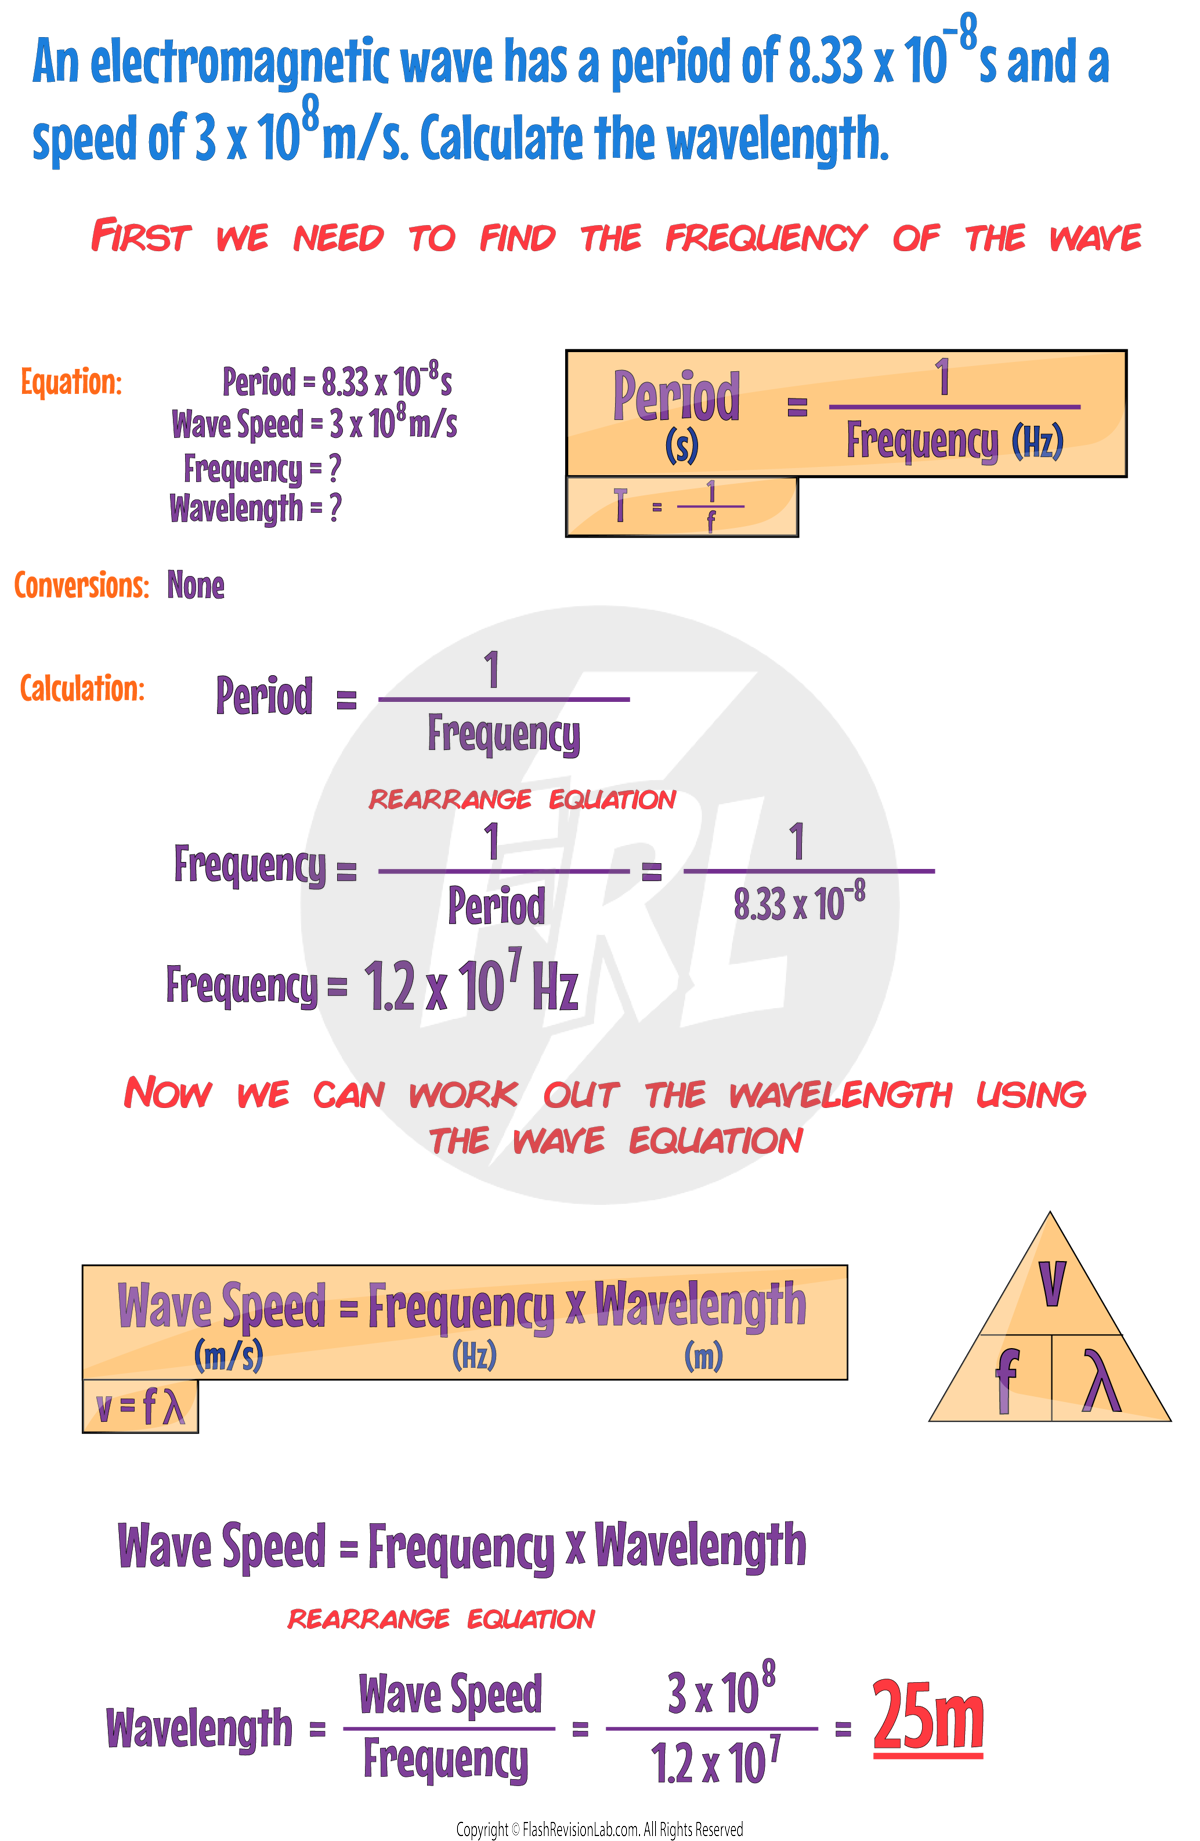
Measuring the Speed of Sound
You can work out the SPEED OF SOUND using TWO methods:
Method 1: Direct Measurement
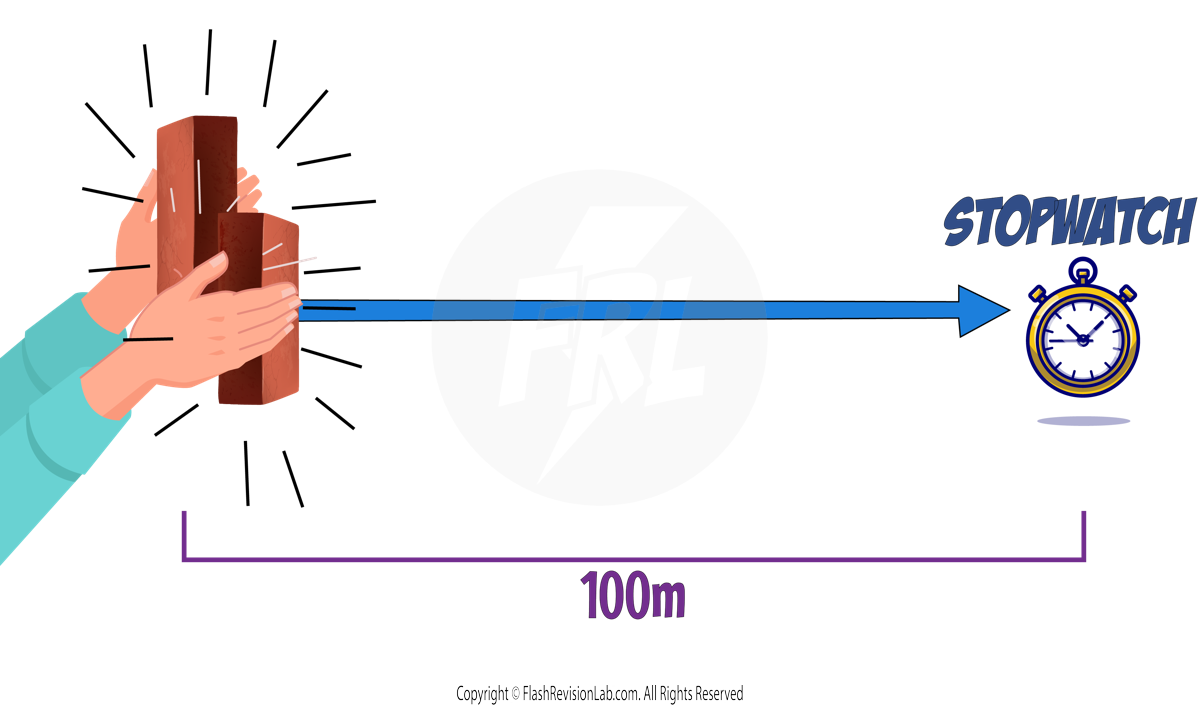
- Two people need to stand 100 METERS apart.
- Use a TRUNDLE WHEEL or TAPE MEASURE to measure the distance.
- One person claps TWO BRICKS.
- The other person uses a STOPWATCH. They start timing when they SEE the blocks clapped and stop when they HEAR the sound.
- REPEAT this several times and get an AVERAGE time.
- Use the FORMULA to find the speed of sound:
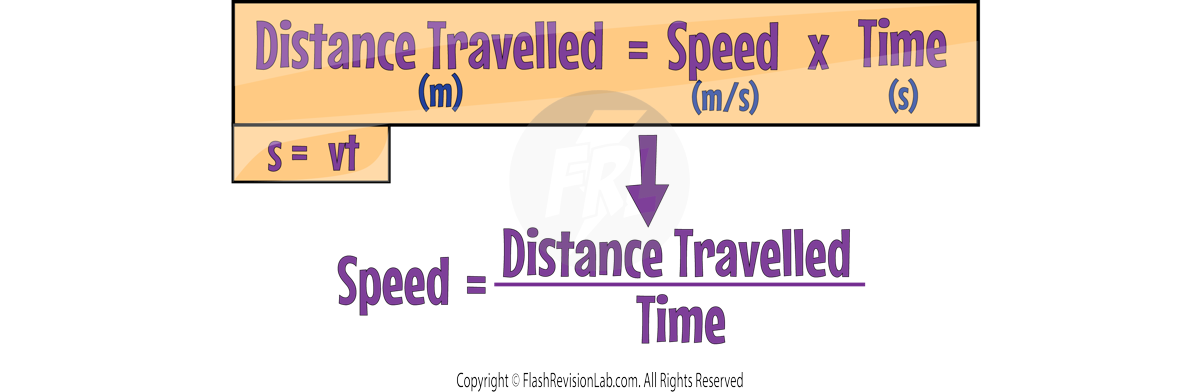
Method 2: Echoes
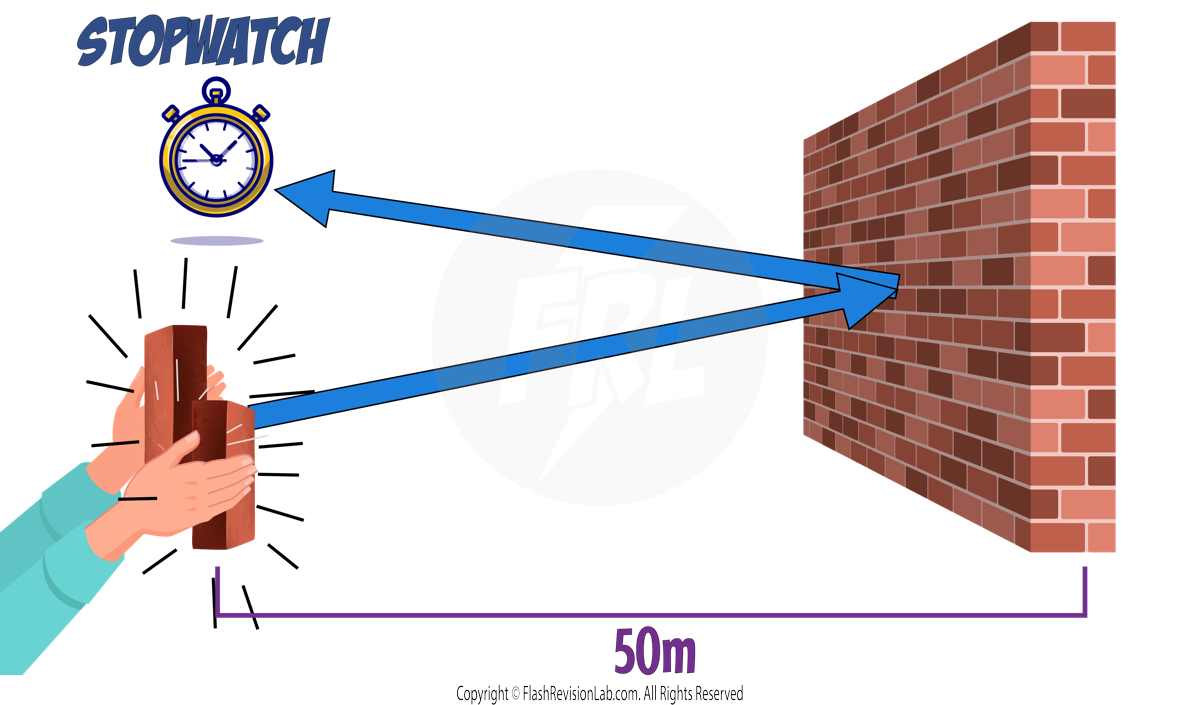
- Two people stand about 50 METERS from a large wall.
- Use a TRUNDLE WHEEL or TAPE MEASURE to measure the distance.
- One person claps TWO BRICKS.
- The other person uses a STOPWATCH. They start timing when they SEE the blocks clapped and stop when they HEAR the sound.
- Repeat several times to get an AVERAGE time.
- Use the FORMULA to find the speed of sound, but ensure you DOUBLE the distance (50m x 2 = 100m) to account for the distance of the echo returning back.
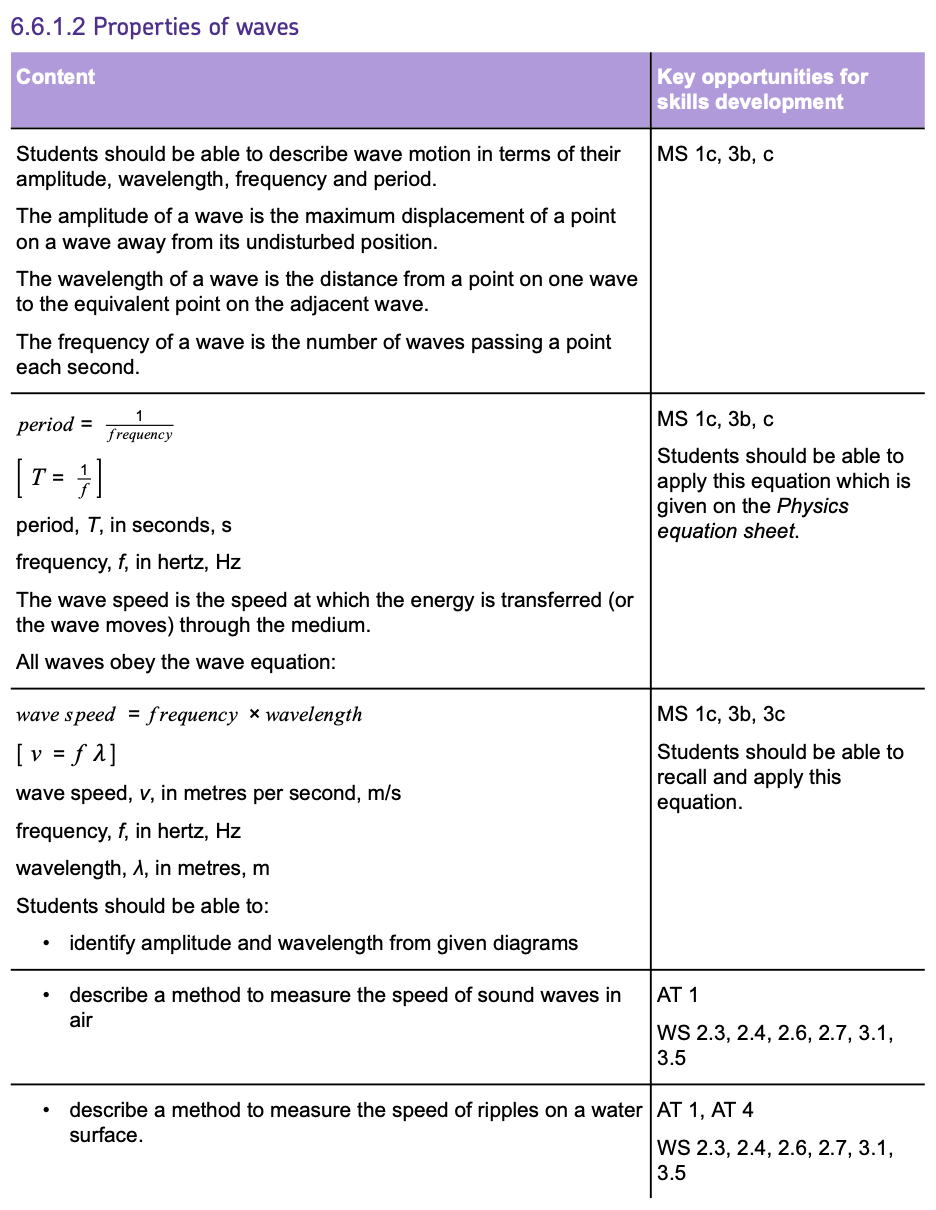
Required Practical: Waves
This practical involves TWO experiments:
1. Measuring the Speed of Water Ripples
For this experiment, a RIPPLE TANK is used:
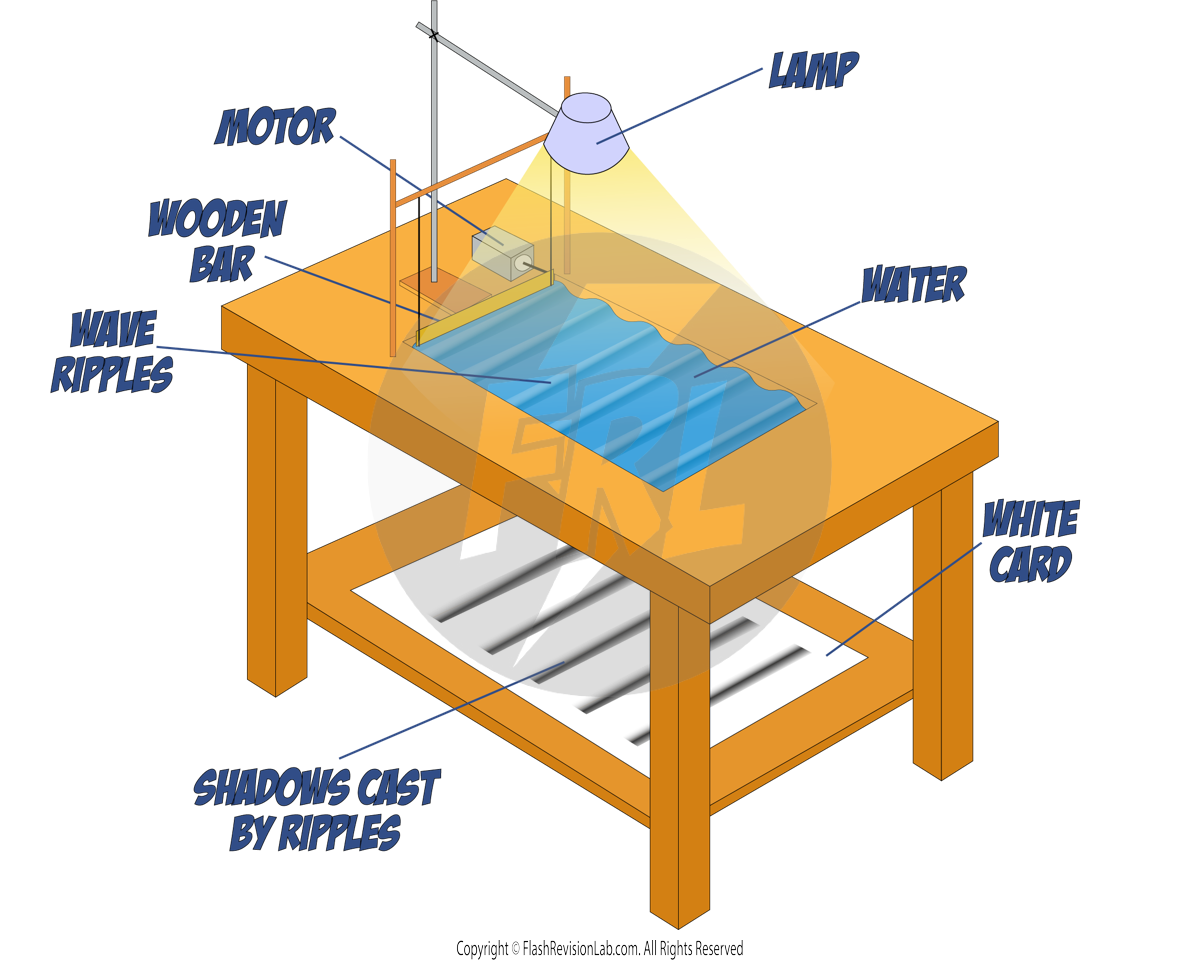
The motor causes the wooden bar to move UP and DOWN, which produces WAVES in the water in the form of RIPPLES.
The light from above SHINES and creates a SHADOW of the waves on the WHITE CARD underneath.
Ripple tanks can be used to find the FREQUENCY, WAVELENGTH and WAVE SPEED of water ripples:
Measuring Frequency:
- Start a STOPCLOCK when the first wave passes a fixed point.
- Count the number of waves that pass this point within a set time frame.
- Divide the set time by the number of waves to find the time for one wave, known as the TIME PERIOD (T).
- The FREQUENCY (f) can be calculated using the equation:
Measuring Wavelength:
- Use a CAMERA to capture an image of the waves to "freeze" them.
- With a METRE RULER, measure the distance between two wavefronts.
- COUNT how many waves between those wavefronts.
- Divide the total distance by the number of waves to get the WAVELENGTH (λ).
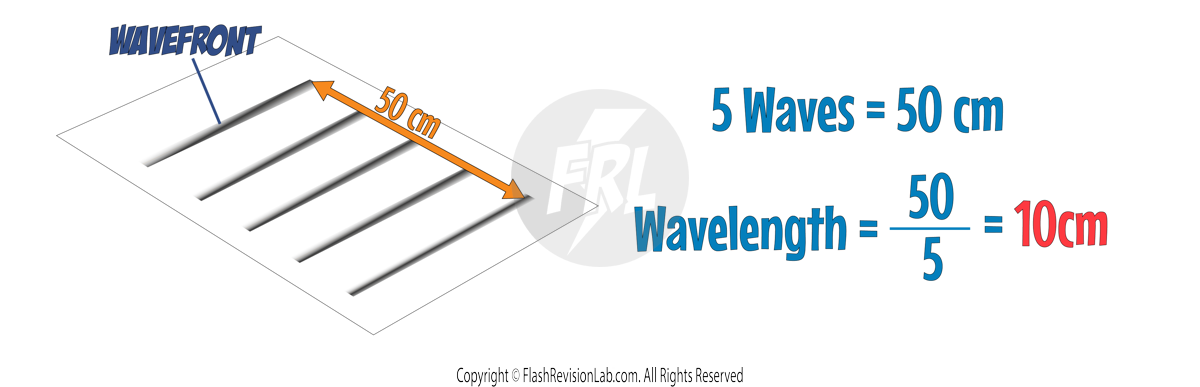
Measuring Speed:
- Determine a mean value for the FREQUENCY and WAVELENGTH.
- TIME how long it takes for one wavefront to travel the distance of the white card.
- Measure the LENGTH of the card.
- The SPEED (v) is calculated by dividing the distance by the time taken:
2.Measuring Waves on a String
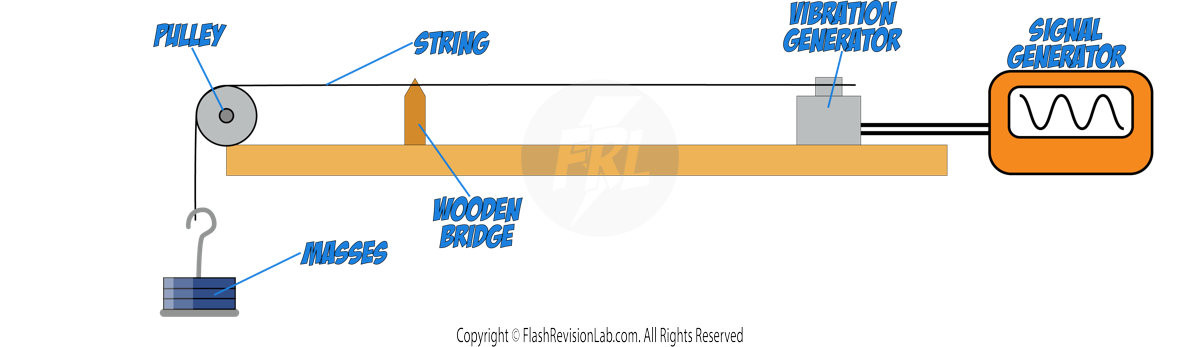
- Set up your equipment with a SIGNAL GENERATOR and VIBRATION GENERATOR. Switch on the signal generator to make the string vibrate.
- Tweak the FREQUENCY of the signal generator to get a clear WAVE PATTERN on the string. The right frequency depends on the string's length and the weight attached.
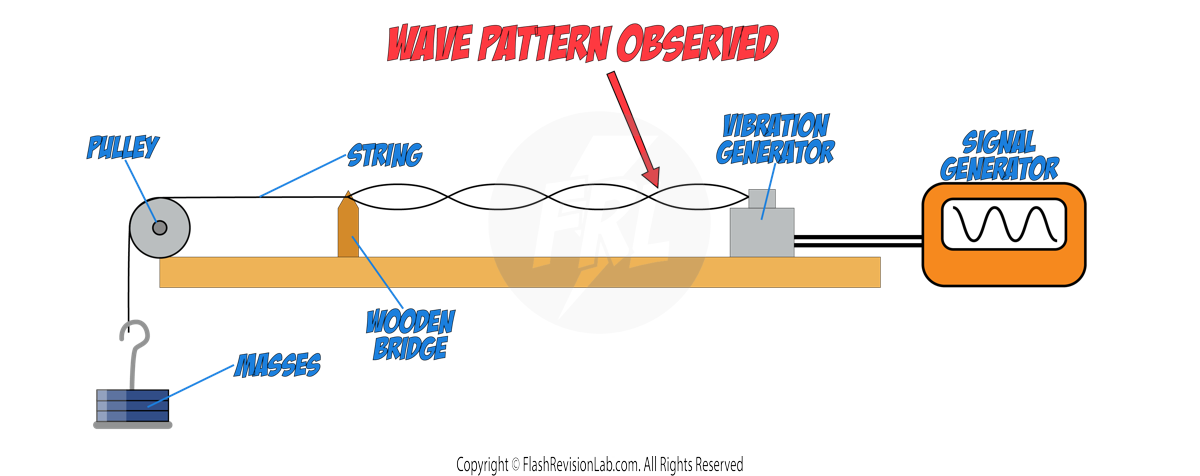
- Measure the WAVELENGTH. It's most accurate to measure multiple wavelengths at once. Then divide the total LENGTH by the NUMBER of wavelengths to find the FULL wavelength.
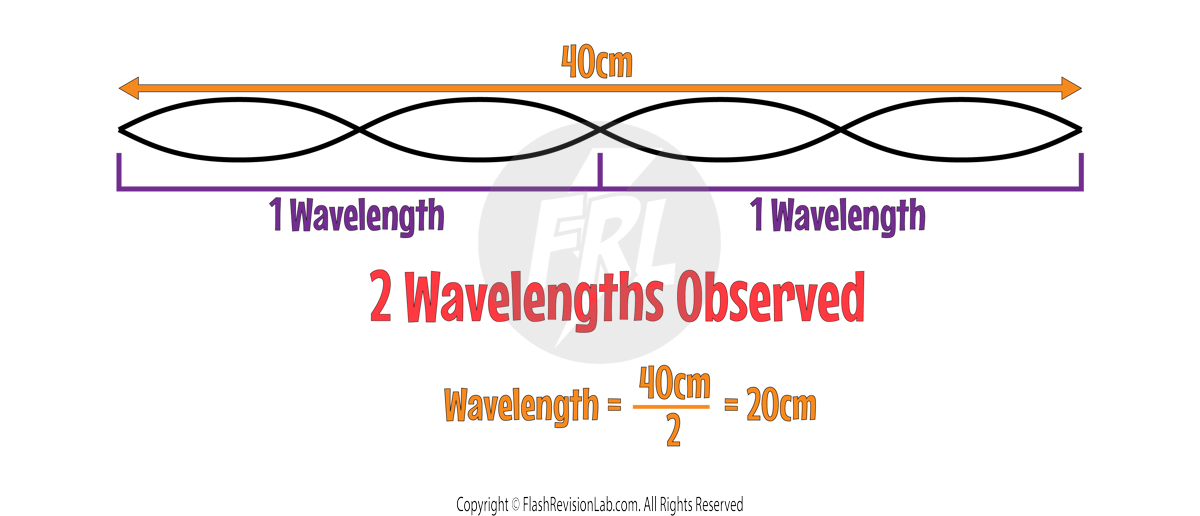
- The FREQUENCY is simply the setting on the SIGNAL GENERATOR.
- Calculate the SPEED of the wave on the string using the formula:
Types of Electromagnetic Waves
- Electromagnetic waves are TRANSVERSE waves that transfer energy from the SOURCE of a wave to an ABSORBER.
- They can travel through a VACUUM.
- They all travel at the SAME SPEED of 3x10⁸m/s which is the SPEED OF LIGHT.
- There are SEVEN types of ELECTROMAGNETIC WAVES and they form a CONTINUOUS SPECTRUM which groups each type in terms of their WAVELENGTH and their FREQUENCY.
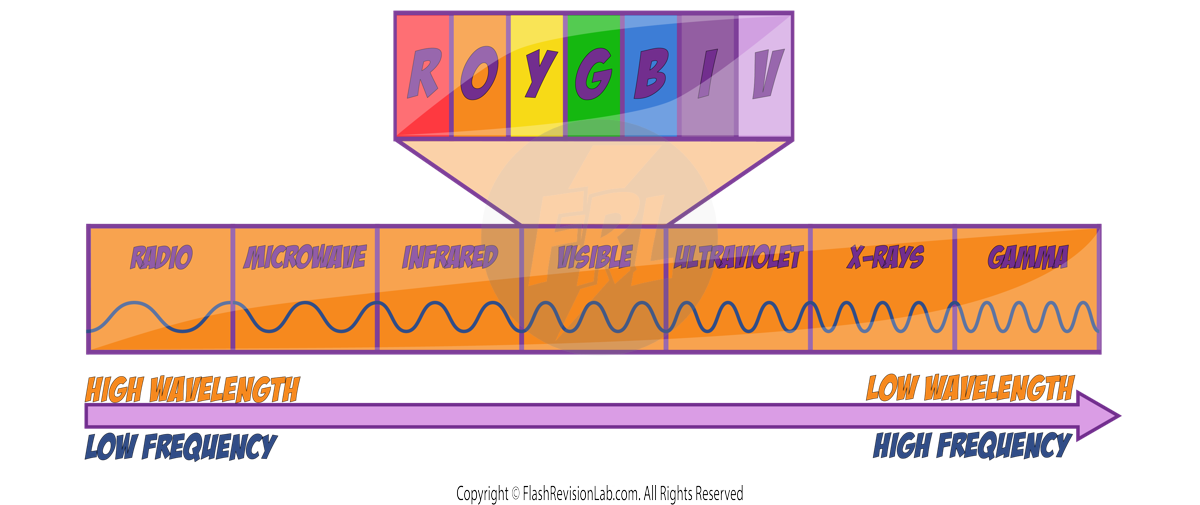
On one end of the spectrum we have RADIO WAVES which have the HIGHEST WAVELENGTH and LOWEST FREQUENCY, and on the other end we have GAMMA RAYS which have the LOWEST WAVELENGTH and the HIGHEST FREQUENCY.
Visible Light
In the MIDDLE of the spectrum we have visible light. These represent the part of the ELECTROMAGNETIC SPECTRUM that we can detect with our EYES.
The different wavelengths of VISIBLE LIGHT appear as different COLOURS to us.
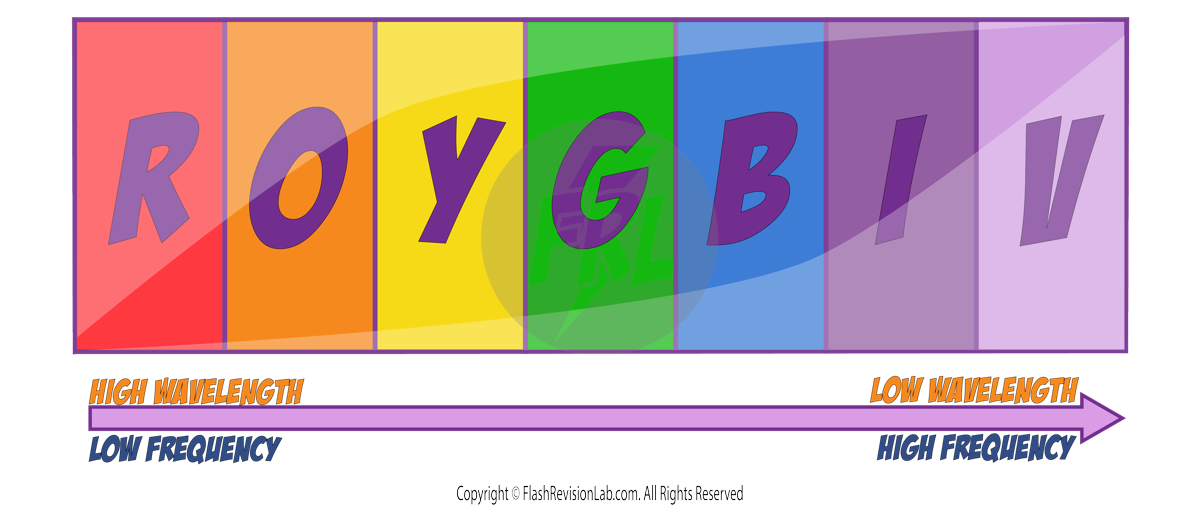
The colours are red, orange, yellow, green, blue, indigo, violet where RED has the HIGHEST WAVELENGTH and LOWEST FREQUENCY, and VIOLET has the LOWEST WAVELENGTH and HIGHEST FREQUENCY.
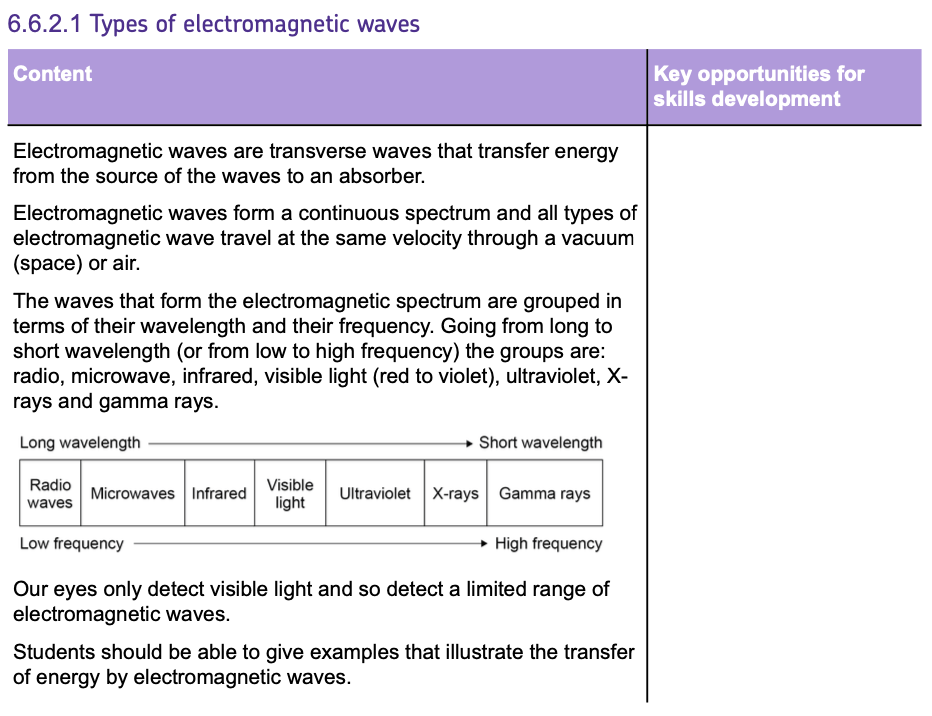
Refraction
When a WAVE encounters a boundary between two materials, it can do one of three things:
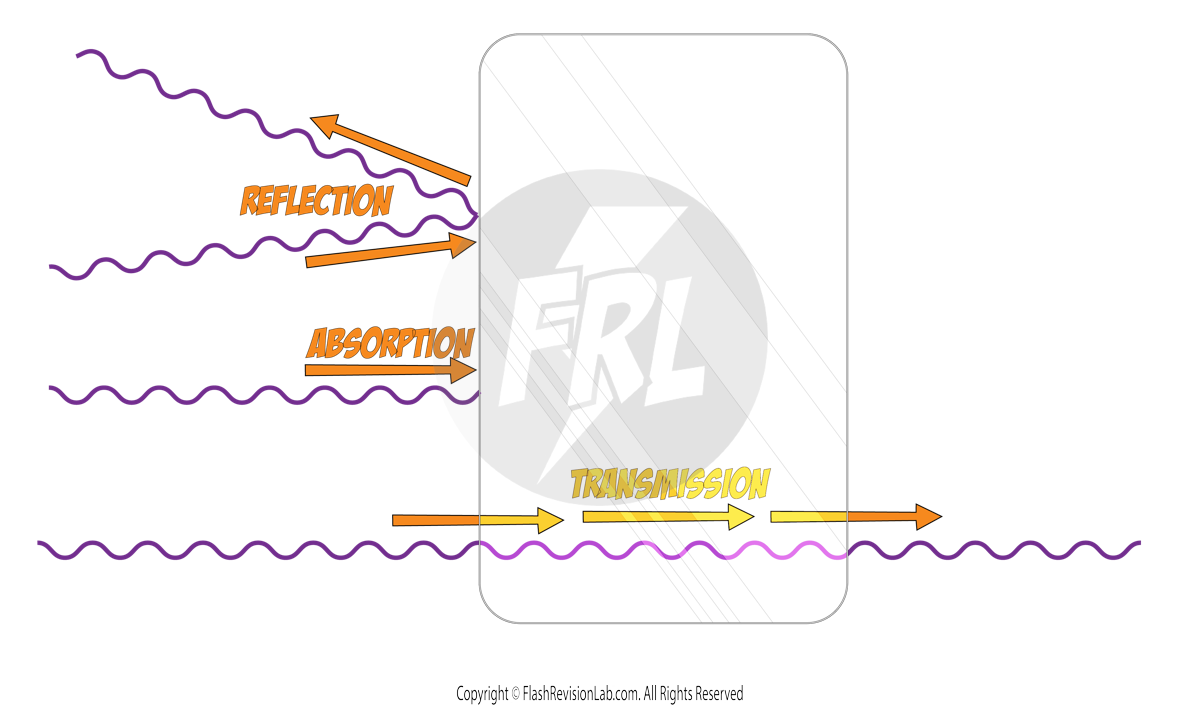
1. ABSORPTION:
Here, the wave TRANSFERS its ENERGY to the second material. Often, this turns into THERMAL ENERGY, causing the material to heat up.
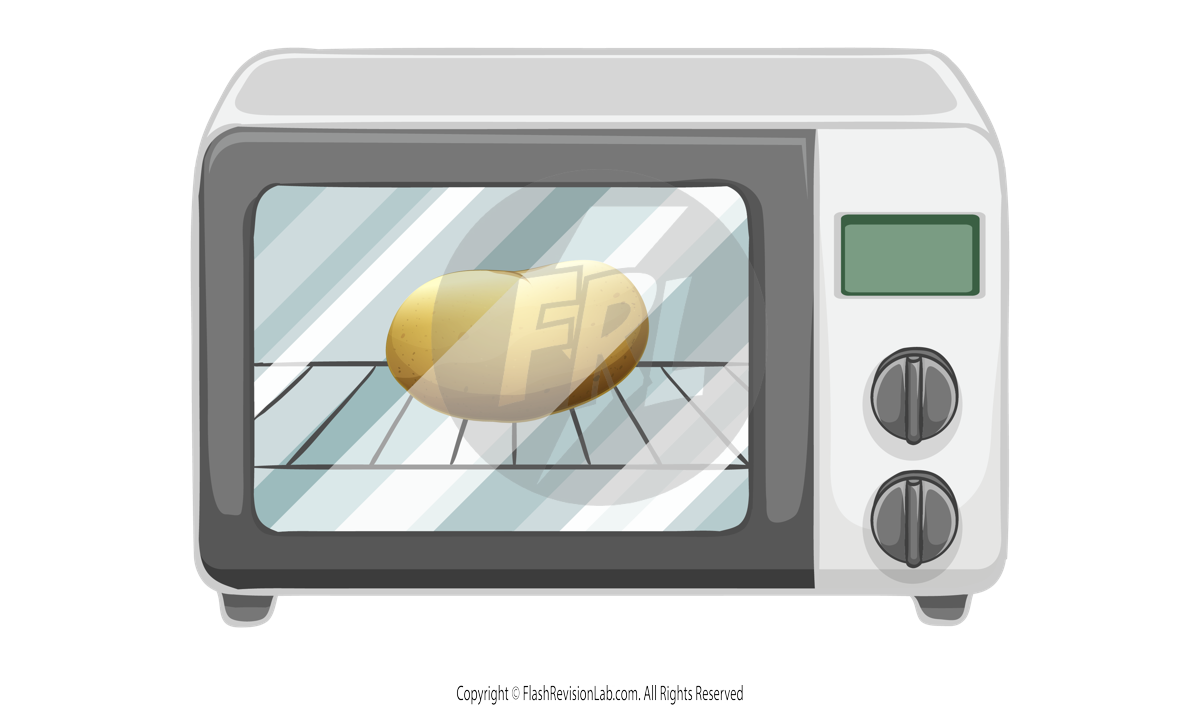
For example in a MICROWAVE OVEN the MICROWAVES get ABSORBED by the water molecules in the potato, causing them to VIBRATE and heat up. This THEMAL ENERGY conducts through the rest of the potato, causing its temperature to INCREASE.
2. REFLECTION:

Reflection occurs when the wave BOUNCES BACK at the boundary of the two mediums.
The SHINIER an object, the BETTER it reflects visible light.
This allows us to SEE objects. The visible light waves given off a light source REFLECT off other objects, and enters our eyes.
3. TRANSMISSION:
The wave continues to TRAVEL THROUGH the new material. This can lead to another process known as REFRACTION.
Refraction
REFRACTION happens when a wave crosses into a new medium, causing it to change SPEED and sometimes DIRECTION.
When the wave travels from a LESS DENSE medium to a MORE DENSE medium, the SPEED and the WAVELENGTH of the wave DECREASES but the FREQUENCY of the wave STAYS THE SAME.
When the wave travels from a MORE DENSE medium to a LESS DENSE medium, the SPEED and the WAVELENGTH of the wave INCREASES but again the FREQUENCY of the wave STAYS THE SAME.
We can show this using LIGHT waves travelling through AIR (less dense) and GLASS (more dense).
E.g. Light entering perpendicularly
When the light enters the glass PERPENDICULARLY, it does NOT bend - it just passes STRAIGHT THROUGH.
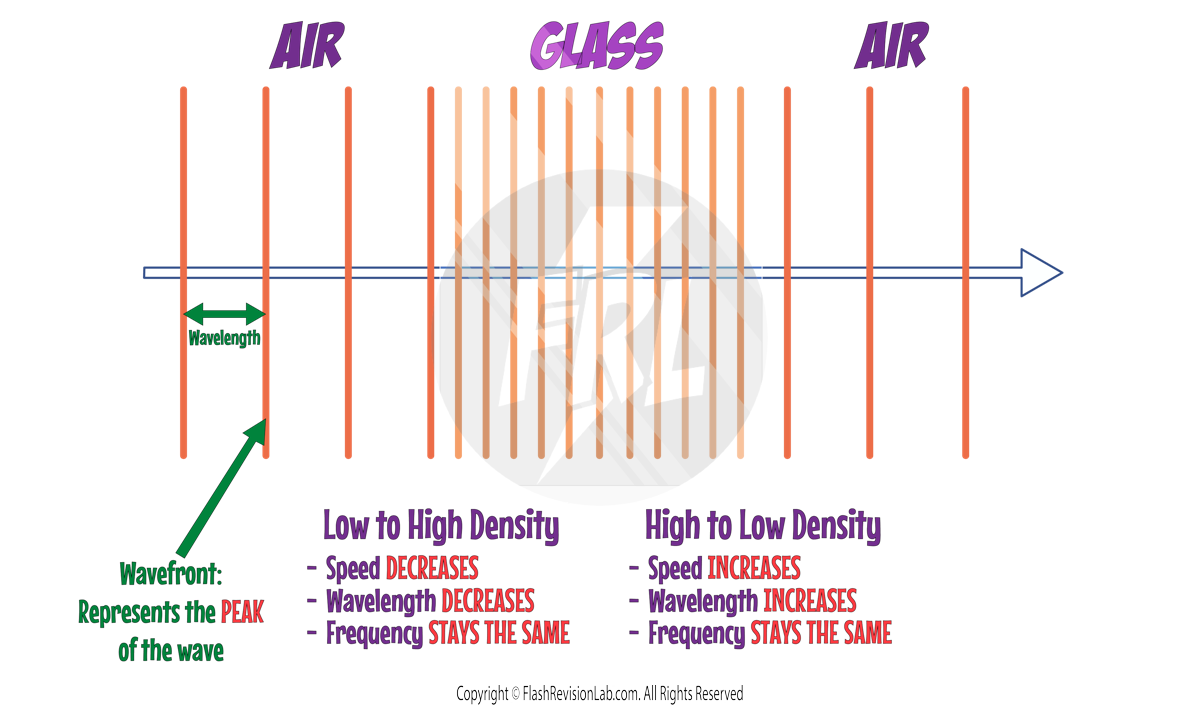
This is known as a WAVEFRONT DIAGRAM. In these diagrams, each LINE represents the PEAK of a wave.
The DISTANCE between each line is the WAVELENGTH of the wave.
E.g. Light entering at an angle
If the waves enters the new medium AT AN ANGLE, the DIRECTION of the wave will CHANGE.
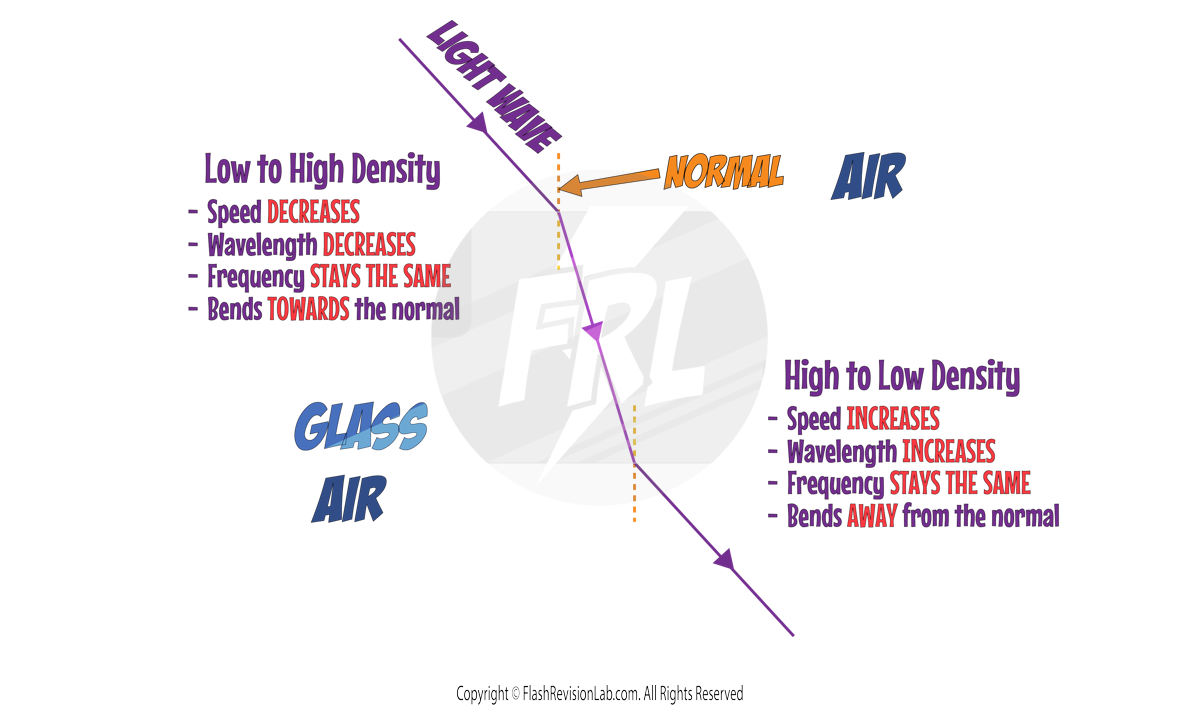
When the wave travels from a LESS DENSE medium to a MORE DENSE medium, the WAVE bends TOWARDS the NORMAL (a line perpendicular to the surface).
When the wave travels from a MORE DENSE medium to a LESS DENSE medium, the WAVE bends AWAY from the NORMAL.
This can be explained using WAVEFRONTS:
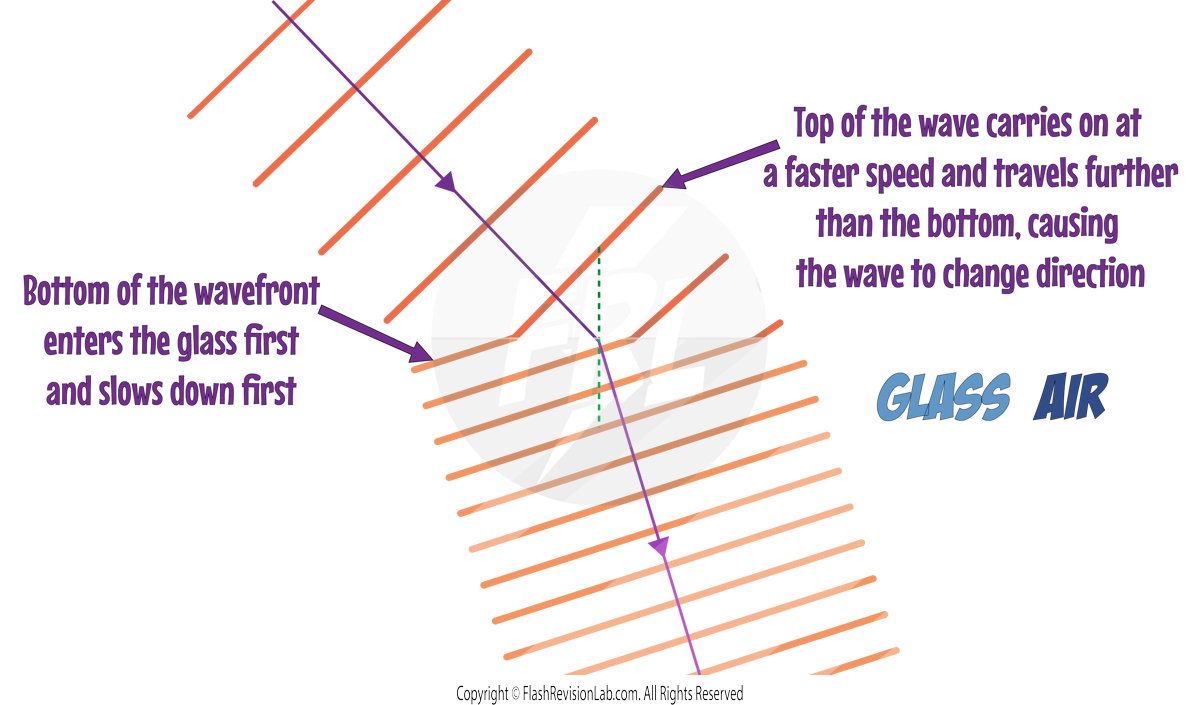
Properties and Uses of Electromagnetic Waves
Radio Waves
RADIO WAVES are used in wireless communication such as TV and Radio. Here’s how they work:
- RADIO WAVES are created using an ALTERNATING CURRENT (AC) in a circuit connected to an antenna.
- The AC causes ELECTRONS to OSCILLATE, which then generates radio waves with the same FREQUENCY as the AC.
How Radio Waves Are Transmitted and Received:
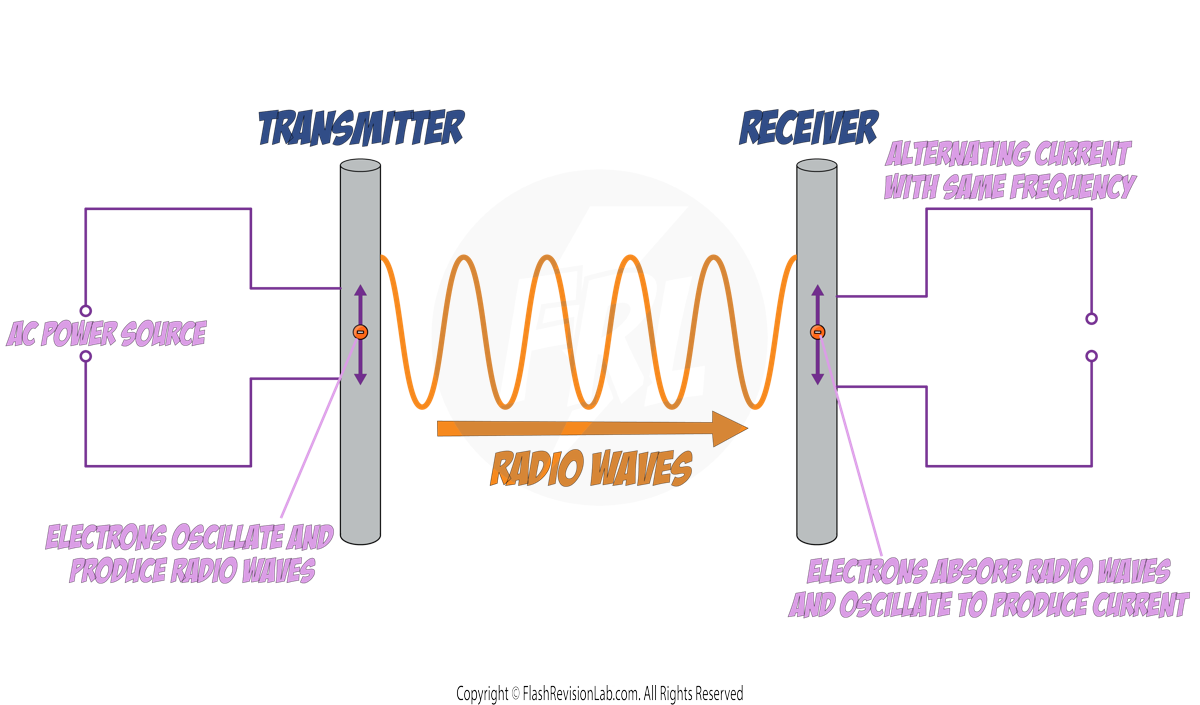
In a TRANSMITTING ANTENNA:
- The ELECTRONS move up and down due to the AC, creating radio waves that radiate away from the antenna.
- These radio waves can travel long distances and be RECEIVED by another antenna (receiver) tuned to the same frequency.
In a RECEIVING ANTENNA:
- The metal aerial ABSORBS the incoming radio waves.
- As the radio waves pass through the receiving antenna, they cause ELECTRONS to VIBRATE and create an ALTERNATING CURRENT in the circuit connected to it.
- This AC has the SAME FREQUENCY as the radio waves.
- This induced current can then be converted back into sound or other forms of data by the receiver's electronics.
Microwaves:
- Ideal for SATELLITE COMMUNICATIONS because they can penetrate the Earth's atmosphere with little interference.
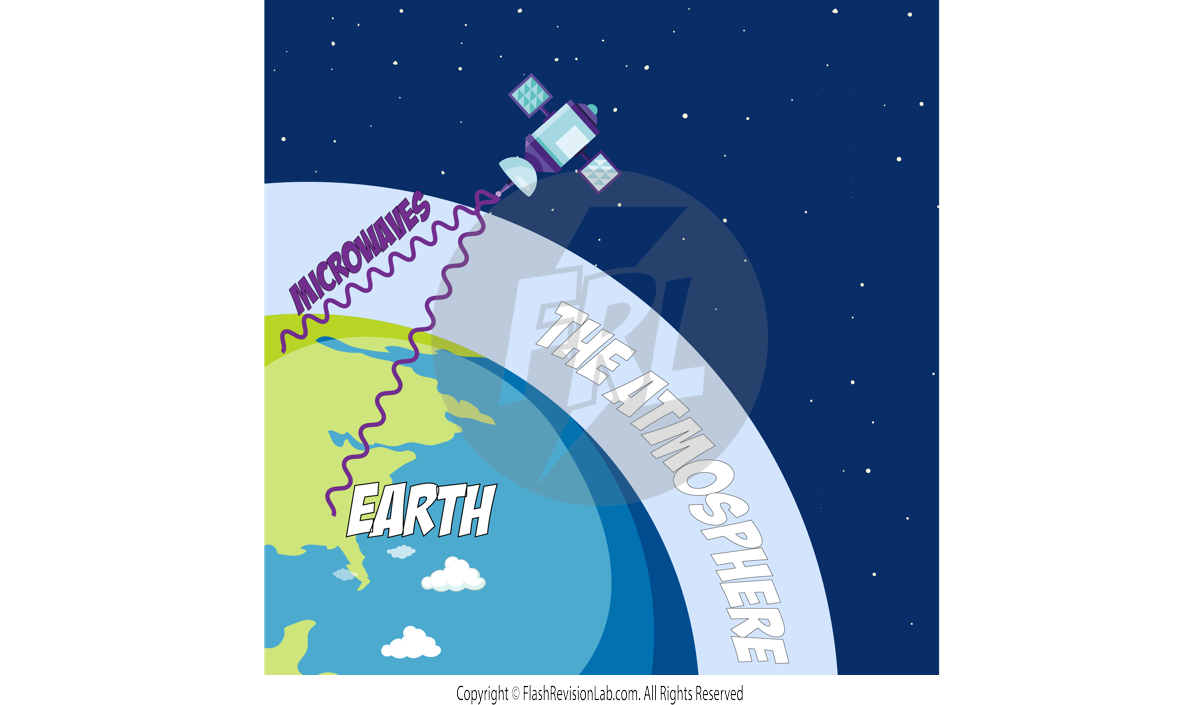
- In COOKING, microwaves excite water molecules in food, heating it quickly and efficiently.
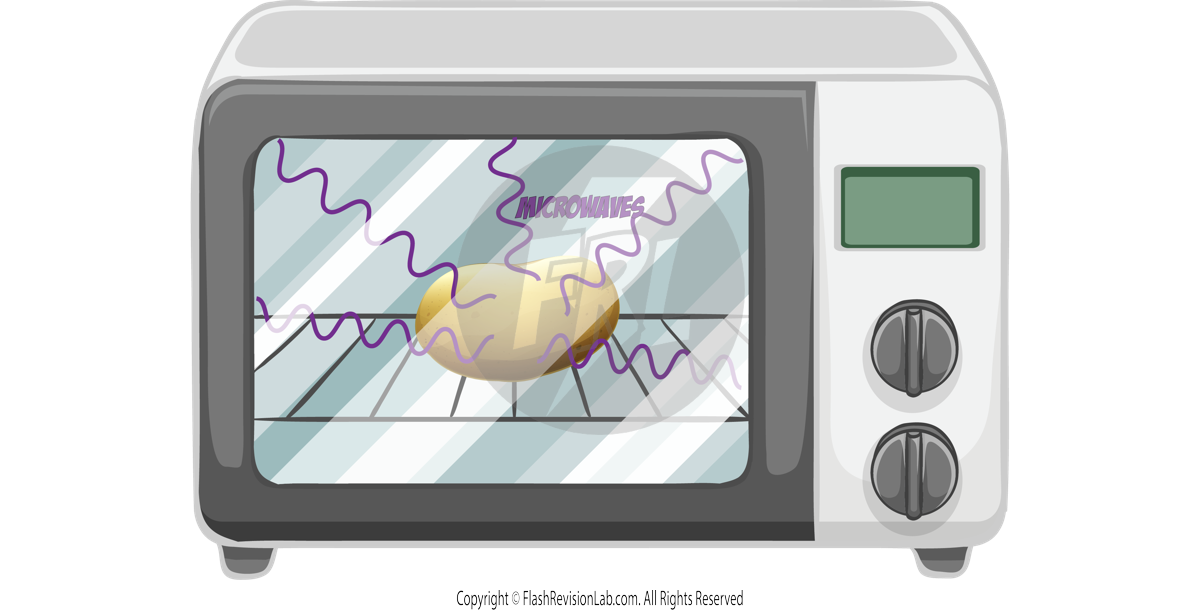
Infrared:
- ELECTRICAL HEATERS utilise infrared as it directly warms objects and people rather than the air around them.
- Infrared is also used in cooking for its heating properties and in INFRARED CAMERAS to detect heat, which is useful in night-vision devices.
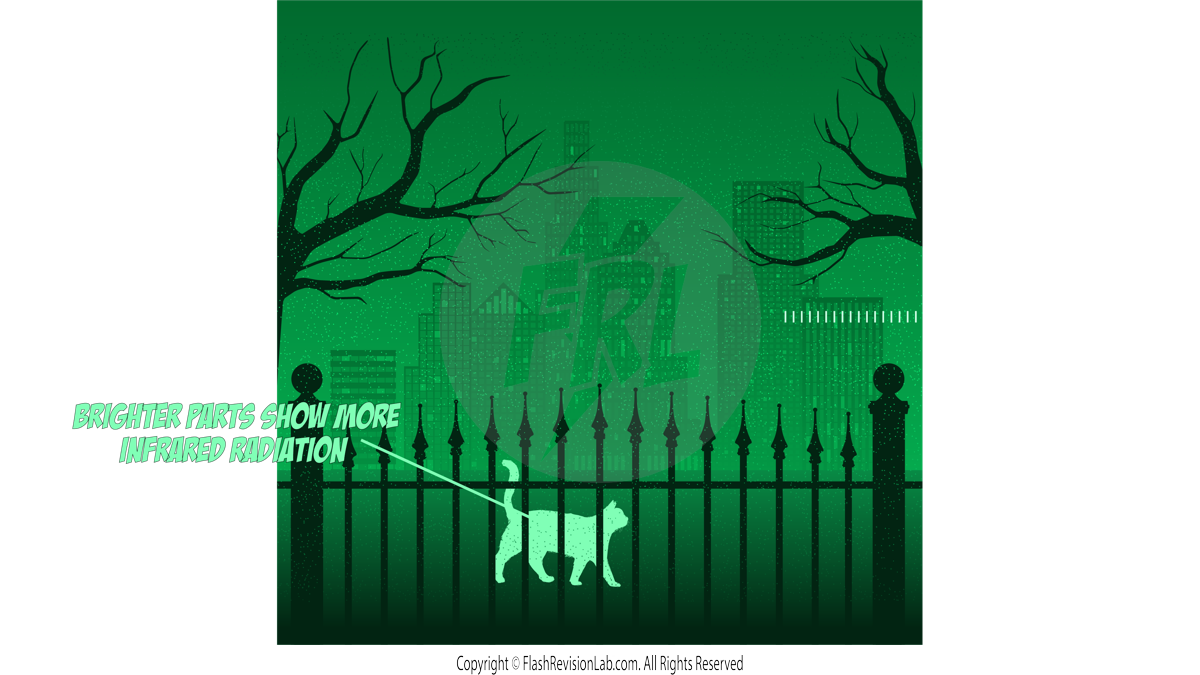
Visible Light:
- This is used in FIBRE OPTIC COMMUNICATIONS. Visible light can carry large amounts of data over long distances with very little loss of signal.
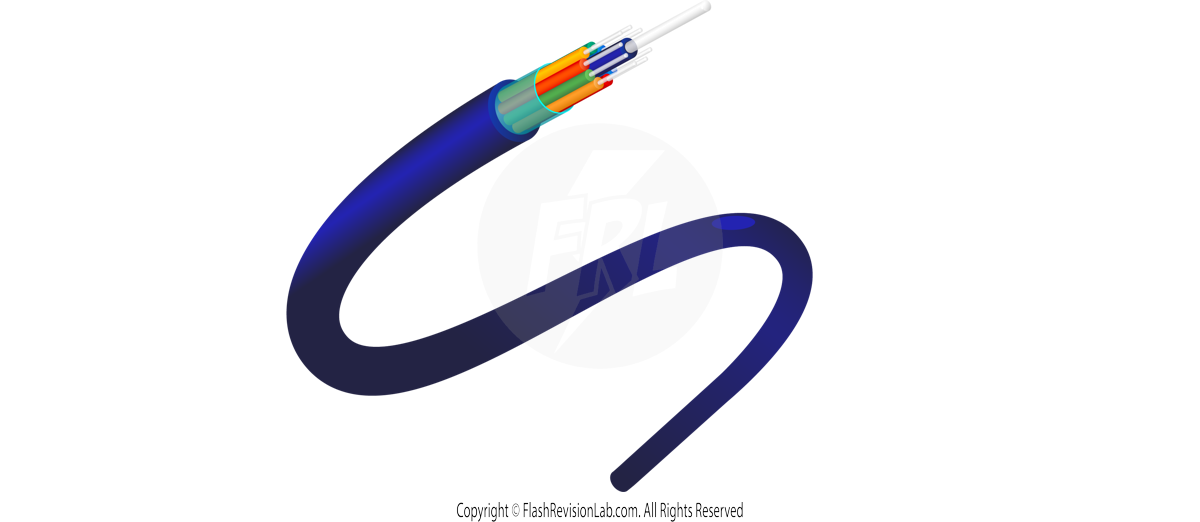
Ultraviolet:
- Employed in ENERGY-EFFICIENT LAMPS where UV light is converted into visible light.
- Used in TANNING BEDS.

X-rays and Gamma Rays:
- Critical in MEDICAL IMAGING, such as X-ray radiography, to view the internal structure of the body.
- GAMMA RAYS are used in cancer treatment to target and destroy cancer cells.
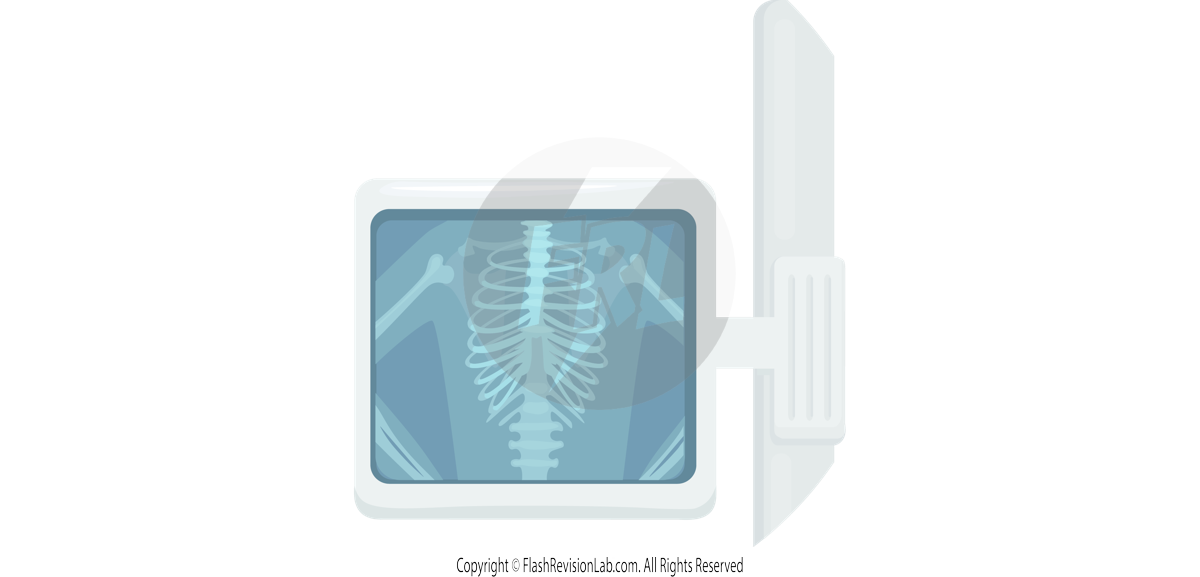
Atomic and Nuclear Changes:
- At the atomic level, changes in atoms and their nuclei can lead to the EMISSION or ABSORPTION of electromagnetic waves across a broad frequency range.
- When an electron ABSORBS ELECTROMAGNETIC RADIATION, it MOVES to a HIGHER energy level FURTHER from the nucleus.
- When an electron EMITS ELECTROMAGNETIC RADIATION, it MOVES to a LOWER energy level CLOSER to the nucleus.
- This is how GAMMA RAYS are produced from changes in the nucleus of an atom.
Health Effects of High-Frequency Waves:
- The higher-frequency electromagnetic waves, like ULTRAVIOLET (UV) rays, X-RAYS, and GAMMA RAYS, can be hazardous to human tissues.
- The impact of these waves on the body depends on the type of radiation and the dosage, which is measured in SIEVERTS (Sv).
- SIEVERTS, assesses the risk of HARM from RADIATION exposure.

- 1,000 milliSieverts (mSv) is equivalent to 1 Sievert (Sv).
- ULTRAVIOLET RAYS can cause skin to age prematurely and increase the risk of skin cancer due to their ability to damage the genetic material in skin cells.
- X-RAYS and GAMMA RAYS are ionising radiation, which means they have enough energy to remove tightly bound electrons from atoms, causing the atoms to become charged ions. This ionisation process can lead to cellular and DNA damage, increasing the risk of CANCER.
Required Practical: Investigating Infrared Radiation
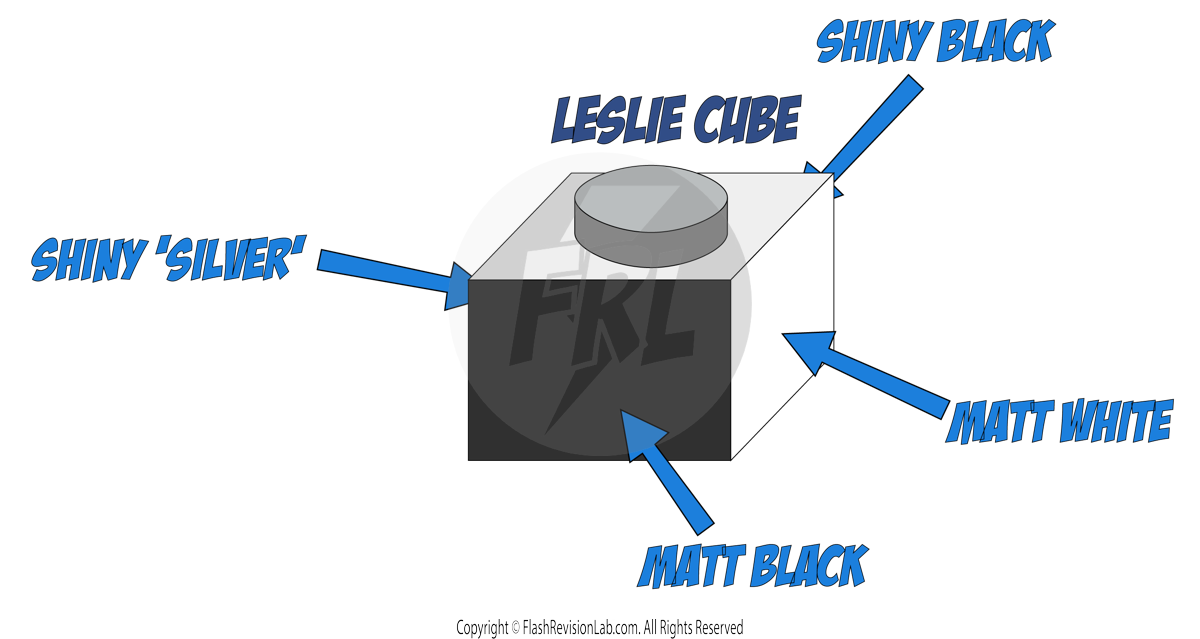
A LESLIE CUBE is a device used to explore the principles of thermal energy and emission of INFRARED RADIATION.
It's a hollow, watertight cube typically made of metal with different surfaces on each side, such as MATTE BLACK paint, MATTE WHITE paint, SHINY SILVER, and SHINY BLACK finishes. The varying surfaces allow us to investigate how different materials and textures emit infrared radiation differently.
In this practical experiment, we aim to understand how the surface material of an object affects the amount of INFRARED RADIATION it emits.
By comparing different surfaces, we can learn which materials are good emitters of infrared radiation and which are not.
Here’s how to conduct this experiment:
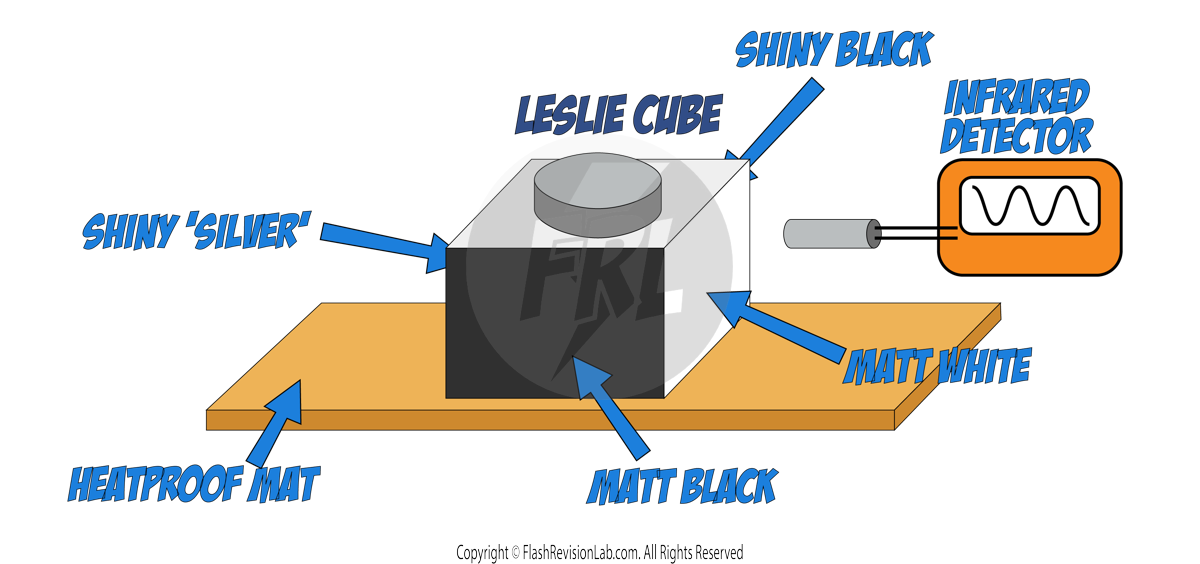
- Place a LESLIE CUBE on a heatproof mat.
- Boil water and carefully fill the cube with the boiling water.
- Allow the cube to warm up, then check that each side is at the same temperature with a THERMOMETER.
- Position an INFRARED DETECTOR at a fixed distance from one face of the cube and record the INFRARED RADIATION it detects.
- Do the same for each of the cube's faces, keeping the detector at the same distance each time.
- REPEAT the experiment to ensure reliability.
In your results, you'll find more INFRARED RADIATION from:
- the BLACK surface compared to the WHITE.
- MATTE surfaces than SHINY ones.
This tells us that MATTE BLACK colours emit INFRARED RADIATION more than SHINY WHITE colours.

Magnetism
MAGNETIC FORCE is a NON-CONTACT FORCE that can act at a distance, and is caused by magnetic fields.
- A magnet has TWO poles, NORTH and SOUTH, where the magnetic forces are STRONGEST.
- When two magnets are close, they exert magnetic forces on each other:
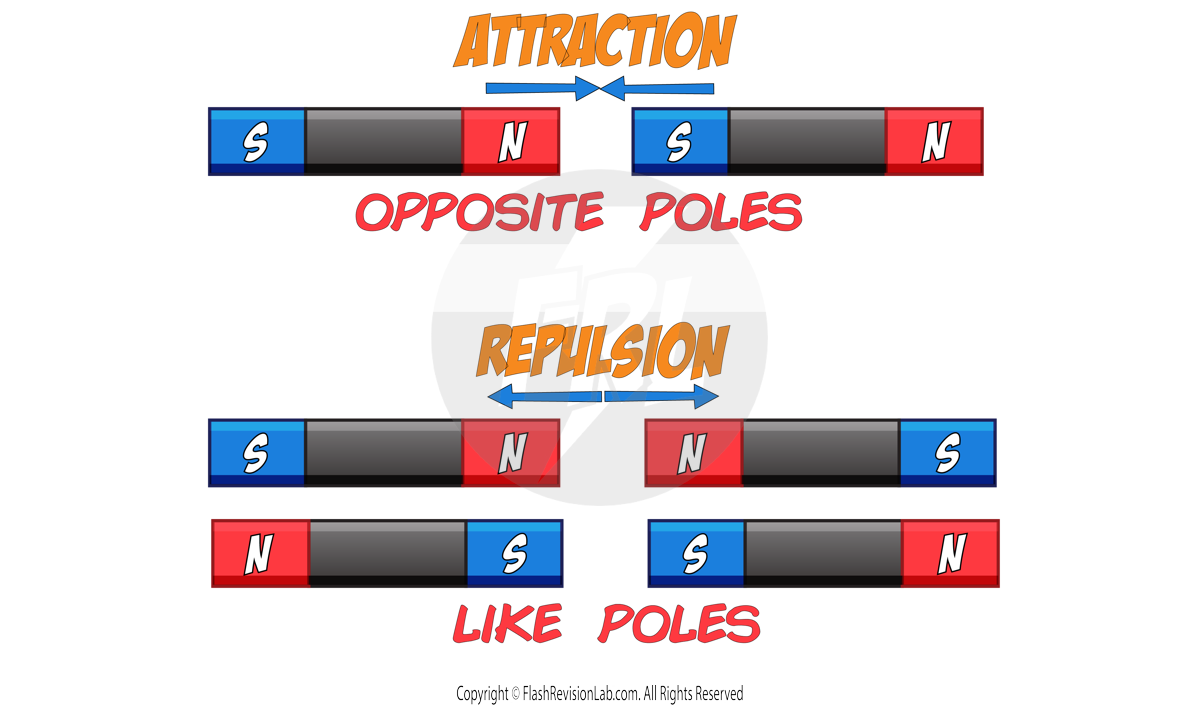
- LIKE POLES (North to North or South to South) repel each other.
- UNLIKE POLES (North to South) attract each other.
Permanent and Induced Magnets
There are FOUR types of MAGNETIC MATERIALS:
1. IRON
2. STEEL
3. NICKEL
4. COBALT
There are TWO types of magnets:
1. PERMANENT MAGNETS: These are objects that produce their own magnetic field.
2. INDUCED MAGNETS: These are magnetic materials that become magnetised in the presence of a magnetic field but typically lose most of their magnetism when the field is removed.
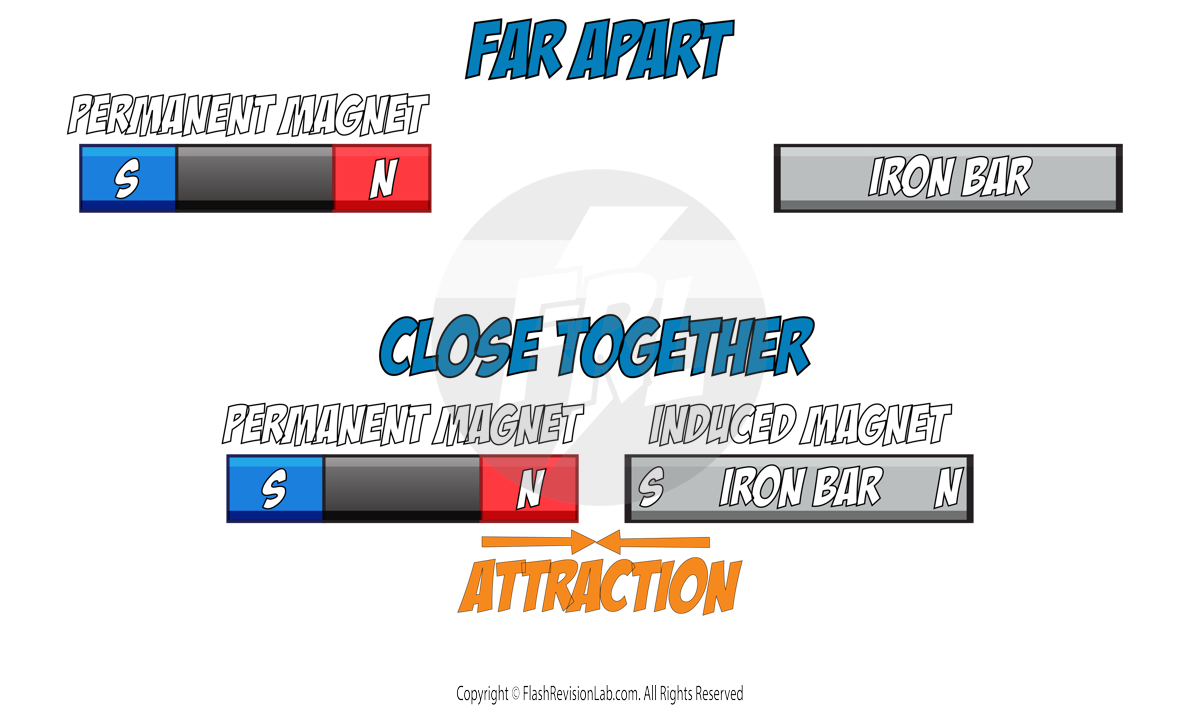
When you bring a MAGNETIC MATERIAL within the magnetic field of a PERMANENT magnet, it will TEMPORARILY produce its OWN magnetic field and turn into an INDUCED MAGNET.
The INDUCED MAGNET will always produce poles that cause ATTRACTION.
E.g. If you bring a SOUTH POLE close to it, the side closest to the South pole will turn into a NORTH POLE to cause ATTRACTION, and vice versa.
If you remove the material from the field, it will lose its magnetism.
Magnetic Fields
A magnetic field is a region of space where one of the following experiences a force:
- A MAGNET.
- A MAGNETIC MATERIAL (Iron, Steel, Nickel, Cobalt).
- A CURRENT CARRYING WIRE.
Magnetic fields are INVISIBLE, but they can be represented on diagrams using FIELD LINES.
Magnetic Field lines are lines with ARROWS that always point:

- AWAY from a NORTH pole.
- TOWARDS a SOUTH pole.
This is because the direction of the magnetic field at any point is given by the direction of the FORCE that would act on another NORTH pole placed at that point.
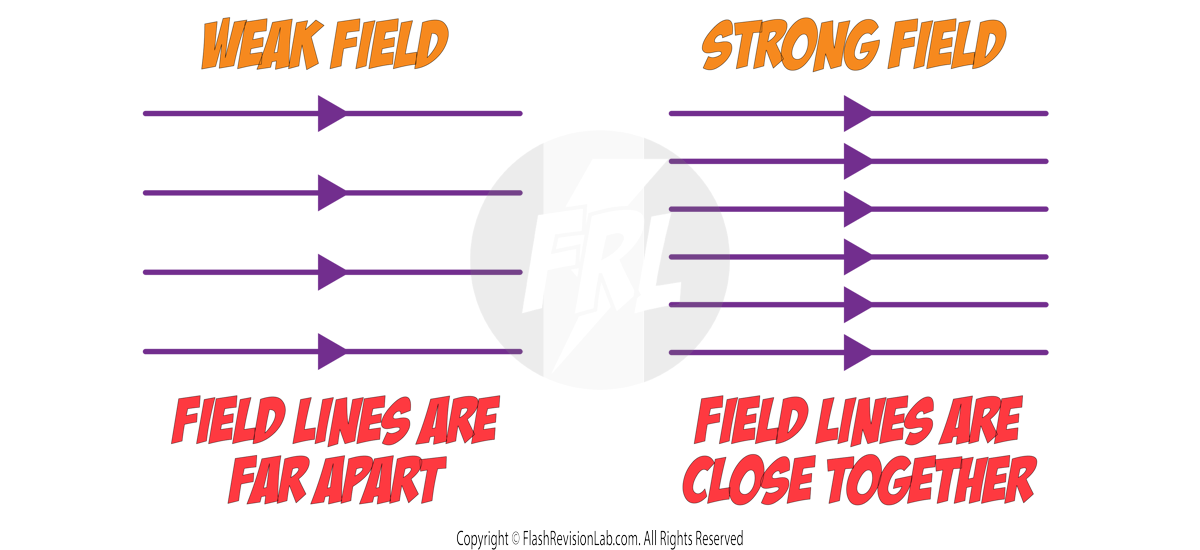
The CLOSER the field lines are, the STRONGER the field at that point.
The magnetic field around a BAR MAGNET looks like this:
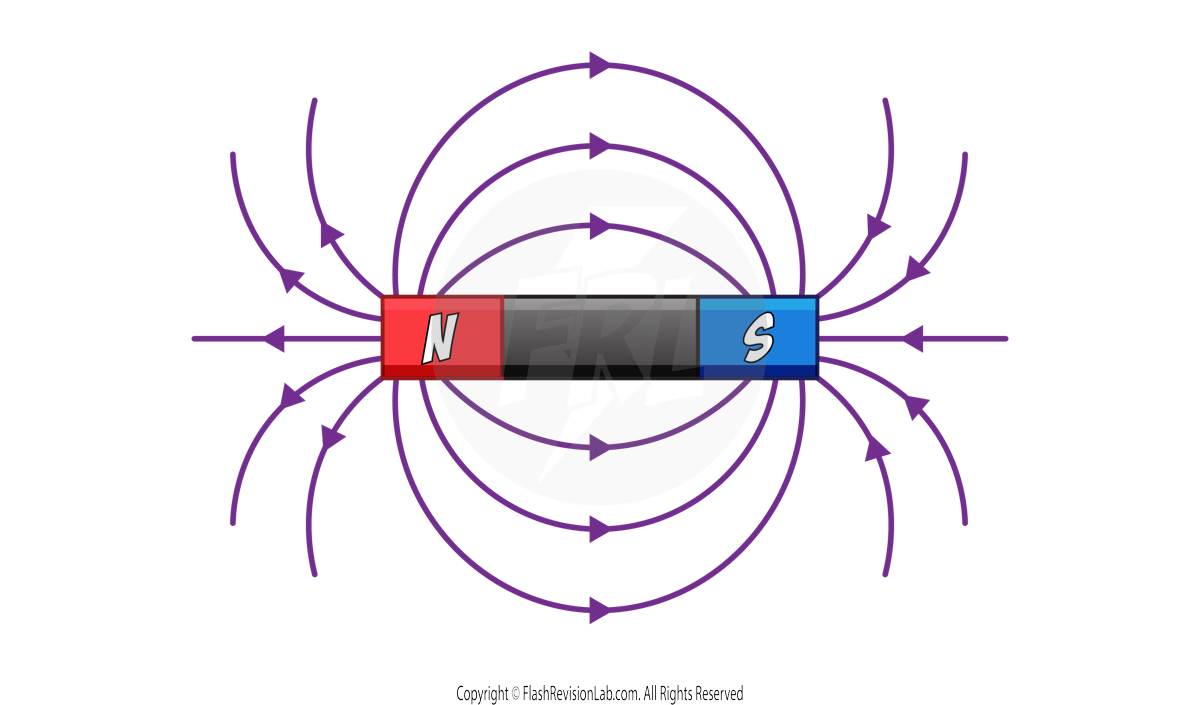
The field lines are the CLOSEST near the POLES of the magnet, which shows that the field is the STRONGEST at those points.
Observing a Magnetic Field
Magnetic field lines CANNOT be seen, but we can plot their patterns by using a COMPASS.

A magnetic compass contains a small bar magnet which lines up with any magnetic field that it is placed within.
The Earth itself has its own magnetic field, so the needle of a compass points in the direction of the Earth’s magnetic field when placed away from any magnets.
If it is placed CLOSE to another magnet, it lines up in the direction of the MAGNET’S field instead of the Earth's.
We can use a compass to plot the pattern of a MAGNETIC FIELD by carrying out the following steps:
STEP 1: Place a bar magnet on a piece of paper and DRAW a DOT near the corner of the magnet.
STEP 2: Place a compass next to the dot and DRAW a SECOND DOT in the direction that the compass points.
STEP 3: Move the compass at the position of the SECOND DOT and draw a THIRD DOT in the direction that the compass points.
STEP 4: Repeat this process and JOIN the dots with a smooth curve to reveal a FIELD LINE. The direction of the compass gives the DIRECTION of the FIELD.
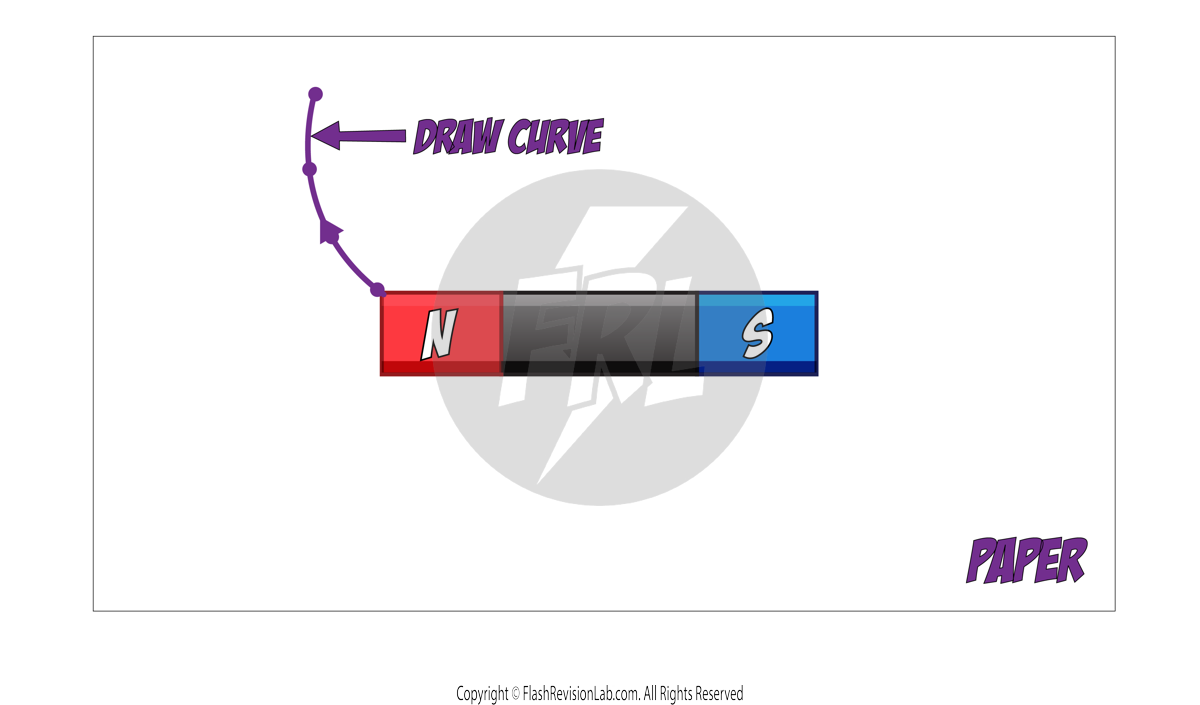
STEP 5: REPEAT this process several times to reveal more FIELD LINES.
Electromagnetism
When current flows through a conducting wire, a MAGNETIC FIELD is produced around the wire.
This field is in the shape of CONCENTRIC CIRCLES that are PERPENDICULAR to the wire.
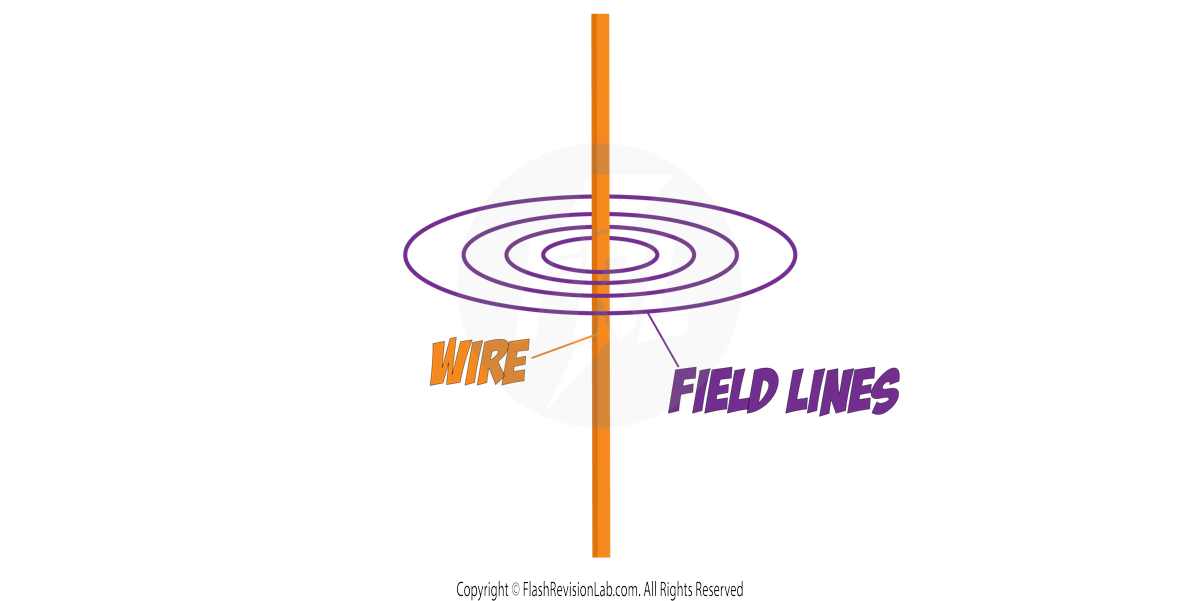
You can increase the STRENGTH of this field by INCREASING the CURRENT flowing through the wire.
The STRENGTH of the field DECREASES as you get FURTHER from the wire.
The Right Hand Grip Rule
Wires do NOT have NORTH and SOUTH poles, so to work out the DIRECTION of the FIELD, you need to use the RIGHT HAND GRIP RULE.
To use this rule, you need to hold your RIGHT HAND like a ‘thumbs up’:
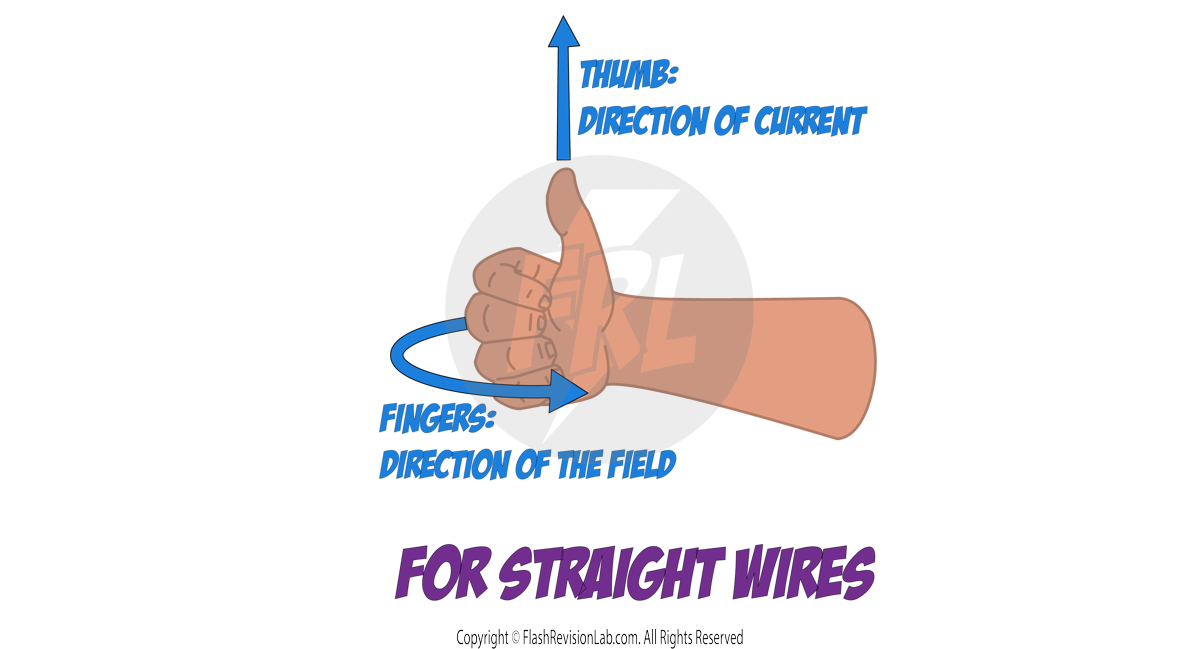
The direction the THUMB points in represents the direction the CURRENT flows in.
The direction the FINGERS point in represents the direction of the FIELD.
Let's look at the following example where we’re given the DIRECTION of the CURRENT as UP the page.
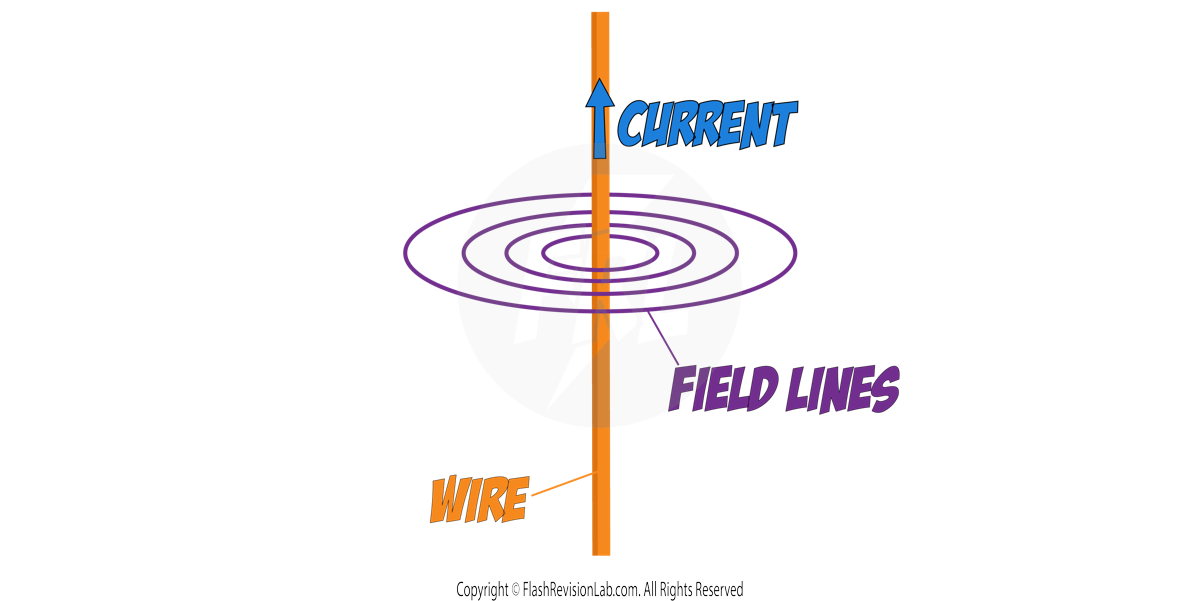
You get your RIGHT HAND in the ‘thumbs up’ pose and LINE UP your THUMB with the direction of the CURRENT, which is UP THE PAGE in this case.
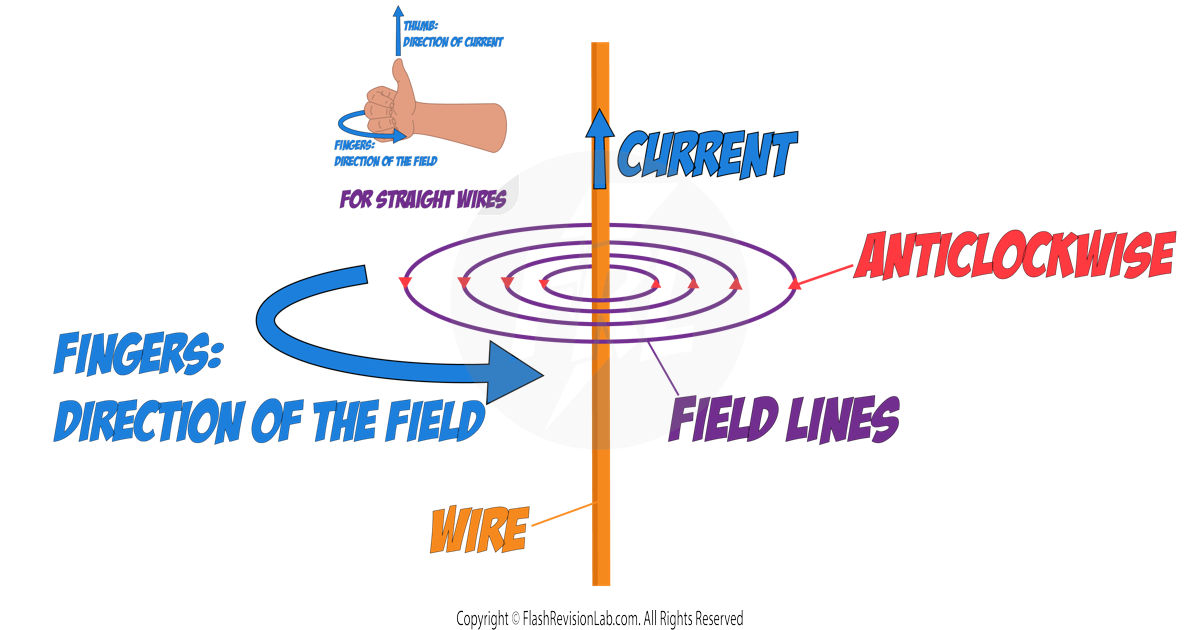
From this, you can look at your fingers and see that the field is pointing ANTICLOCKWISE in the diagram.
Solenoids
Another way to INCREASE the STRENGTH of the FIELD in a CURRENT-CARRYING WIRE, is to turn the STRAIGHT wire into a COILED wire.
A coiled wire is known as a SOLENOID.
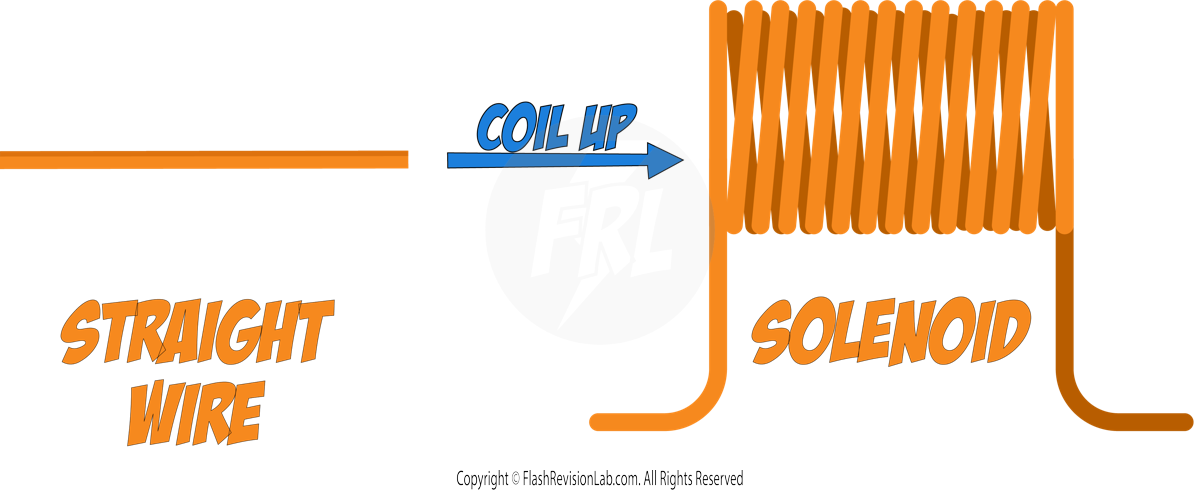
The FIELD of a solenoid looks very similar to that of a BAR MAGNET on the OUTSIDE of the coil.
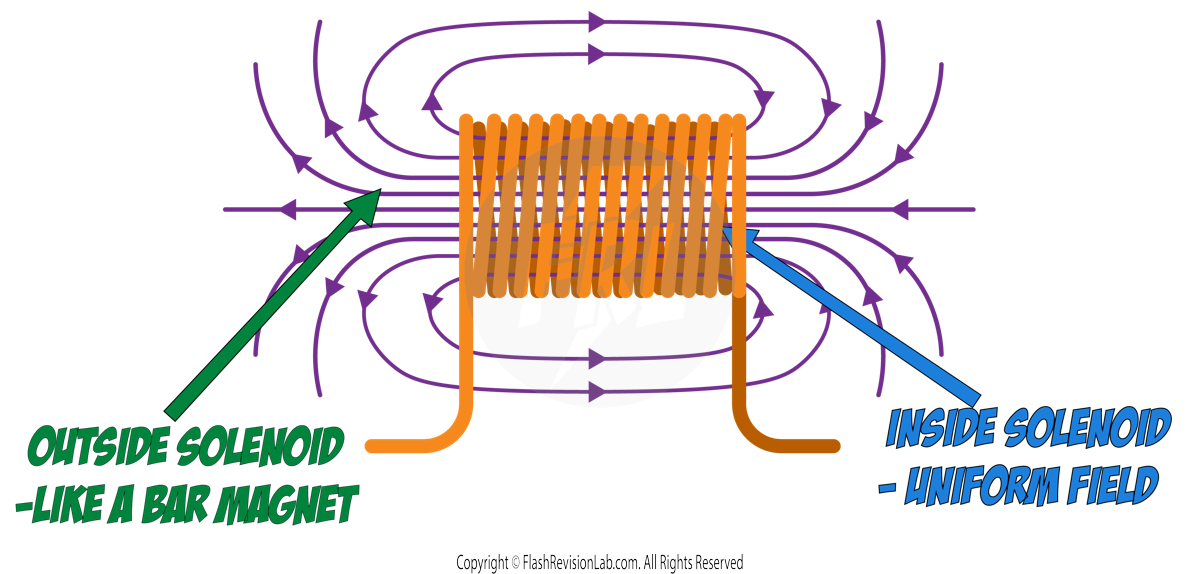
The field INSIDE the coil consists of STRAIGHT FIELD LINES spaced EQUALLY apart which is known as a UNIFORM FIELD. In a UNIFORM FIELD, the strength of the field is the SAME everywhere.
You can use the RIGHT HAND GRIP RULE again to find the DIRECTION of the field.
This time:
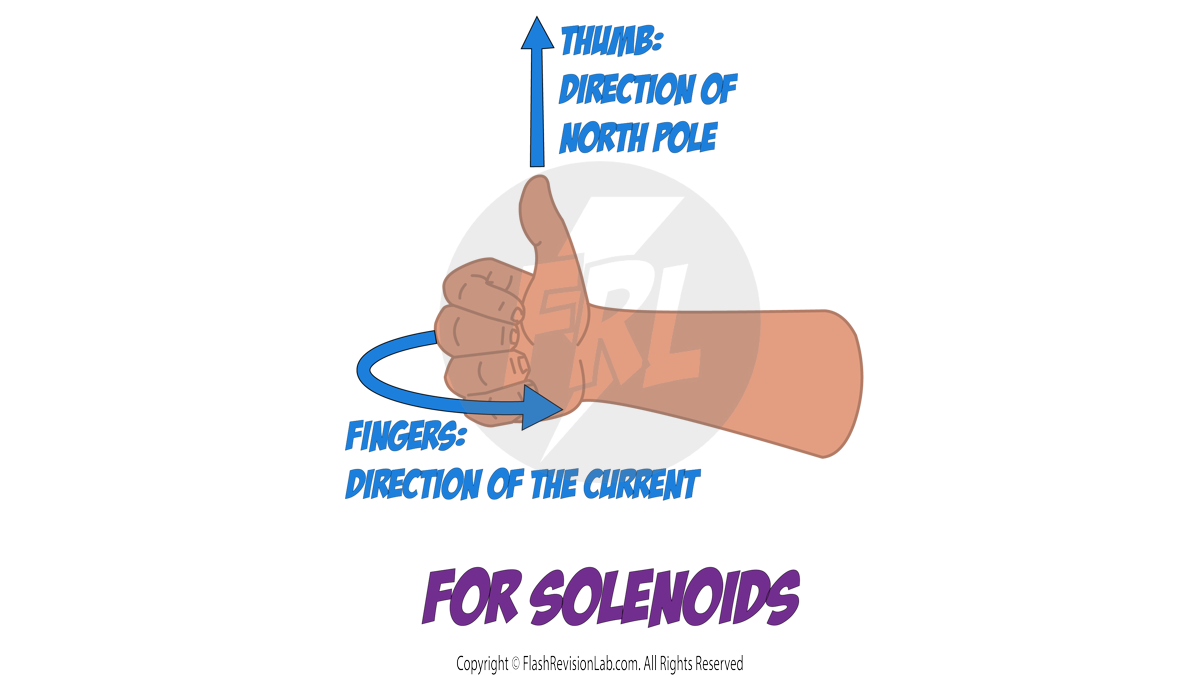
The direction the FINGERS point in represents the direction of the CURRENT.
The direction the THUMB points in represents the direction of the NORTH POLE.
Let's look at an example where we know the direction of a solenoid's CURRENT and we need to find the direction of the FIELD:
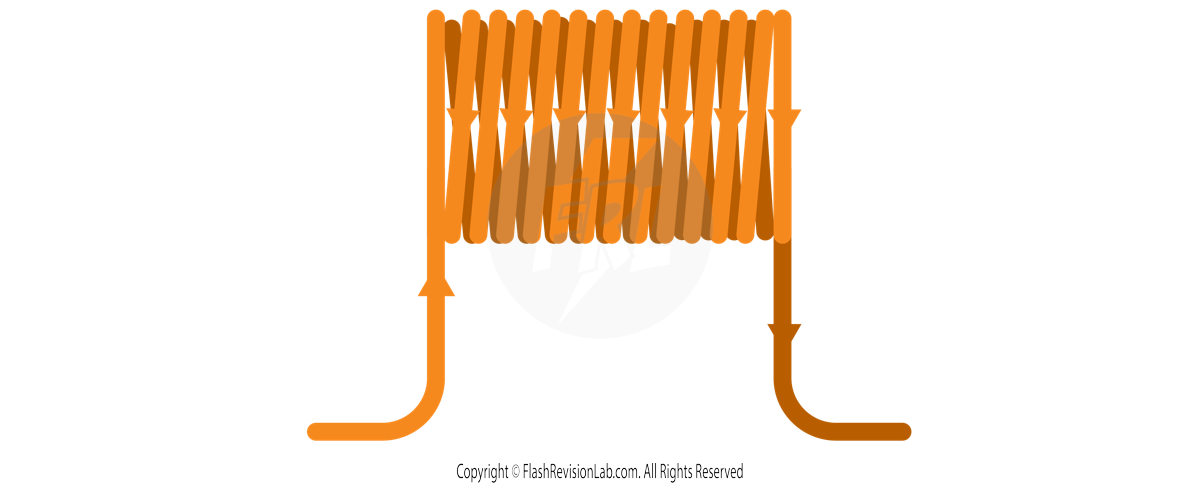
You line up your fingers in the same direction that the CURRENT in the solenoid flows in and see which way your thumb points.
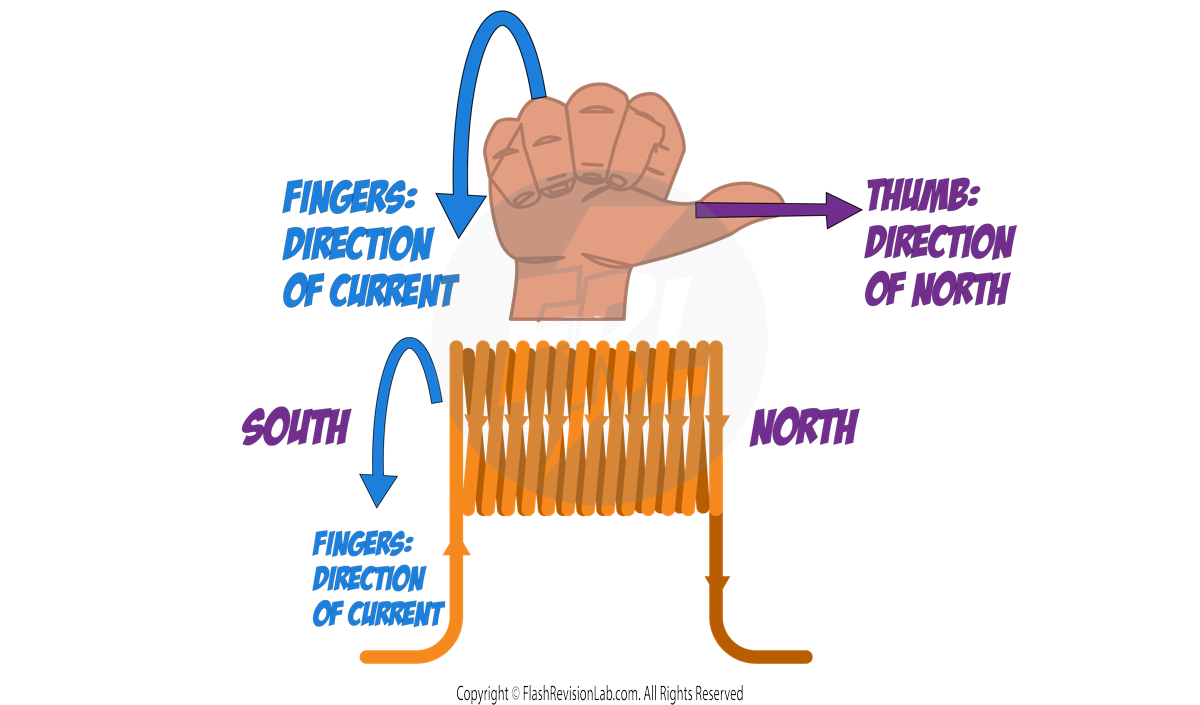
The direction your THUMB points in acts as the NORTH POLE of the solenoid, meaning all field lines point AWAY from it, and the other end acts as a SOUTH POLE and all field lines point TOWARDS it.
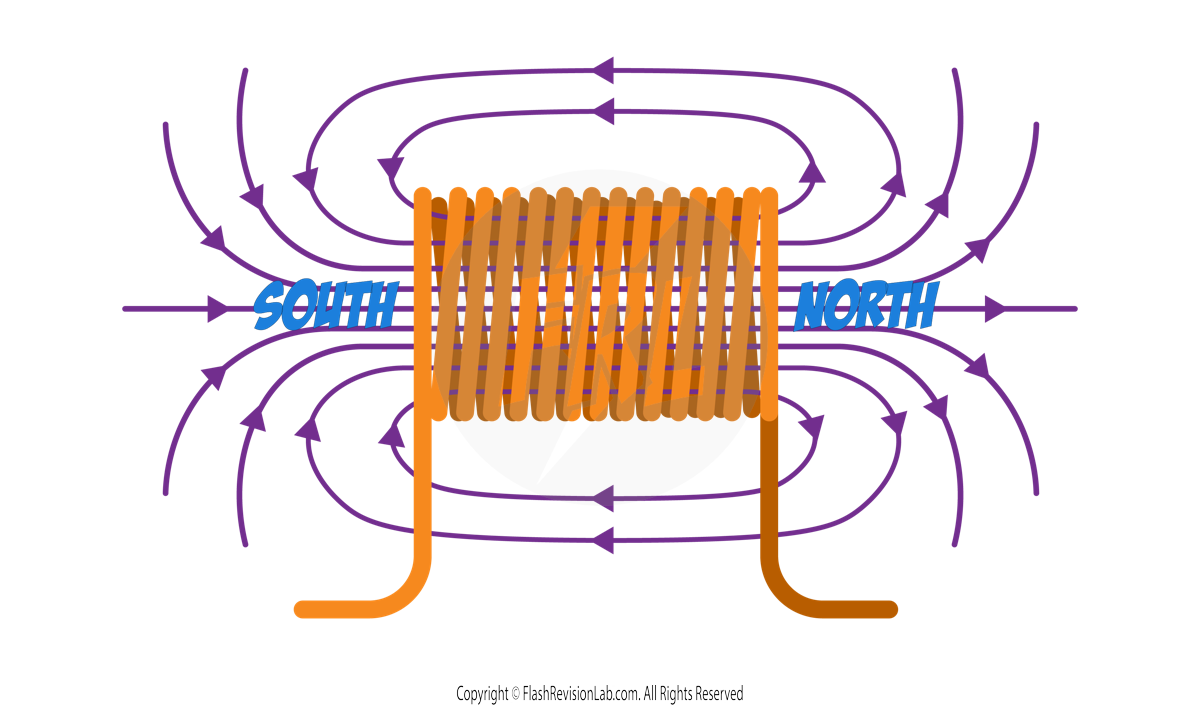
Electromagnets
You can increase the STRENGTH of a solenoid by adding an IRON CORE in the middle of it. This turns the iron core into an ELECTROMAGNET.
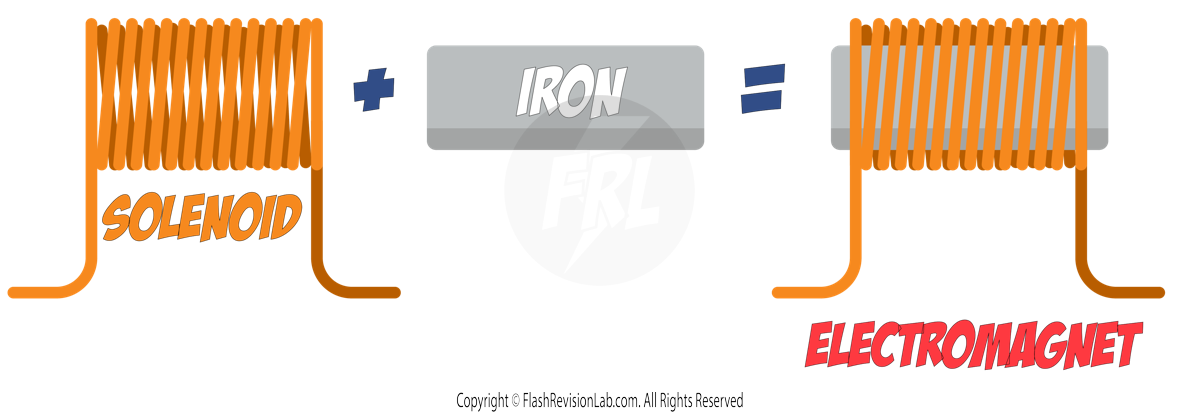
An ELECTROMAGNET is a MAGNET that can be turned ON and OFF.
When current flows through the solenoid, it MAGNETISES the IRON CORE, causing it to produce a MAGNETIC FIELD. As soon as this current is STOPPED, the iron core becomes DEMAGNETISED.
As an example, let’s look at an electromagnet with NO current flowing through it near a few paper clips.
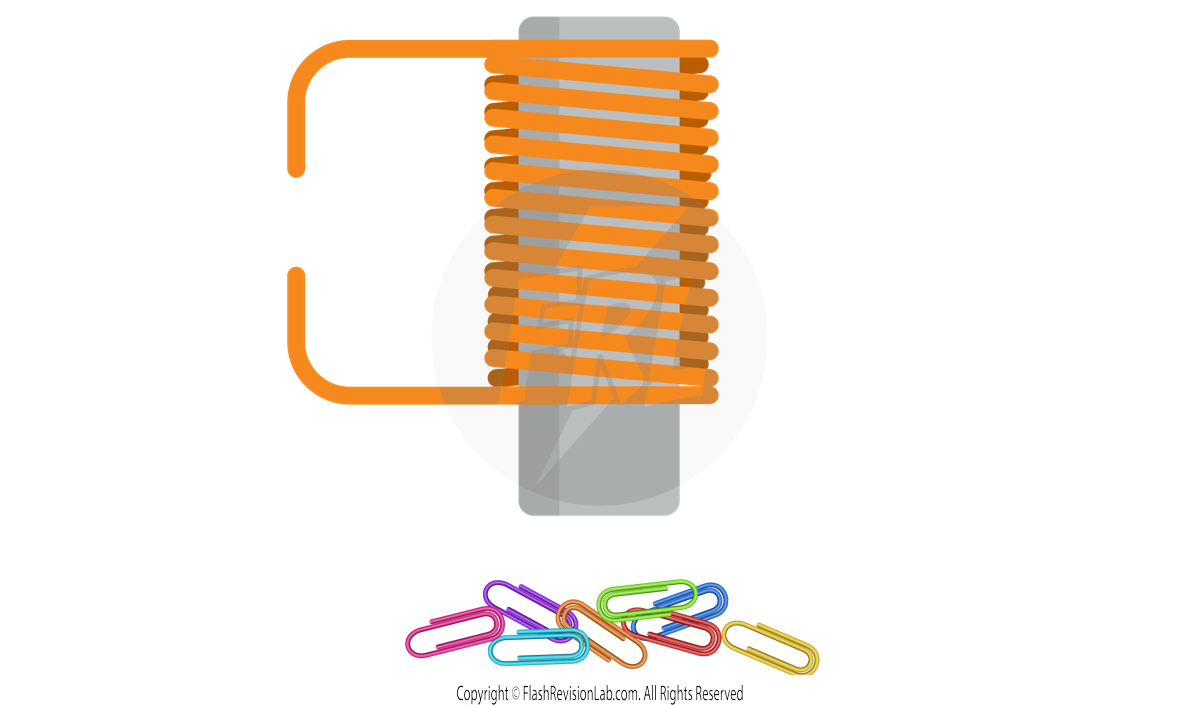
Nothing will occur as NO magnetic field is present, however when a power source is connected to the solenoid and CURRENT flows through it, the iron core becomes MAGNETISED and creates a force of ATTRACTION which picks up the paper clips.
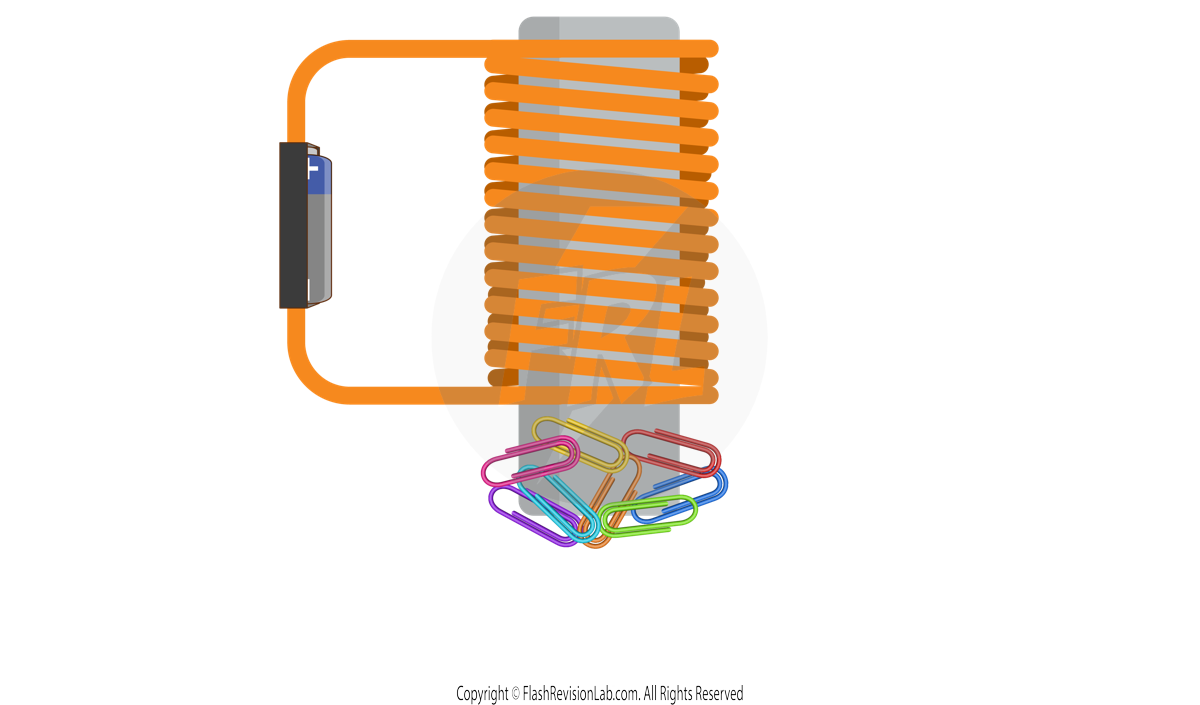
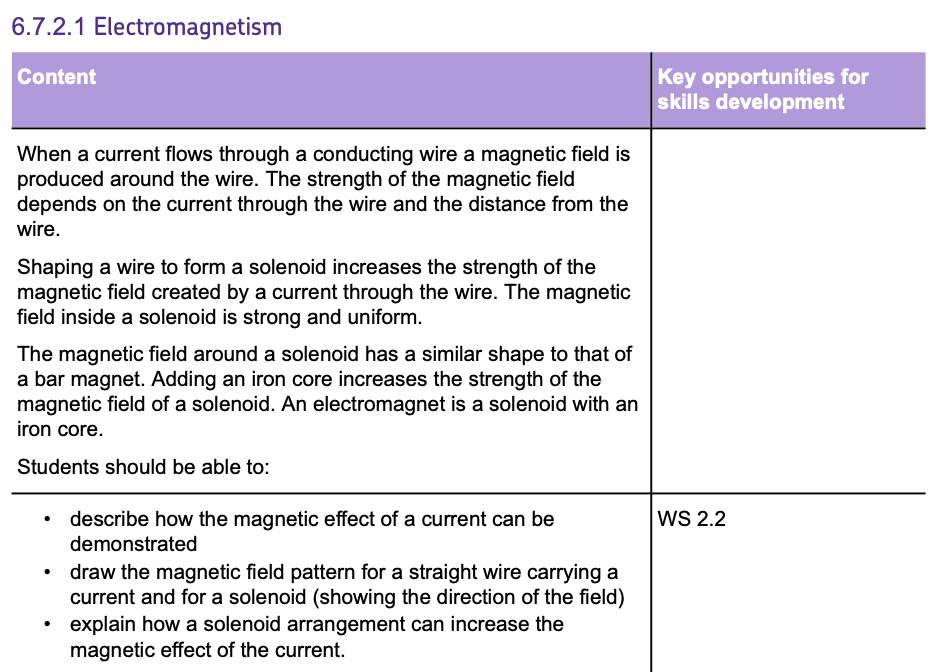
The Motor Effect
Both MAGNETS and CURRENT-CARRYING CONDUCTING WIRES create their own MAGNETIC FIELD.
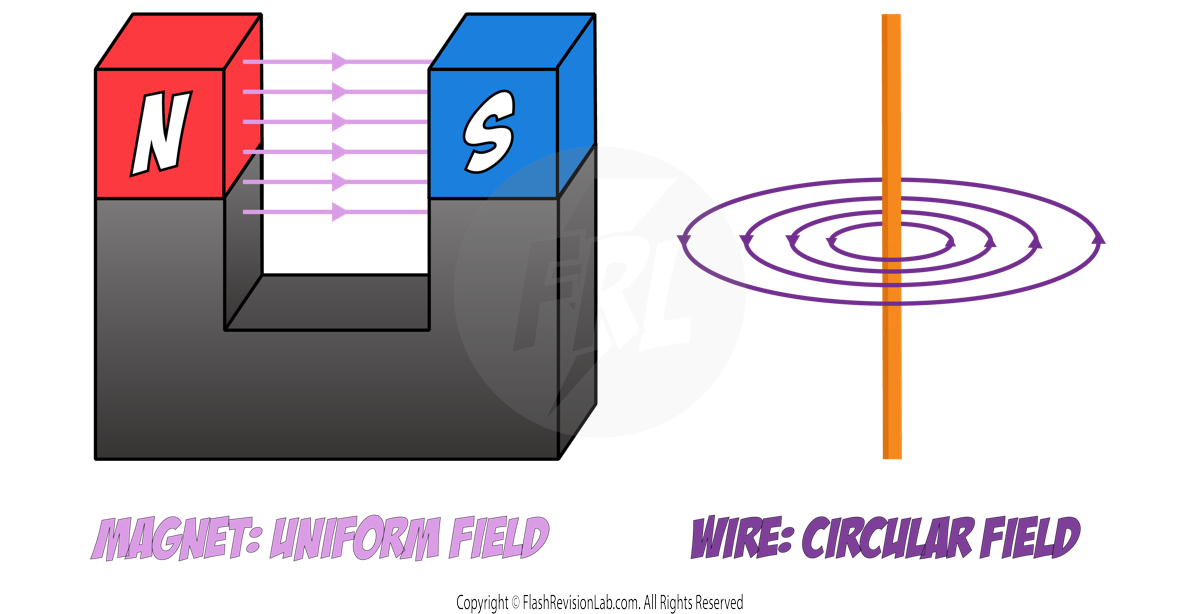
Therefore, when a CURRENT-CARRYING CONDUCTOR is placed in a magnetic field of a MAGNET, both fields INTERACT with each other to create a FORCE. This is known as the MOTOR EFFECT.
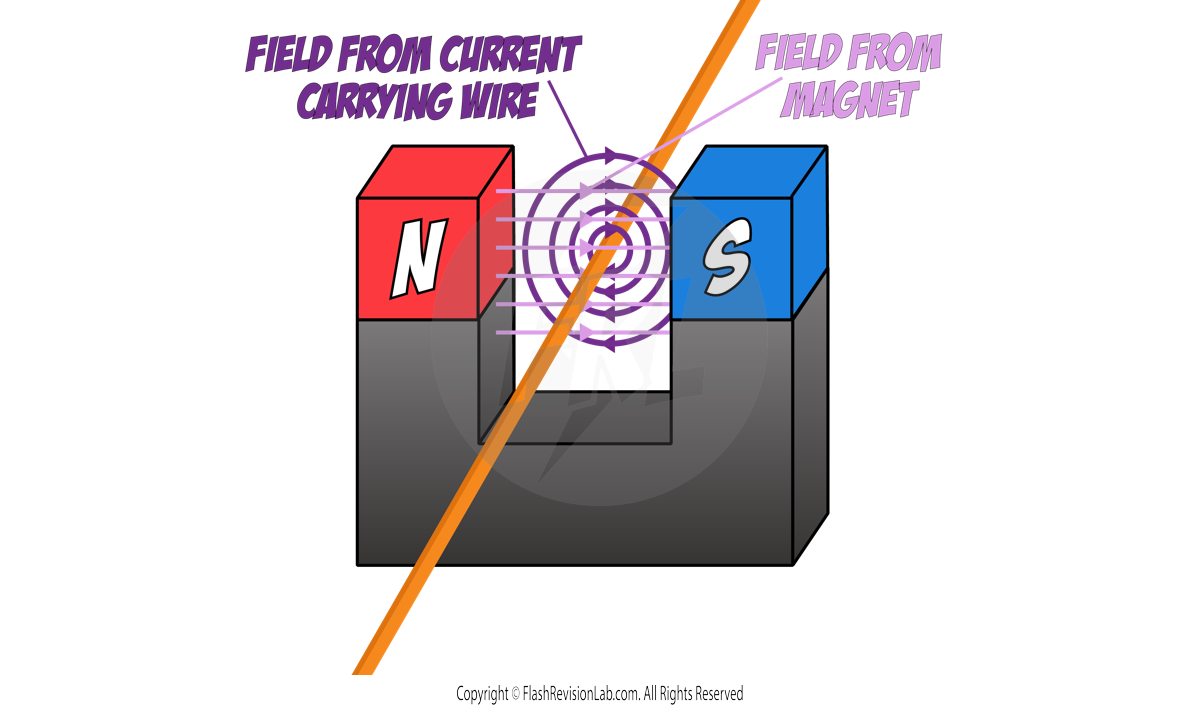
The MAGNITUDE of the force can be INCREASED by:
- INCREASING the MAGNETIC FLUX DENSITY of the field (the strength).
- INCREASING the CURRENT.
To calculate the MAGNITUDE of the force, you can use the following equation:
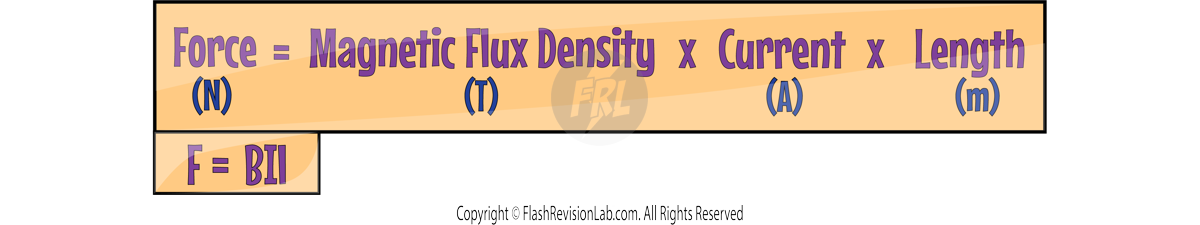
Where:
- F is the force measured in N.
- B is the MAGNETIC FLUX DENSITY measured in TESLA (T). This tells you the strength of the magnetic field.
- I is the current measured in A.
- l is the length of the wire in the field measured in m.
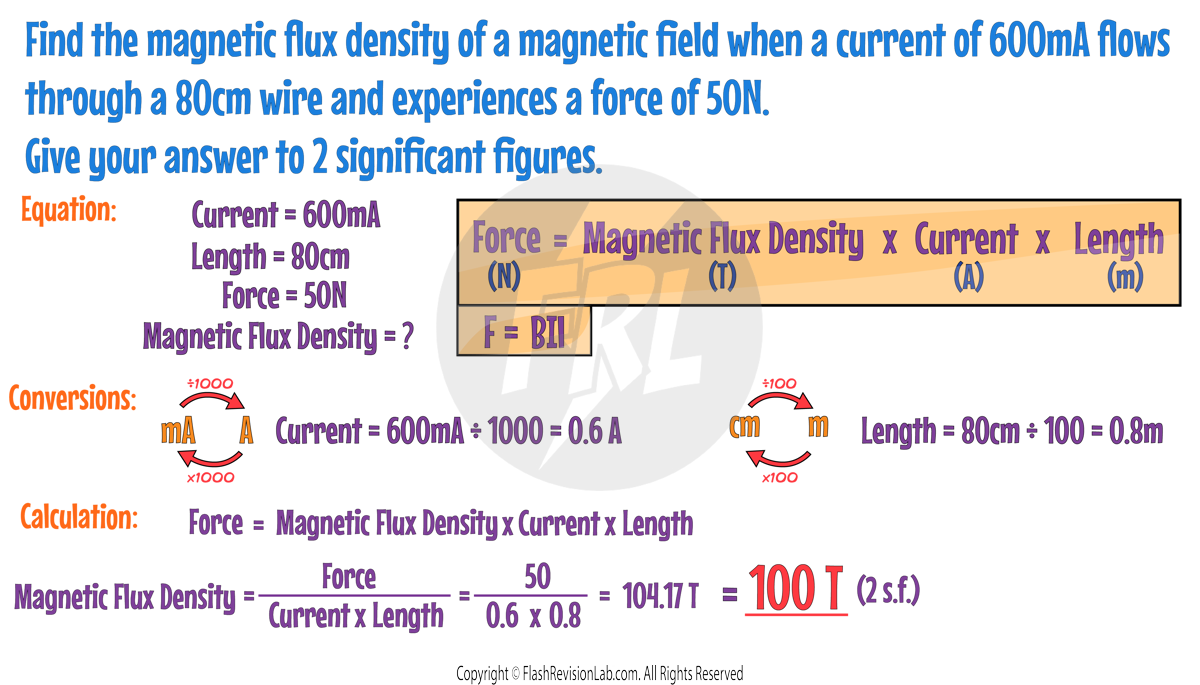
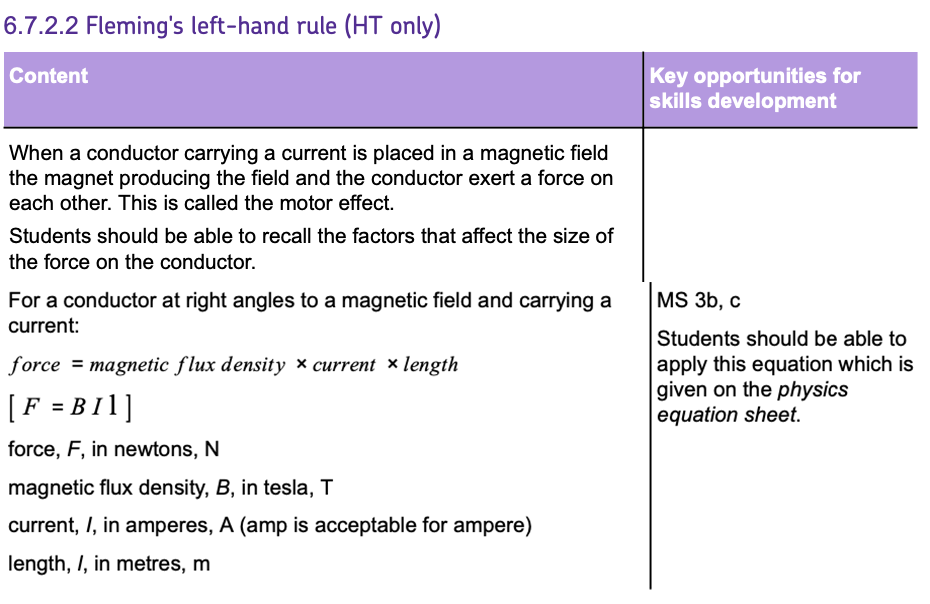
Fleming’s Left Hand Rule
FLEMING’S LEFT HAND RULE is used to work out the DIRECTION of the FORCE created by the MOTOR EFFECT.
To use FLEMING’S LEFT HAND RULE, you need to hold your LEFT HAND with your THUMB, FIRST FINGER, and SECOND FINGER all PERPENDICULAR to each other:
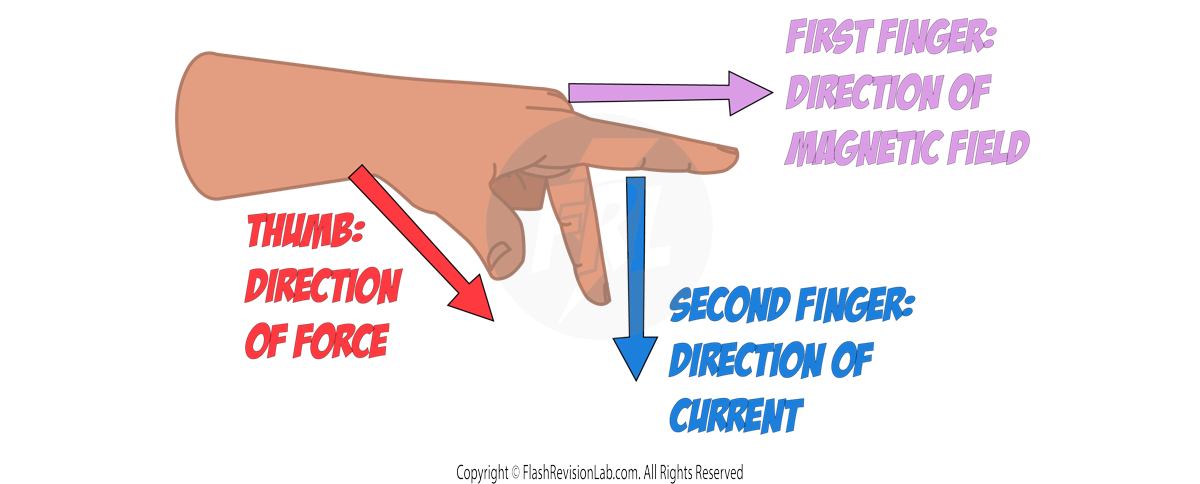
- The direction the FIRST FINGER points in represents the direction of the MAGNETIC FIELD (from the NORTH POLE to the SOUTH POLE).
- The direction the SECOND FINGER points in represents the direction the CURRENT flows in.
- The direction the THUMB points in represents the direction of the FORCE.
Keeping all three of these PERPENDICULAR, you need to first line up the FIRST and SECOND finger with the FIELD and CURRENT in a diagram.
Then whatever direction your THUMB points in, tells you the direction the FORCE acts in. This usually means the wire will MOVE in that direction.
Let’s look at an example:
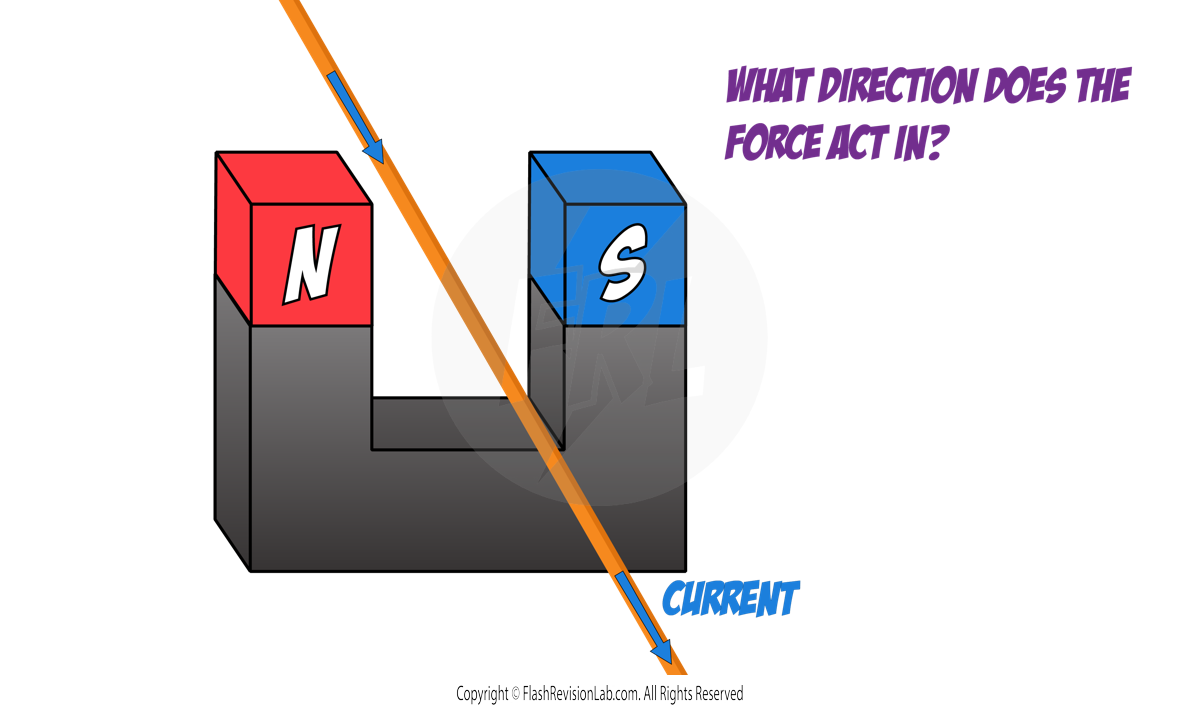
To find the direction the FORCE acts in, you need to first use FLEMING’S LEFT HAND RULE, and ROTATE your hand so it lines up with the field in the diagram.
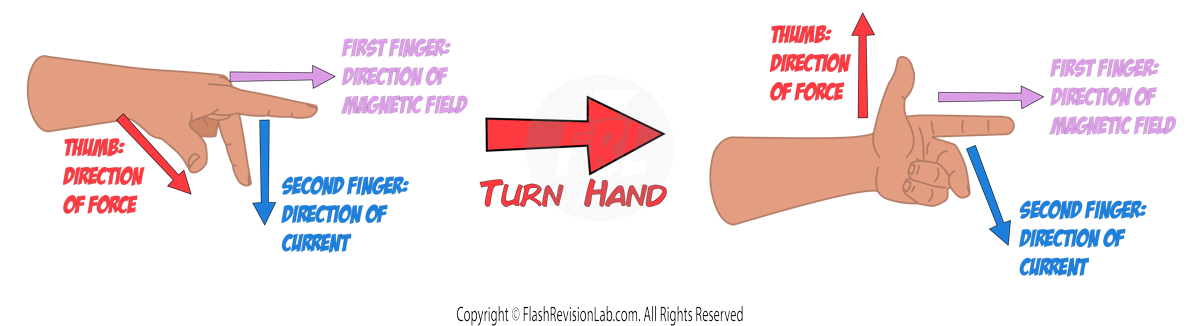
The field points to the RIGHT as field lines always point AWAY from NORTH POLES and TOWARDS SOUTH POLES.
Now you can line up your FIRST finger with the FIELD and your SECOND FINGER with the CURRENT which is coming OUT of the page in this diagram.
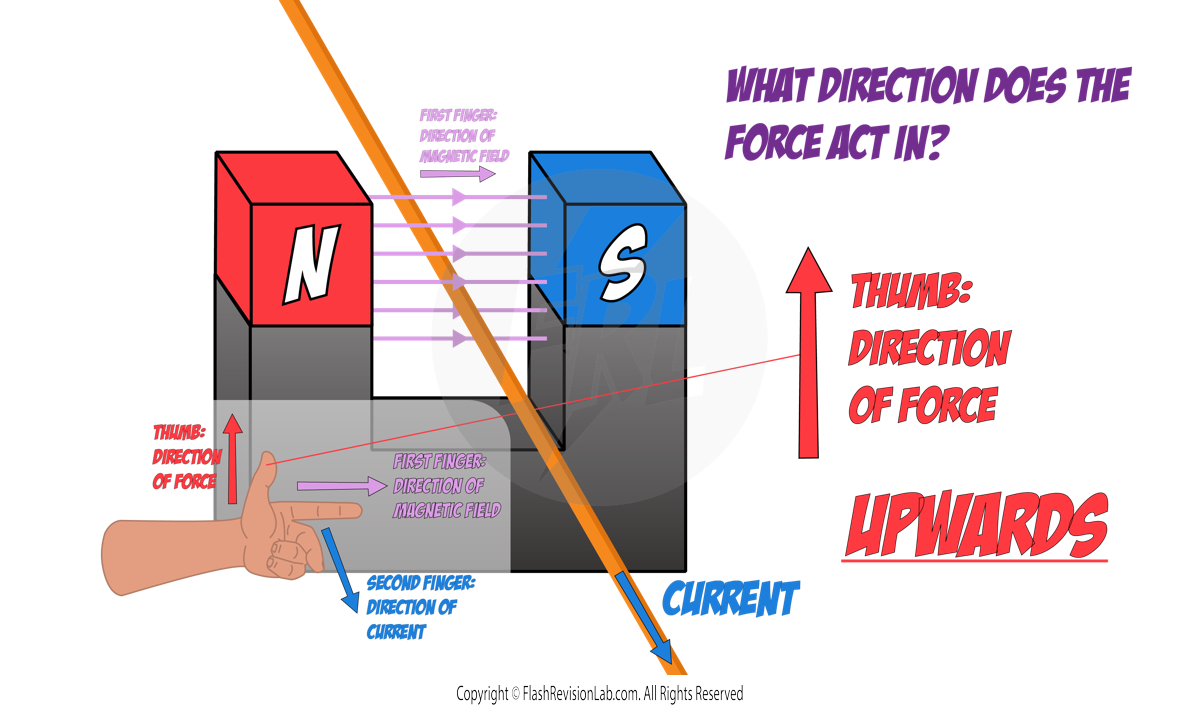
After lining these two up, you can see that the thumb points UPWARDS, which means the force acts UPWARDS.
Electric Motors
Electric motors are devices that ROTATE when an electrical current passes through them.
The MOTOR EFFECT can be used to explain how they work.
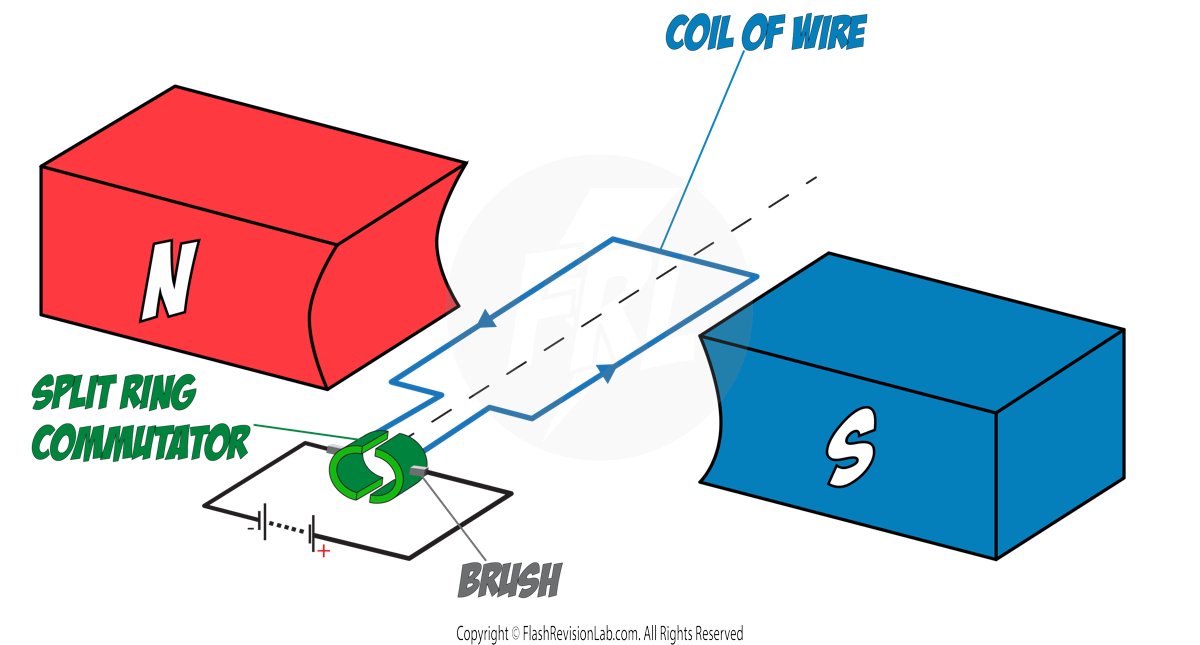
Electric motors consist of a COIL of wire that is free to rotate in a MAGNETIC FIELD between two MAGNETS.
When current flows through the wire, a magnetic field is created around it.
The magnetic field of the WIRE interacts with the magnetic field of the MAGNETS, which causes it to experience a FORCE (the motor effect).
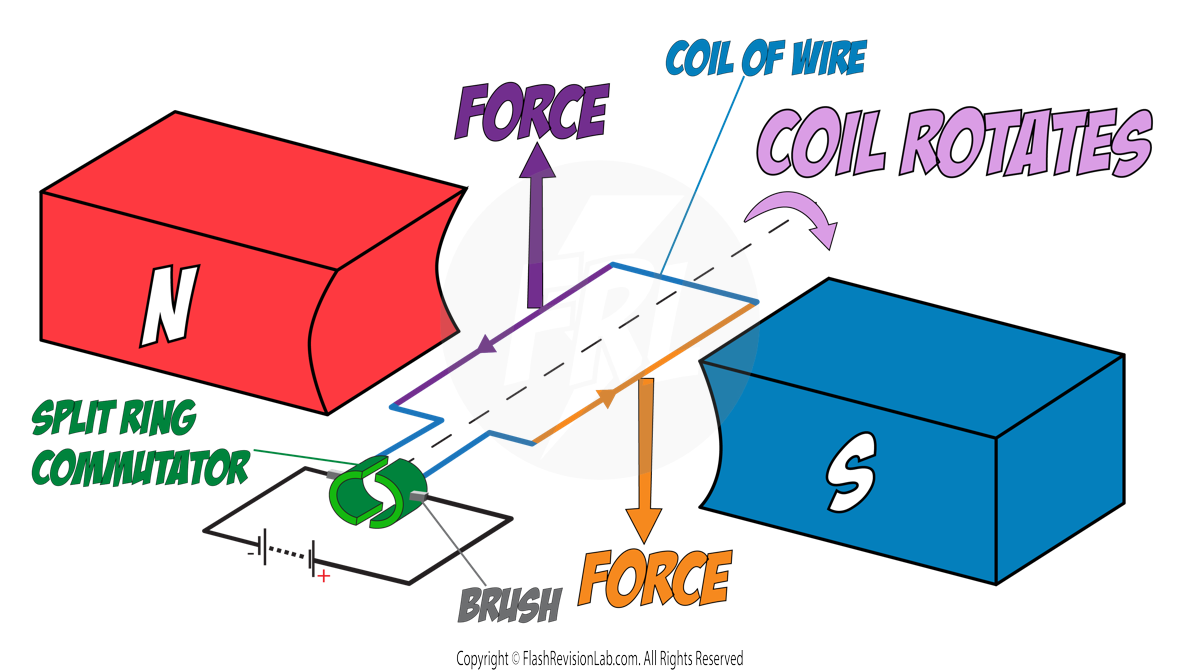
As the wire is in the shape of a COIL, the current either side of the coil, flow in OPPOSITE directions.
This means the FORCE of either side of the wire act in OPPOSITE DIRECTIONS.
This begins a ROTATING MOTION in the coil until the coil is in the VERTICAL POSITION.
At this point, the SPLIT RING COMMUTATOR SWAPS the direction of the current, which SWAPS the direction of the FORCES.
This ensures that the motor can CONTINUE rotating.
The split ring commutator SWAPS the direction of the current every HALF TURN, to keep the motor ROTATING.