


TOPICS
Animal, Plant & Bacteria Cells
Prokaryotic and Eukaryotic Cells
All living things are composed of CELLS.
Cells are classified as either PROKARYOTIC or EUKARYOTIC.
Eukaryotic cells:
- These have a NUCLEUS where their genetic material is stored.
- They are LARGER and MORE COMPLEX than prokaryotic cells.
- eg: Animal Cells & Plant Cells.
Prokaryotic cells:
- These cells do NOT have a nucleus.
- They are usually SMALLER and SIMPLER
- eg. Bacteria Cells.
Key Structures in Eukaryotic Cells
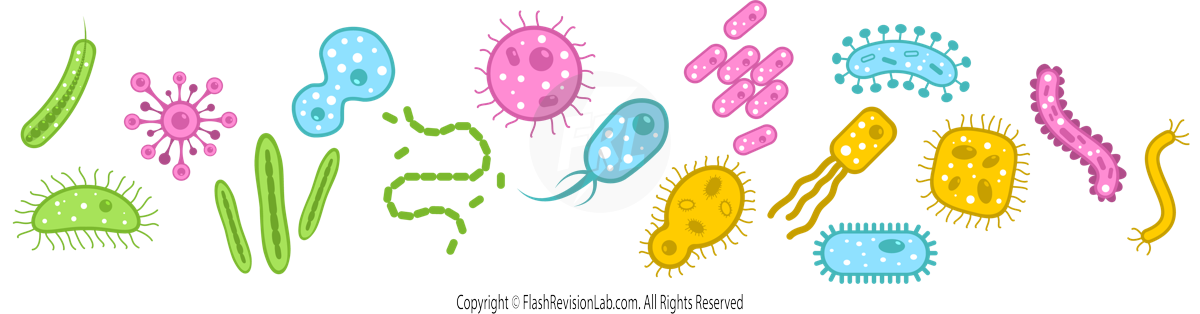
Animal Cells
- Nucleus: Houses GENETIC MATERIAL (DNA) and controls cell activities.
- Cytoplasm: A gel-like substance where CHEMICAL REACTIONS occur.
- Cell Membrane: Controls what enters and exits the cell.
- Mitochondria: The site of AEROBIC RESPIRATION, which releases energy.
- Ribosomes: Where PROTEINS are synthesised.
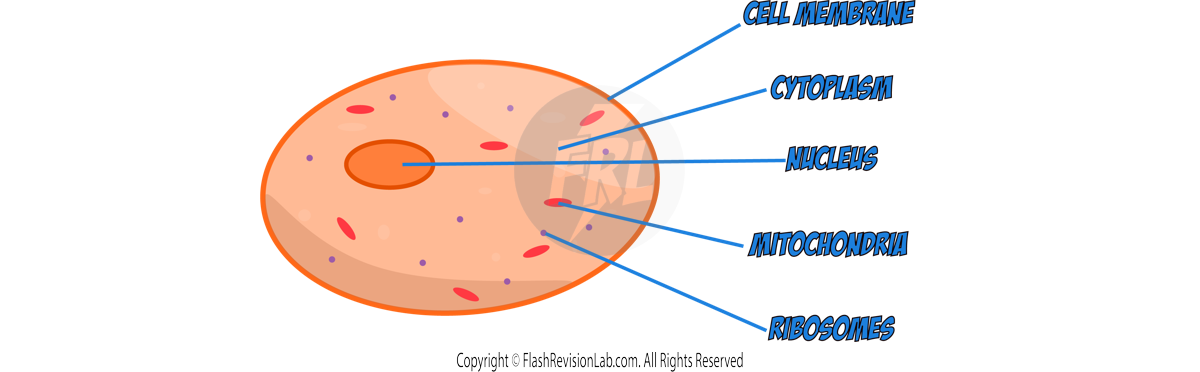
Plant Cells
- Rigid Cell Wall: Composed of CELLULOSE and provides support and structure.
- Permanent Vacuole: Contains CELL SAP which is a storage for sugar and salts.
- Chloroplasts: The location of PHOTOSYNTHESIS. Contains CHLOROPHYLL to absorb light.
Comparing Plant and Animal Cells
- Animal Cells DO NOT have CELL WALLS or CHLOROPLASTS.
- They usually have SMALLER VACUOLES compared to plant cells.
Key Structures in Prokaryotic Cells
Bacterial Cells:
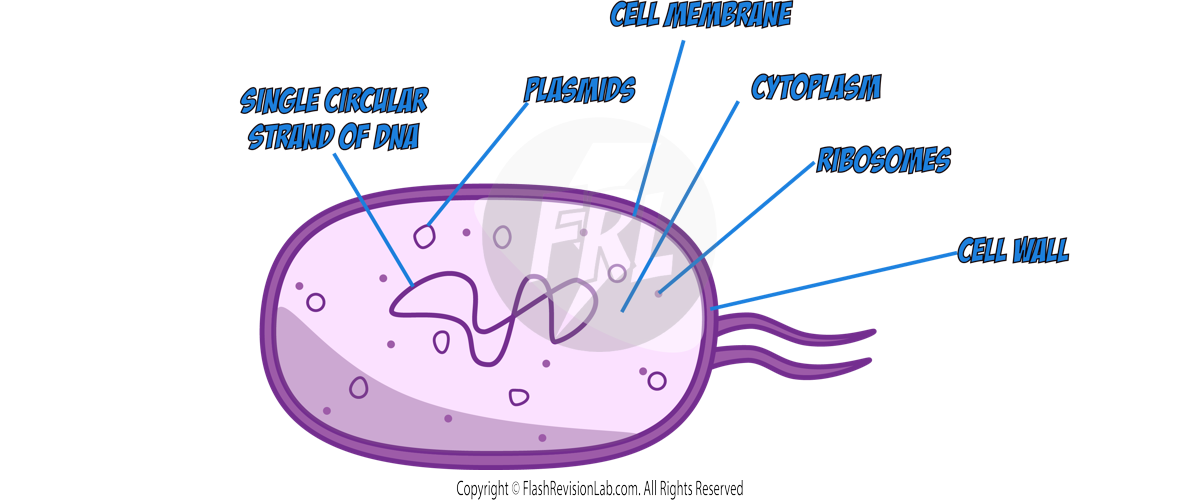
- Bacterial cells are PROKARYOTIC.
- They don’t have a true nucleus, instead, they have a SINGLE CIRCULAR STRAND of DNA.
- Some have additional small rings of DNA called PLASMIDS.
Specialised Cells
Differentiation
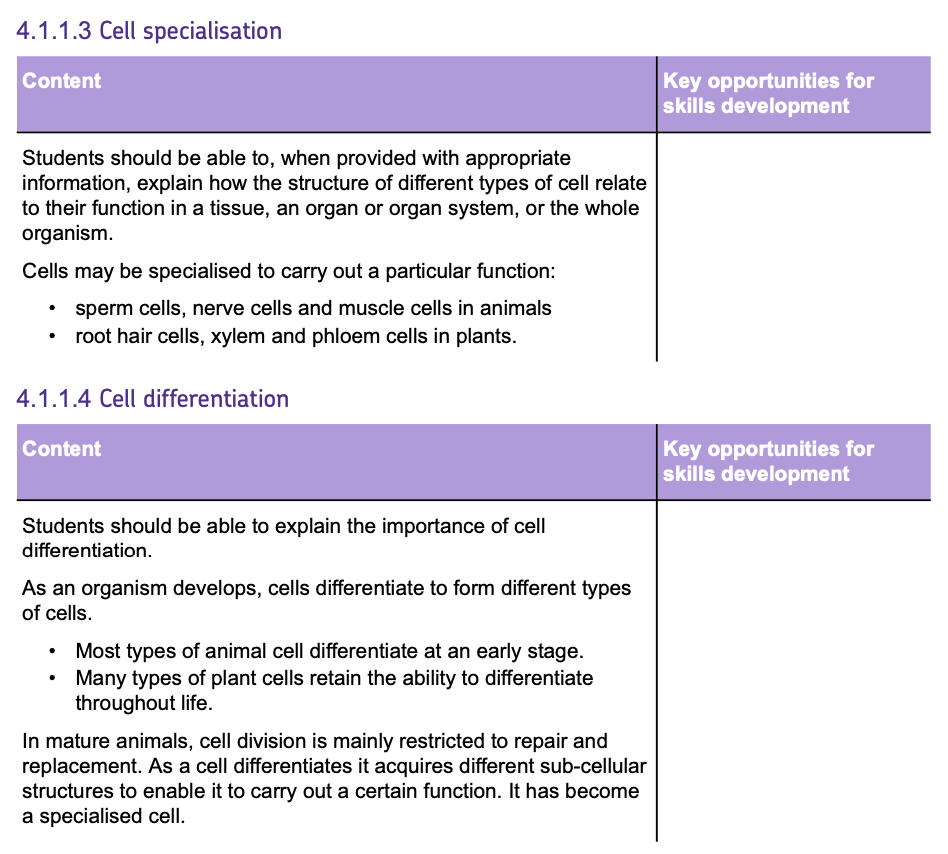
DIFFERENTIATION is the process where a cell transforms into a SPECIALISED CELL for a specific job.
- It involves the development of DIFFERENT SUBCELLULAR STRUCTURES for various functions.
- In animal cells, most differentiation occurs at an early stage as the organism develops.
- In MATURE animals' cells, the ability to differentiate is mainly used for REPAIRING AND REPLACING cells, such as skin or blood cells.
- Plants NEVER lose their ability to differentiate.
- Undifferentiated cells are known as STEM CELLS.
Specialised Cells and Their Functions
Sperm Cells:
Specialised for REPRODUCTION
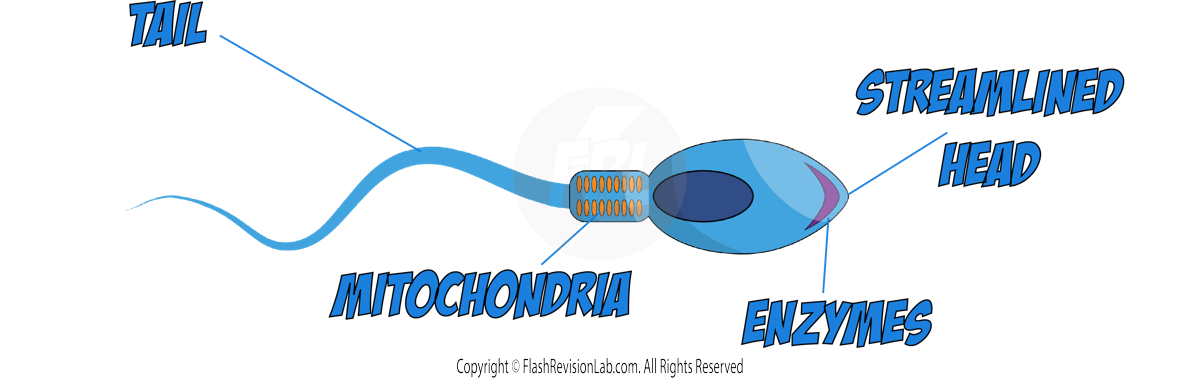
- Designed to deliver male DNA to female DNA.
- They have a LONG TAIL for mobility.
- They have MANY MITOCHONDRIA for energy.
- The head is STREAMLINED to make movement more efficient.
- The head contains ENZYMES that can digest through the membrane of the egg cell.
Nerve Cells:
Specialised for SENDING ELECTRICAL SIGNALS

- Carry messages in the form of electrical signals across the body.
- They are LONG to cover more distance.
- They have BRANCHED CONNECTIONS called Dendrites to create a large network around the body.
Muscle Cells:
Specialised for CONTRACTION
- They are LONG, so they have space to contract.
- They are filled with MANY MITOCHONDRIA to transfer energy for contraction.
Root Hair Cells:
Specialised for ABSORBING WATER AND MINERALS.

- Grow long "hairs" to INCREASE SURFACE AREA for absorption from the soil.
- Contain NO CHLOROPLASTS as they are found underground and do NOT receive light for photosynthesis.
Phloem Cells:
Specialised for TRANSPORTING FOOD SUBSTANCES
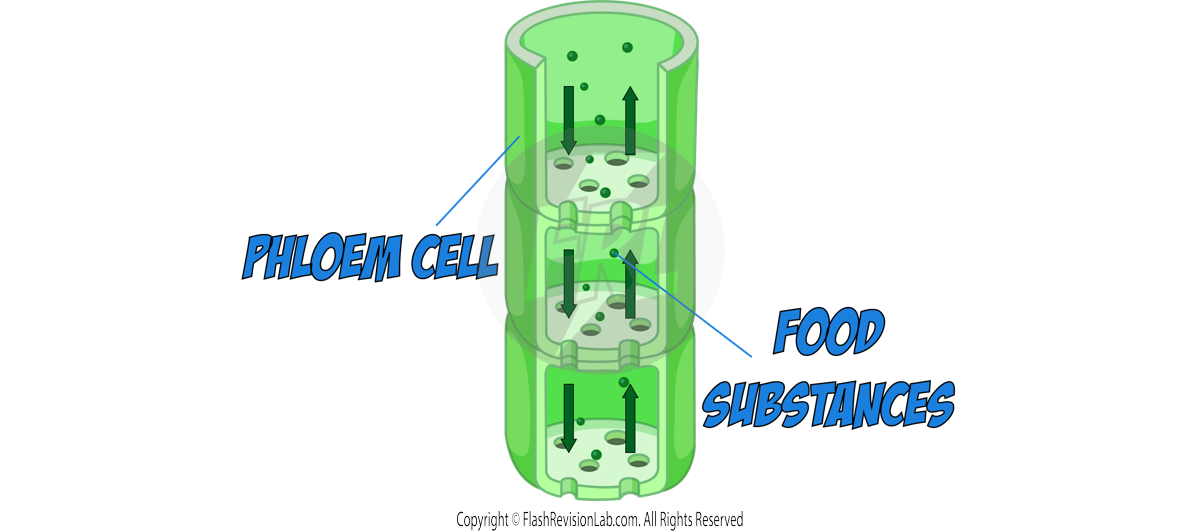
- Cells are joined end to end to form TUBES to transport food in plants.
- They have very FEW SUBCELLULAR STRUCTURES to help substances flow through easily.
Xylem Cells:
Specialised for TRANSPORTING WATER AND MINERALS
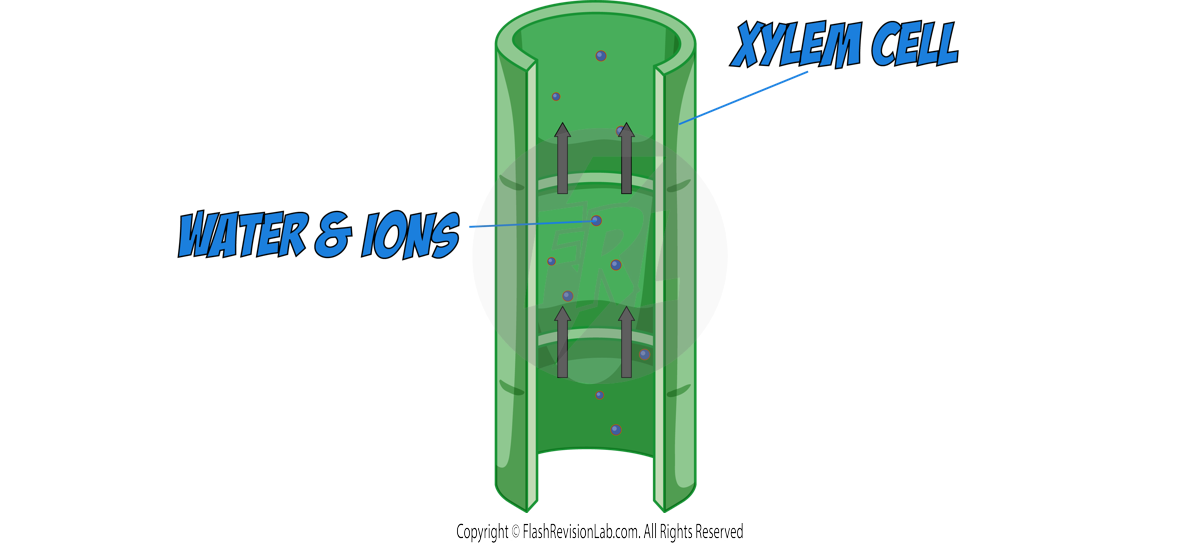
- Cells are joined end to end to form TUBES to transport water and minerals in plants.
- They are HOLLOW for easy flow.
- They are made up of dead cells strengthened with LIGNIN.
Required Practical: Microscopy
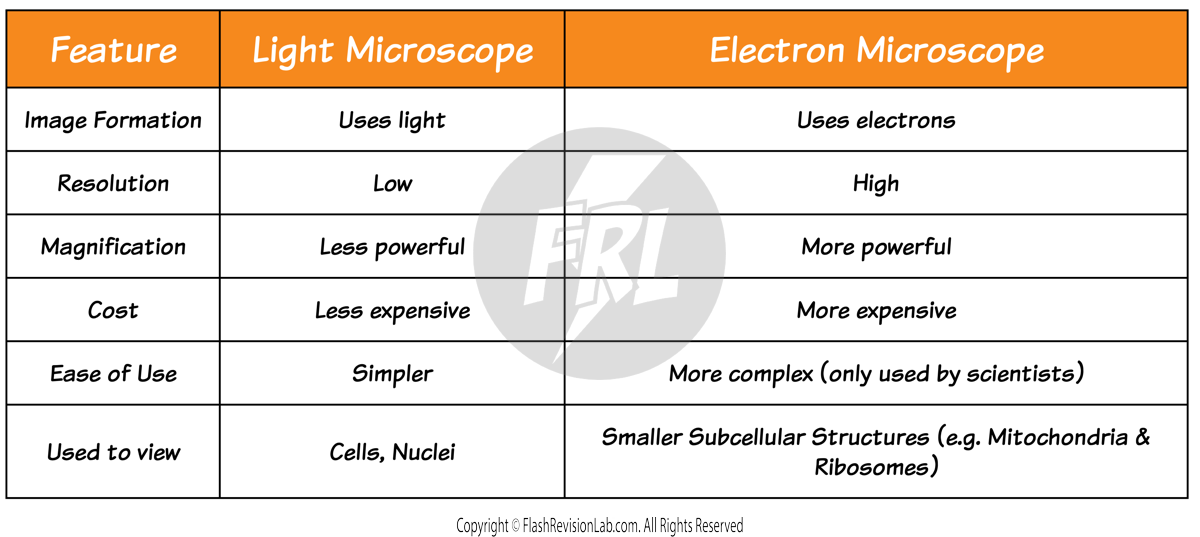
MICROSCOPES are tools that allow us to see the unseen world, revealing structures too small for the naked eye.
There are TWO different types of microscopes, each with its own capabilities:
- LIGHT MICROSCOPES use light and lenses to magnify specimens, allowing us to see individual cells and large subcellular structures like NUCLEI.
- ELECTRON MICROSCOPES use electrons to form an image and can magnify much more than light microscopes. They show us the finer details of cell structures like MITOCHONDRIA and CHLOROPLASTS.
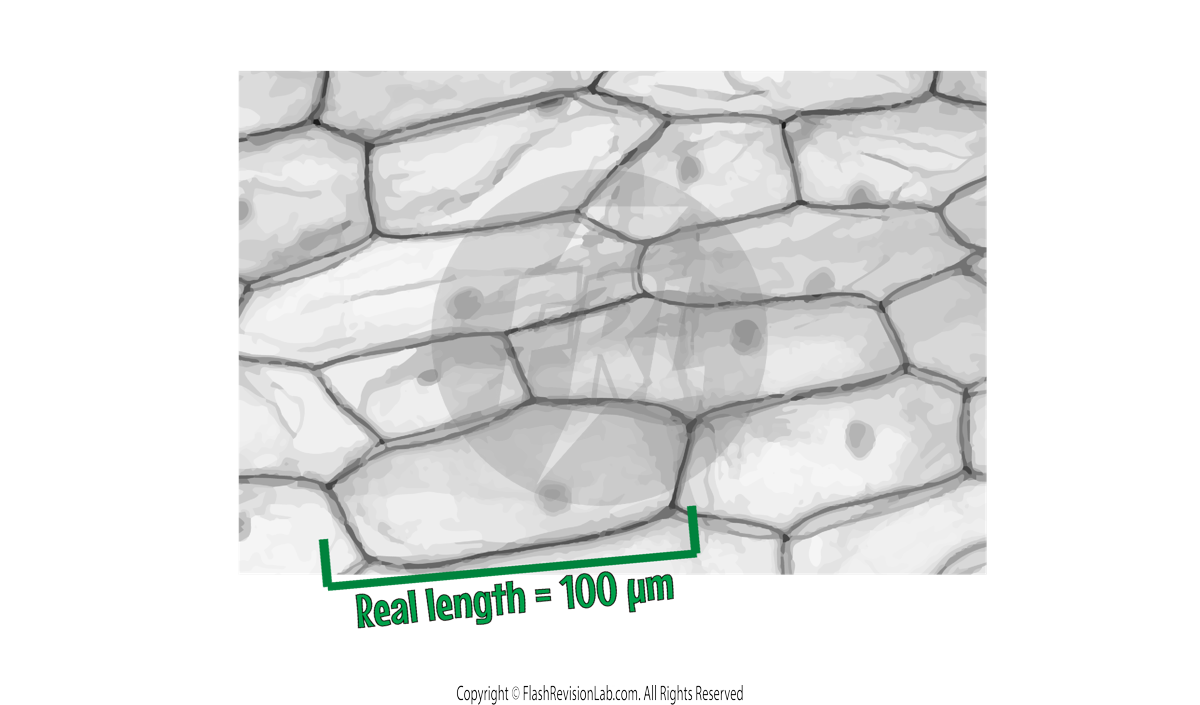
Magnification
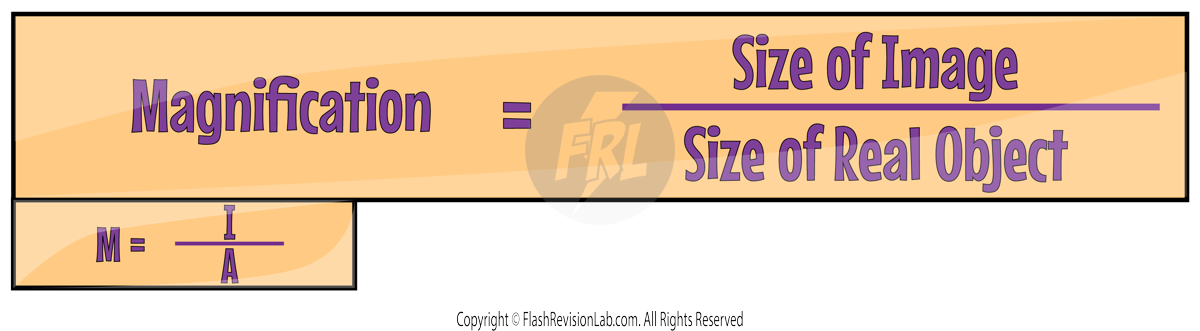
- MAGNIFICATION is how much larger the microscope makes the object appear.
- To calculate magnification, use the formula:
Working with Standard Form
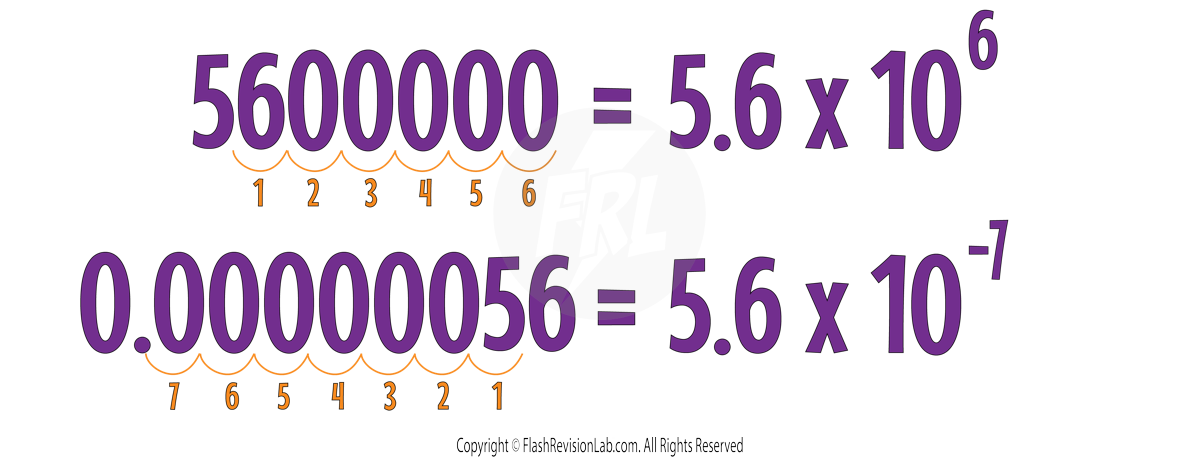
- Microscopes can see very tiny objects, and for this, we often use numbers in STANDARD FORM to handle very large or small numbers.
- To write in standard form, move the decimal point until there's one non-zero digit to the left, then multiply by a power of 10. The power of 10 is positive if the decimal point is moved to the left, and negative if it's moved to the right.
Microscope Calculations
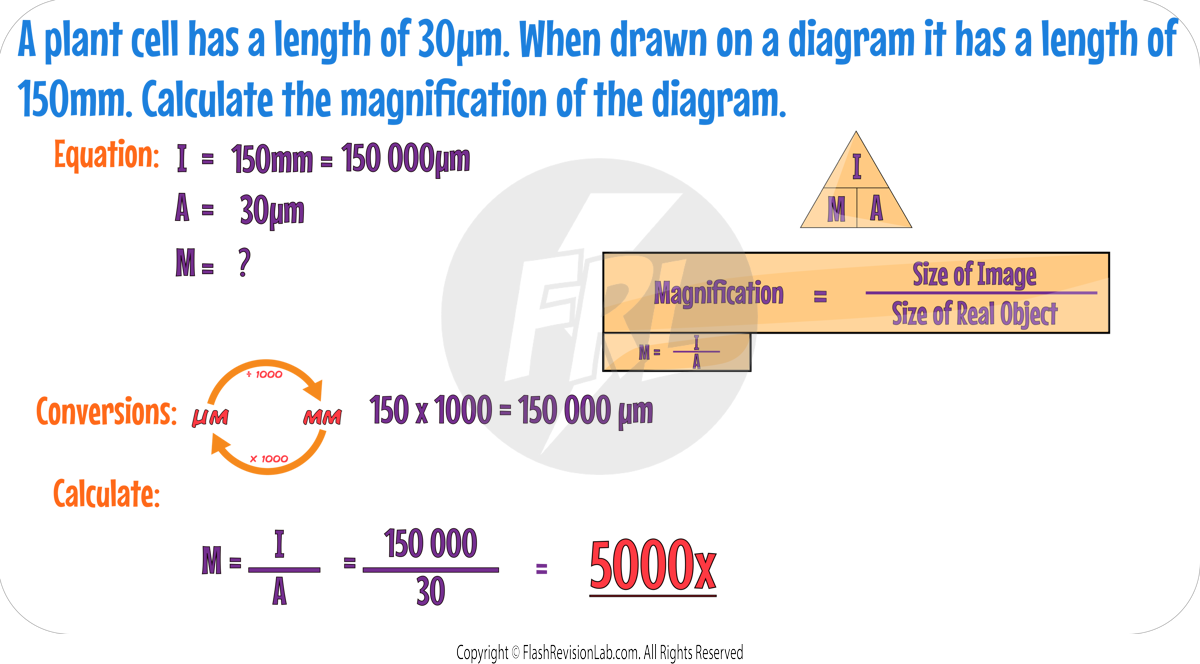
- When solving problems involving microscope measurements, ensure units are consistent.
- Make sure you know how to convert from Micrometers to Millimeters

Heres an example of a calculation:
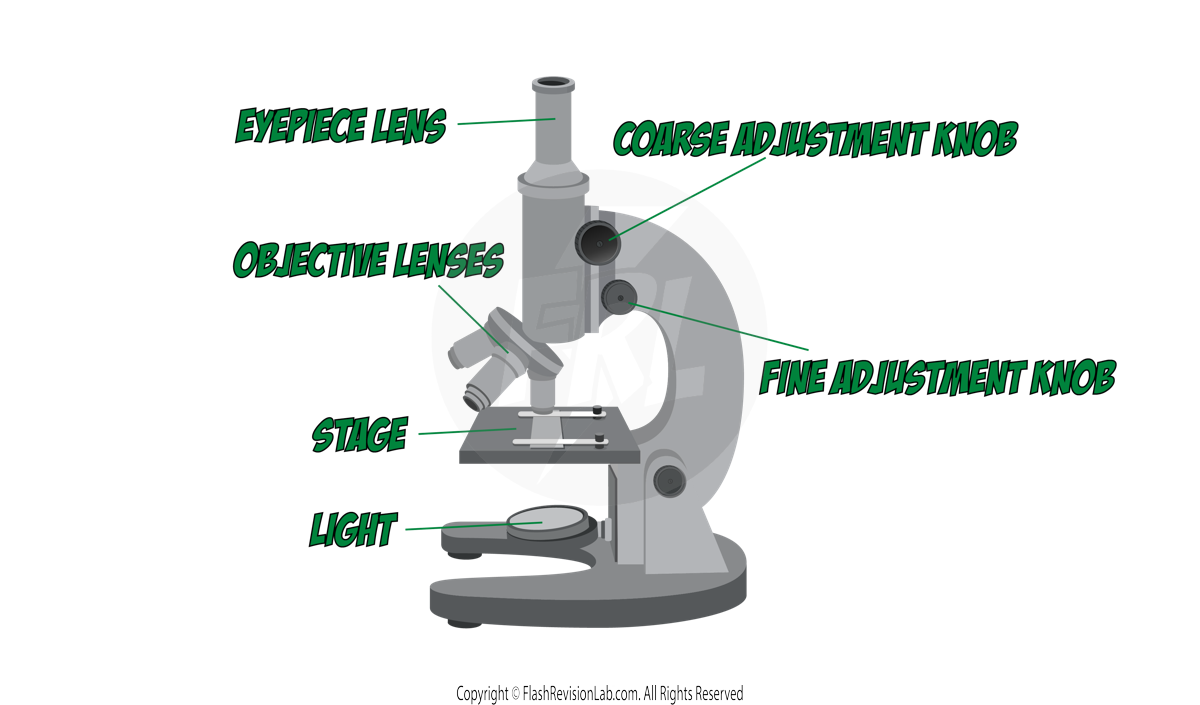
Labelling a Microscope
Preparing and Observing Slides
Slide Preparation: Viewing Onion Cells
- Start with a clean microscope SLIDE.
- Add a single DROP OF WATER to the slide.
- Carefully cut an onion and separate it into layers.
- With TWEEZERS, peel off a piece of the EPIDERMAL tissue and place it onto the drop of water on your slide.
- Add a drop of IODINE SOLUTION as a stain to highlight cell features.
- Place a COVER SLIP over the specimen carefully to avoid air bubbles which can obstruct the view.
Using a Light Microscope
- Secure the slide on the stage of the microscope.
- Begin with the LOWEST-POWERED OBJECTIVE LENS.
- Adjust the COARSE ADJUSTMENT KNOB to bring the stage close to the lens without touching.
- Look through the EYEPIECE and use the COARSE ADJUSTMENT KNOB to find the focus.
- Fine-tune the focus with the FINE ADJUSTMENT KNOB for a clear image.
- For greater detail, switch to a higher-powered objective lens and refocus.
Drawing Observations
- Draw what you observe with a PENCIL.
- Ensure the drawing occupies at least half of the space provided.
- Use clear, UNBROKEN LINES; avoid coloring or shading.
- Draw cells proportionally, labelling important features like nucleus or chloroplasts with straight lines.
- Include a TITLE and the MAGNIFICATION LEVEL
Chromosomes and Mitosis
Chromosomes: Carriers of Genetic Information
- When cells are in their normal states, the DNA in the nucleus exist in the form of LONG STRANDS.
- When cells prepare to divide, the strands of DNA form CHROMOSOMES.
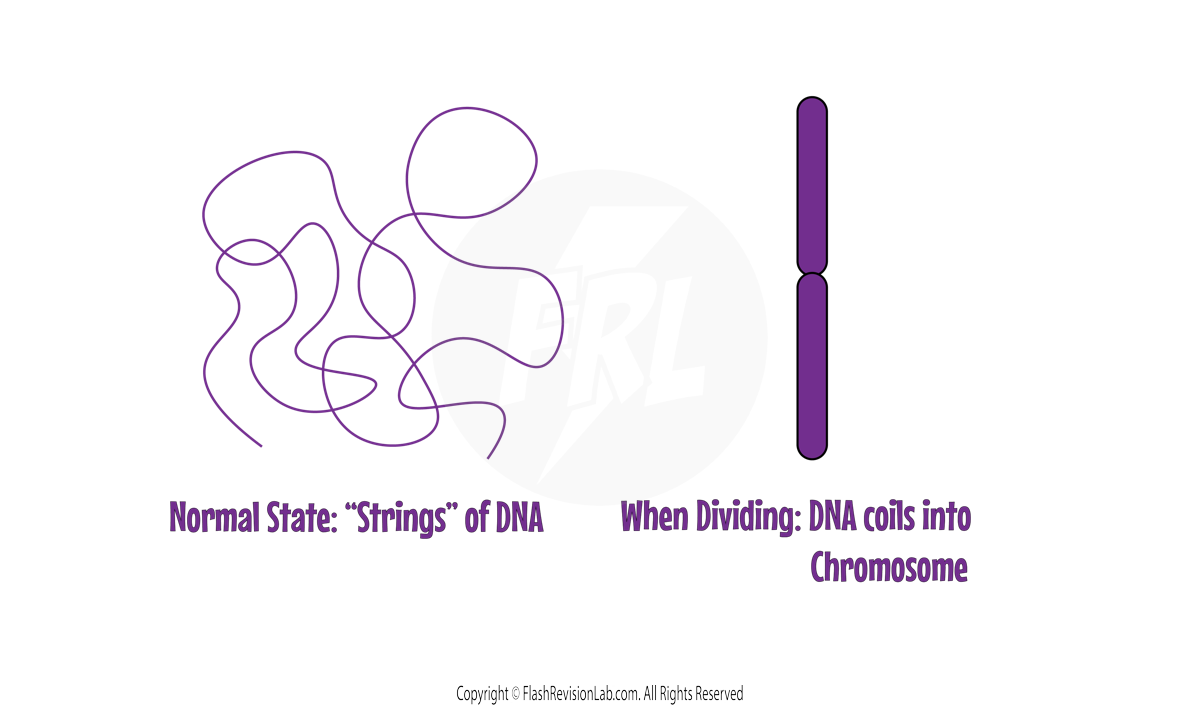
- CHROMOSOMES are structures within the nucleus of cells containing tightly coiled DNA.
- Human body cells have 46 CHROMOSOMES, which exists as 23 PAIRS, where each pair is inherited from each parent.
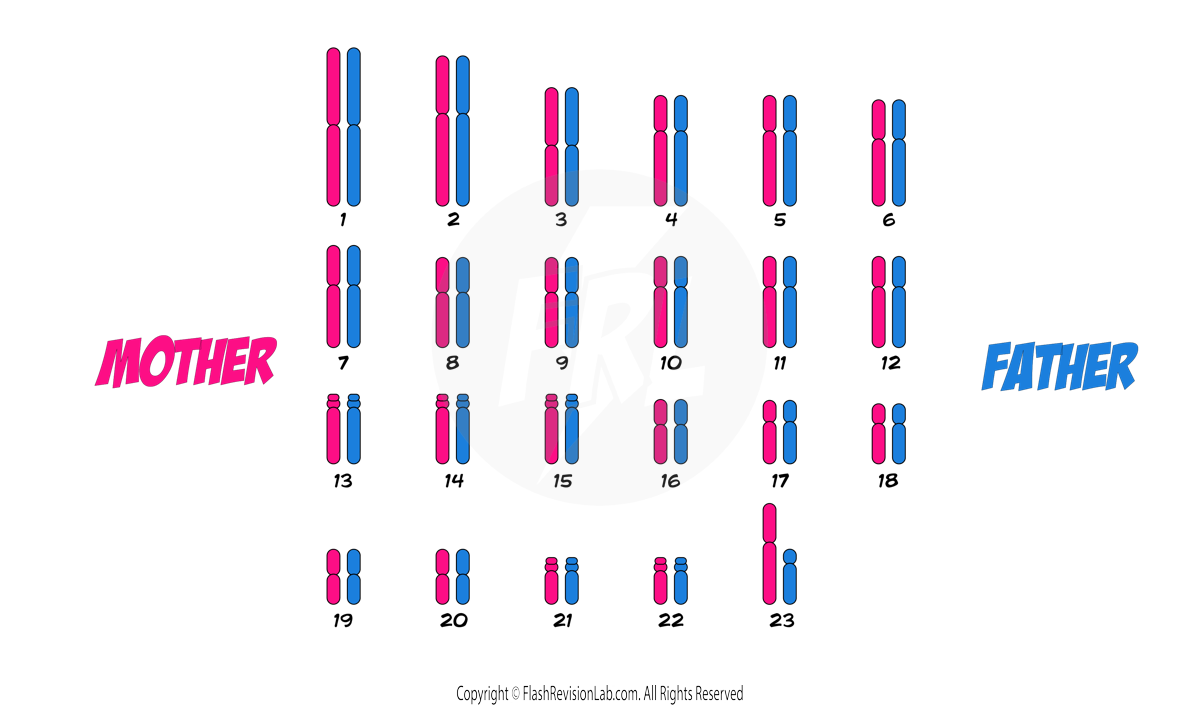
- Sex Cells (known as GAMETES) have HALF the number of chromosomes (23), and when a sperm cell fertilises an egg cell, the two halves join to form a full set of 46 Chromosomes.
- Each chromosome holds numerous GENES responsible for various PHYSICAL CHARACTERISTICS like hair colour and eye colour.
The Cell Cycle: Creating New Cells
- To help an organism grow, develop and repair, the body needs to make new cells
- This is done through the CELL CYCLE, which is a series of events that cells go through to grow and DIVIDE. The end result is the formation of 2 cells that are IDENTICAL to the original cell.
- The two cells formed are known as DAUGHTER CELLS
There are 3 main stages to the cell cycle:
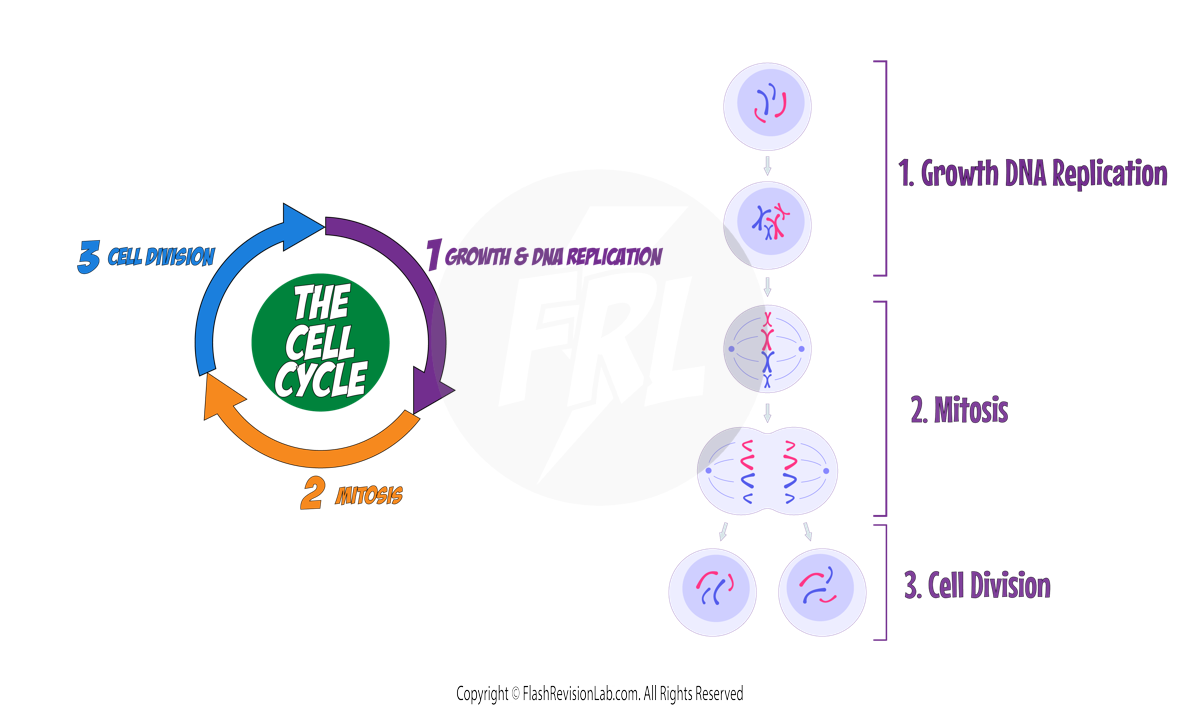
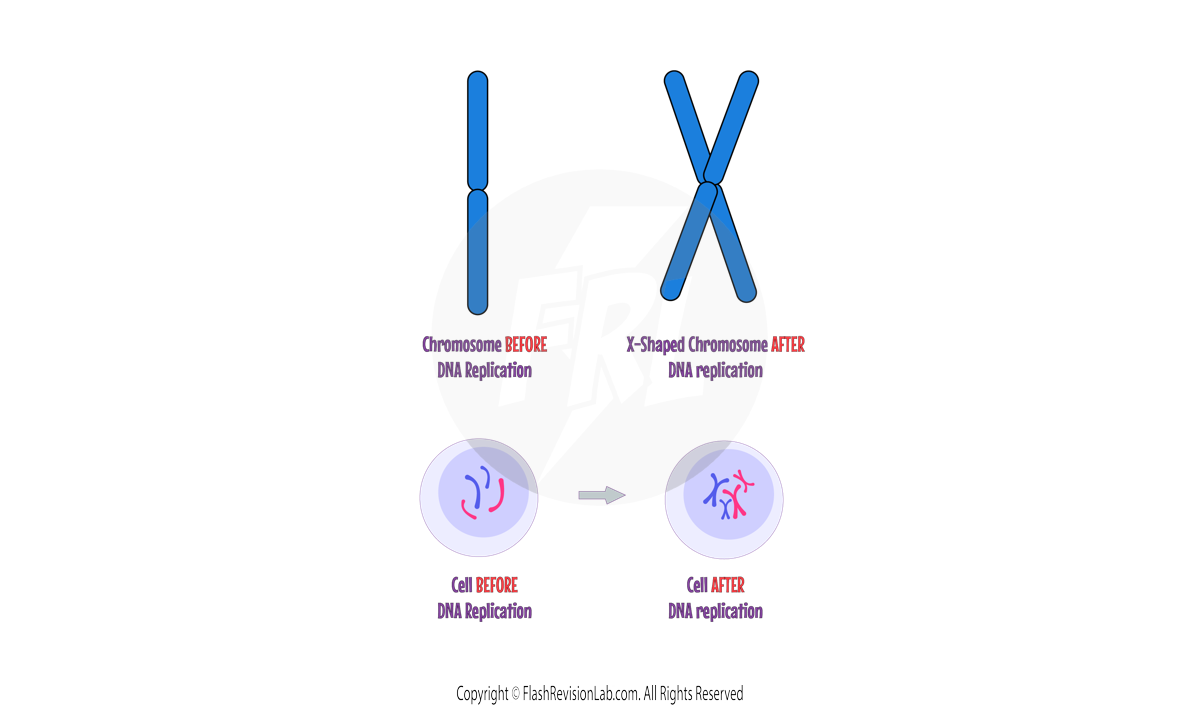
1. Growth and DNA Replication
- The cell increases its SUBCELLULAR STRUCTURES, such as MITOCHONDRIA and RIBOSOMES.
- The nucleus of the cell REPLICATE their DNA, forming two identical X-SHAPED CHROMOSOMES.
2. Mitosis
- The MEMBRANE of the nucleus breaks down
- The Chromosomes align in the CENTRE of the cell and are then pulled apart to opposite ends of the cell by structures known as CELL FIBRES.
3. Cell Division
- New membranes form around each set of chromosomes to form TWO NUCLEI
- The cytoplasm and cell membrane SPLIT to form TWO IDENTICAL DAUGHTER CELLS
Stem Cells
Human Stem Cells
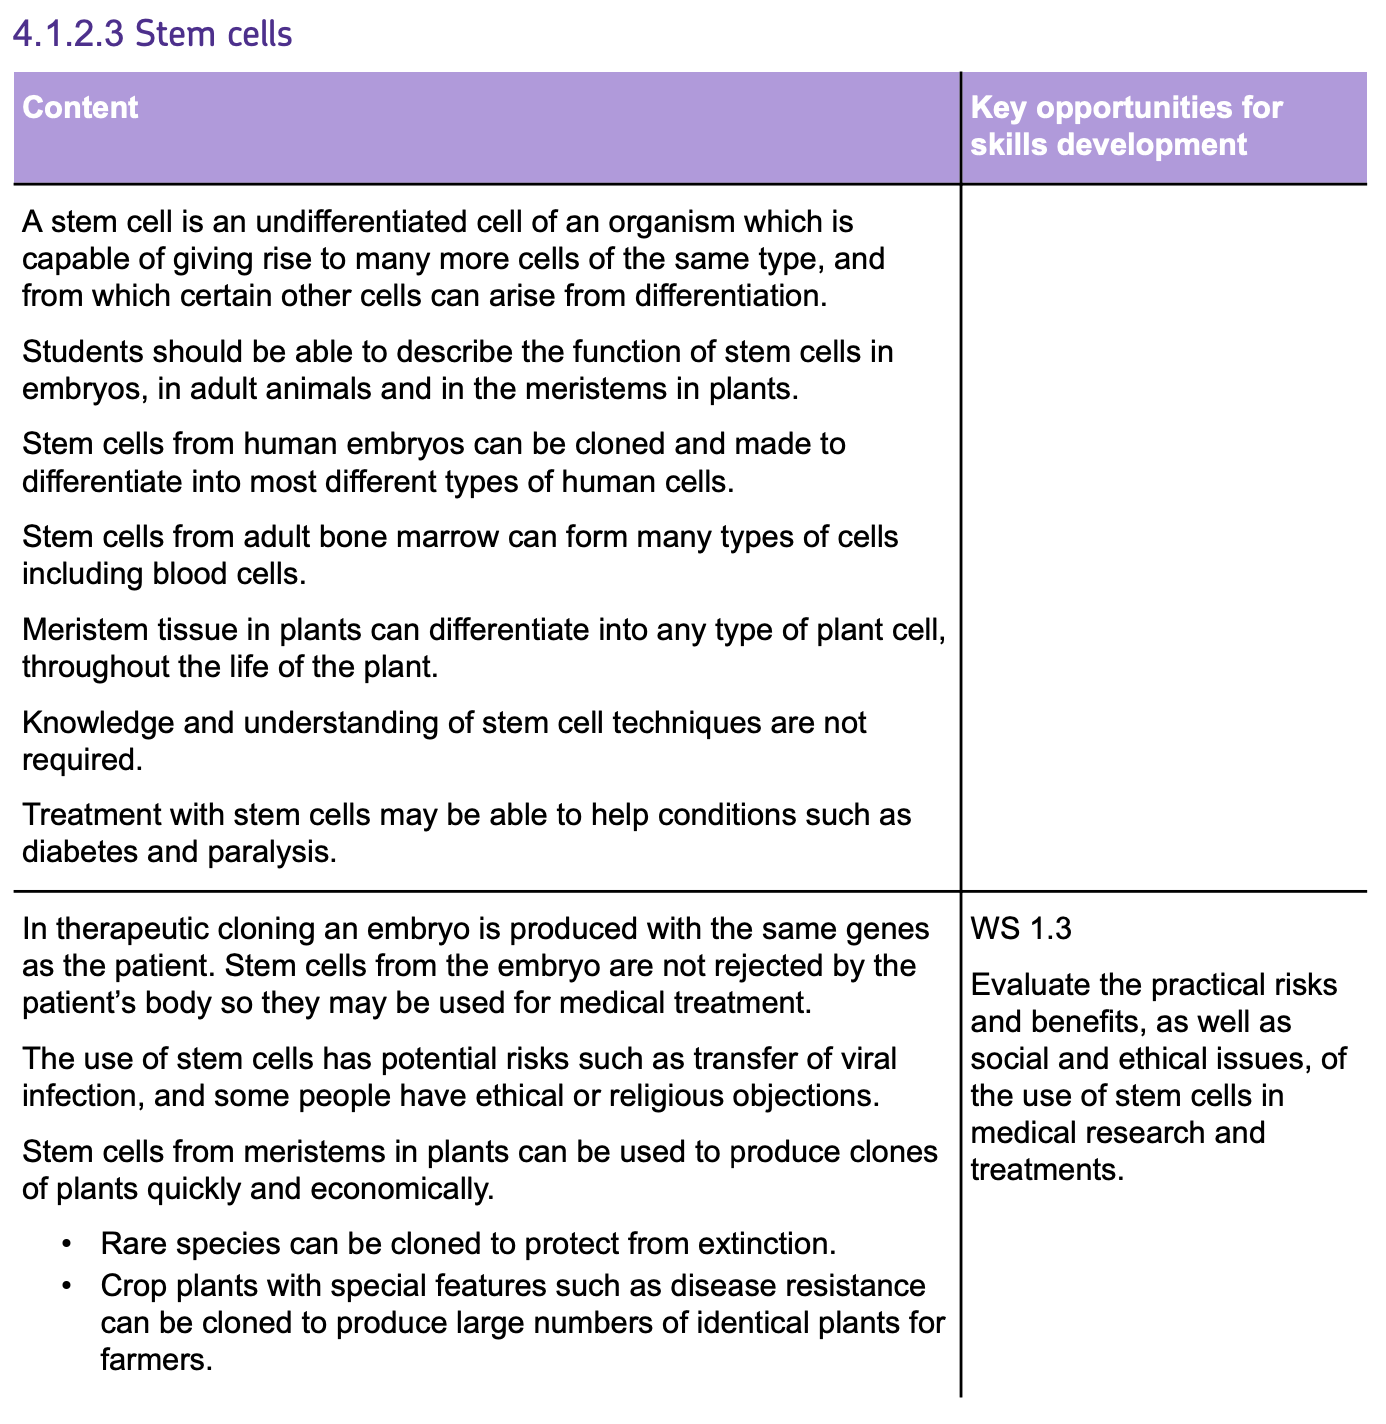
- Stem cells are UNDIFFERENTIATED cells capable of becoming other types of cells, undergoing a process known as DIFFERENTIATION.
HUMANS have TWO types of stem cells:
1. Stem cells found in early HUMAN EMBRYOS, have the potential to turn into ANY cell type.

2. ADULT STEM CELLS exist too but are limited in the types of cells they can turn into. They are commonly found in BONE MARROW and can only differentiate into different types of BLOOD CELLS (eg. Red blood cells and White blood cells).

Healing with Stem Cells
STEM CELLS can be grown in labs and differentiated into specialised cells for MEDICINE or RESEARCH.
Examples include:
- ADULT STEM CELLS can be used to treat diseases by replacing faulty BLOOD CELLS in patients.
- EMBRYONIC STEM CELLS have potential in treating a variety of conditions, including DIABETES and SPINAL INJURIES.
- THERAPEUTIC CLONING involves creating embryos with the same DNA as a patient. The embryos can be used to produce stem cells with the same genetic information as the patient, which reduces any risks of REJECTION.
Ethical Considerations
- Debate surrounds stem cell research, particularly concerning the use of human embryos.
- People AGAINST stem cell research argue about using POTENTIAL HUMAN LIVES for experiments.
- People FOR stem cell research argue that benefits for SUFFERING PATIENTS are more important than the rights of an embryo.
- Stem cell research is regulated, with some countries having bans and others allowing it under strict conditions.
Plant Stem Cells
- In plants, stem cells are found in MERISTEM TISSUE, which are on the TIPS of plant shoots and roots where growth occurs.
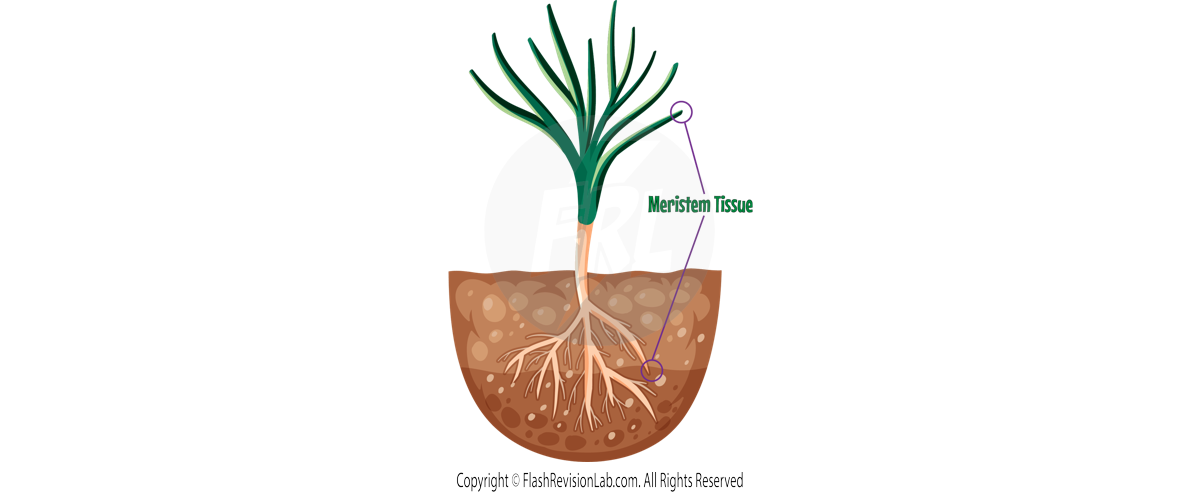
- Unlike adult human stem cells, plant stem cells can differentiate into ANY type of plant cell.
- These stem cells can be used to produce identical CLONES of plants.
- This technique is useful for preserving RARE SPECIES of plant and producing CROPS with desirable traits like DISEASE and INSTECTICIDE RESISTANCE.
Diffusion
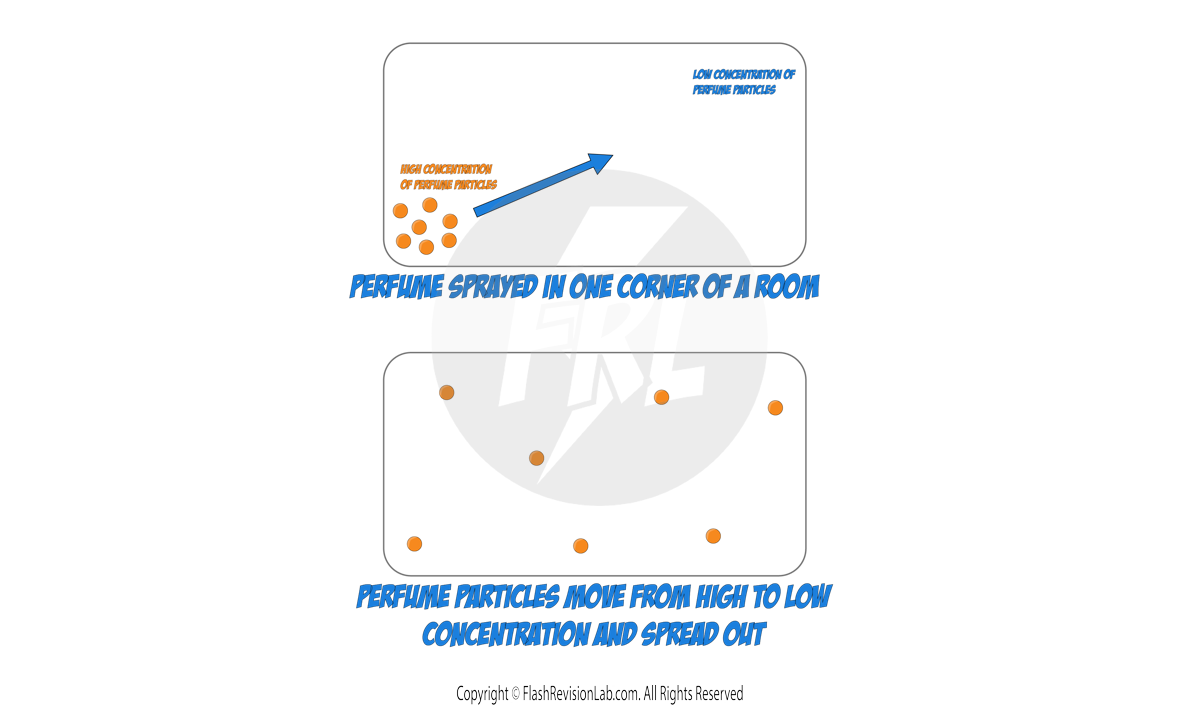
DIFFUSION is the process of particles spreading from an area of HIGHER CONCENTRATION to an area of LOWER CONCENTRATION, resulting in them being evenly spaced. This occurs due to the natural, random movement of particles.
- Diffusion occurs in both liquids and gases because particles in these states have the FREEDOM TO MOVE randomly.
- Diffusion is a PASSIVE PROCESS which means it does not use any energy
As an example, lets look at what happens to perfume particles when perfume is sprayed in a room:
You can increase the rate of diffusion by:
- Increasing the CONCENTRATION GRADIENT (difference in concentration between the two areas).
- Increasing the TEMPERATURE, as particles have more energy to move faster.
- Increasing the SURFACE AREA of the membrane where diffusion is occurring
Here are some examples of Diffusion in CELLS:
- when OXYGEN is taken into the cells
- when CARBON DIOXIDE is removed from the cells
- when UREA (a waste product) is removed from cells into the plasma for excretion
Surface Area to Volume Ratio
- The efficiency of exchange surfaces by diffusion is determined by the SURFACE AREA to VOLUME RATIO (SA:V).
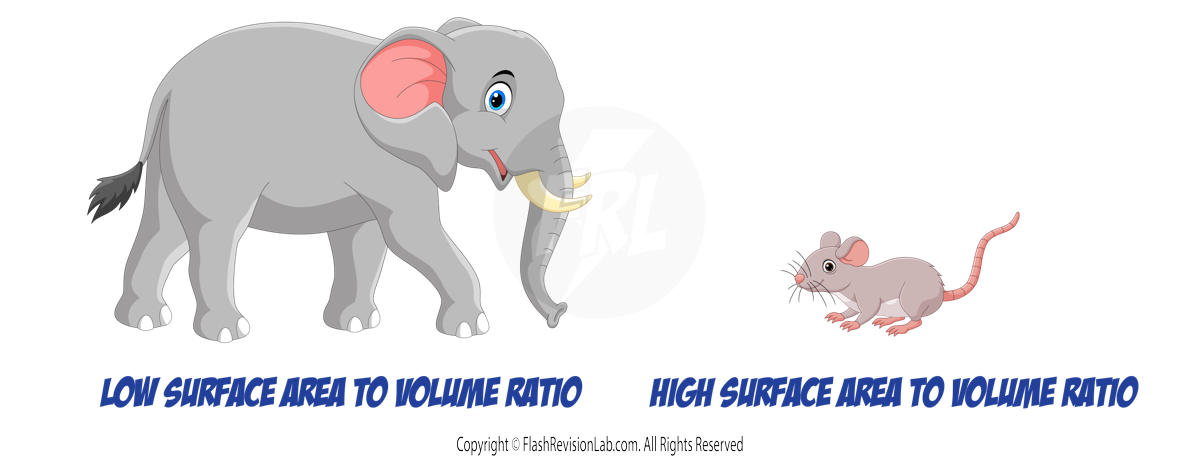
- LARGER organisms have a SMALLER SA:V ratio than smaller organisms.
- This can be proven by calculating the SA:V ratio of two cubes
Calculating Surface Area to Volume Ratios
Consider a cube with lengths of 1m and another with lengths of 2m
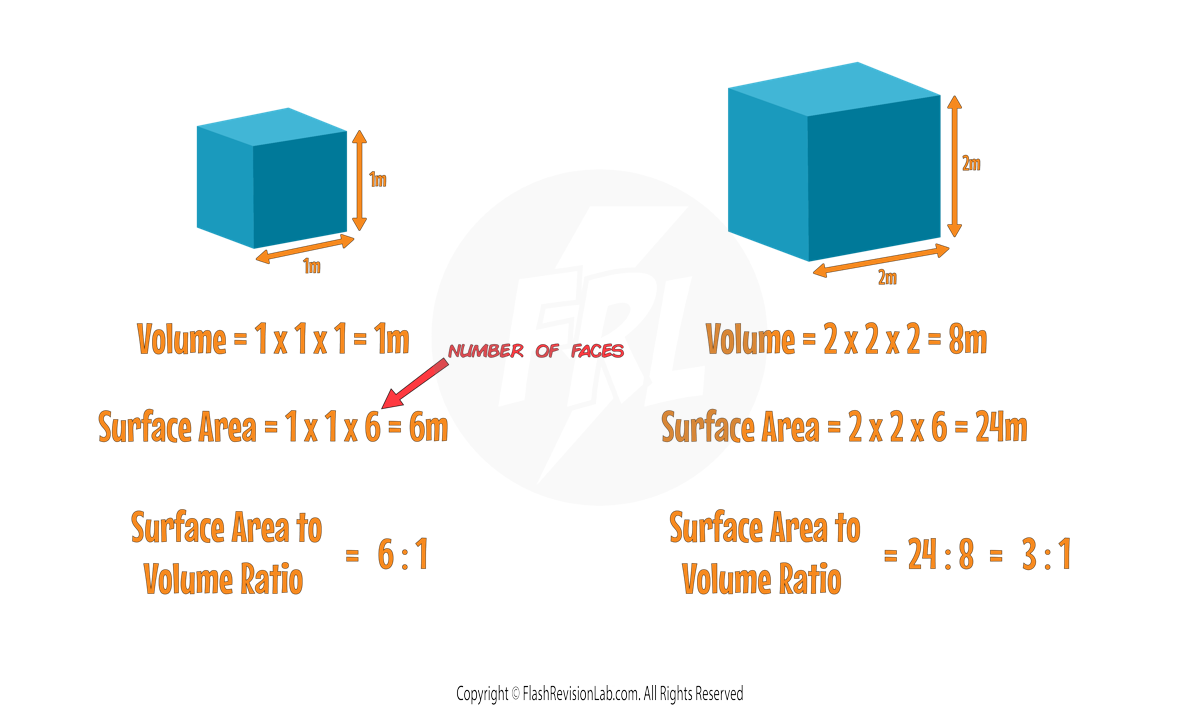
Therefore the bigger cube has a lower surface area to volume ratio
Multicellular Organisms and Exchange Surfaces
- A HIGH SA:V ratio is beneficial for diffusion as it provides a LARGER surface area relative to the volume of the organism.
- This means very small single celled organisms such as bacteria can exchange substance easily as diffusion will occur at a faster rate
- Multicellular organisms need specialised exchange surfaces due to their smaller SA:V ratios.
- Efficient exchange surfaces have characteristics such as a THIN MEMBRANE for a short diffusion path, LARGE SURFACE AREA for maximum diffusion, and are often VENTILATED to maintain a diffusion gradient.
- Examples include LUNGS in animals and LEAVES in plants.
Gas Exchange in the Lungs
The Role of Lungs and Alveoli
- The LUNGS are responsible for the crucial exchange of gases: OXYGEN is taken in, and CARBON DIOXIDE is expelled.
- This exchange occurs in millions of tiny air sacs called ALVEOLI.
Adaptations of Alveoli for Gas Exchange
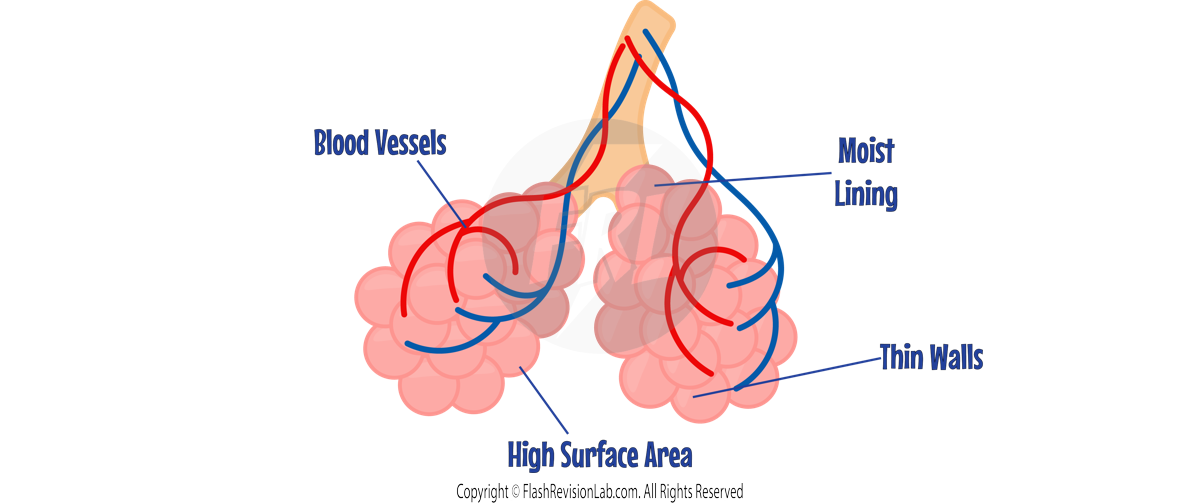
- Alveoli have a HUGE SURFACE AREA—around 75 square meters in humans—to increase the efficiency of gas exchange.
- They possess a MOIST LINING for dissolving gases, which aids in the diffusion process.
- Their WALLS are extremely THIN to minimize the distance gases must diffuse.
- Alveoli are surrounded by a dense CAPILLARY NETWORK, ensuring a rich blood supply and rapid gas exchange.
Gas Exchange in Plant Leaves
Structure of Leaves
- CARBON DIOXIDE diffuses into AIR SPACES within the leaf for photosynthesis.
- Leaves have an EXCHANGE SURFACES underneath, consisting of small openings called STOMATA.
- OXYGEN and WATER VAPOUR exit the leaf through these stomata.
- The shape of the leaf and the arrangement of cells optimize the internal surface area for gas exchange.
Adaptations for Gas Exchange
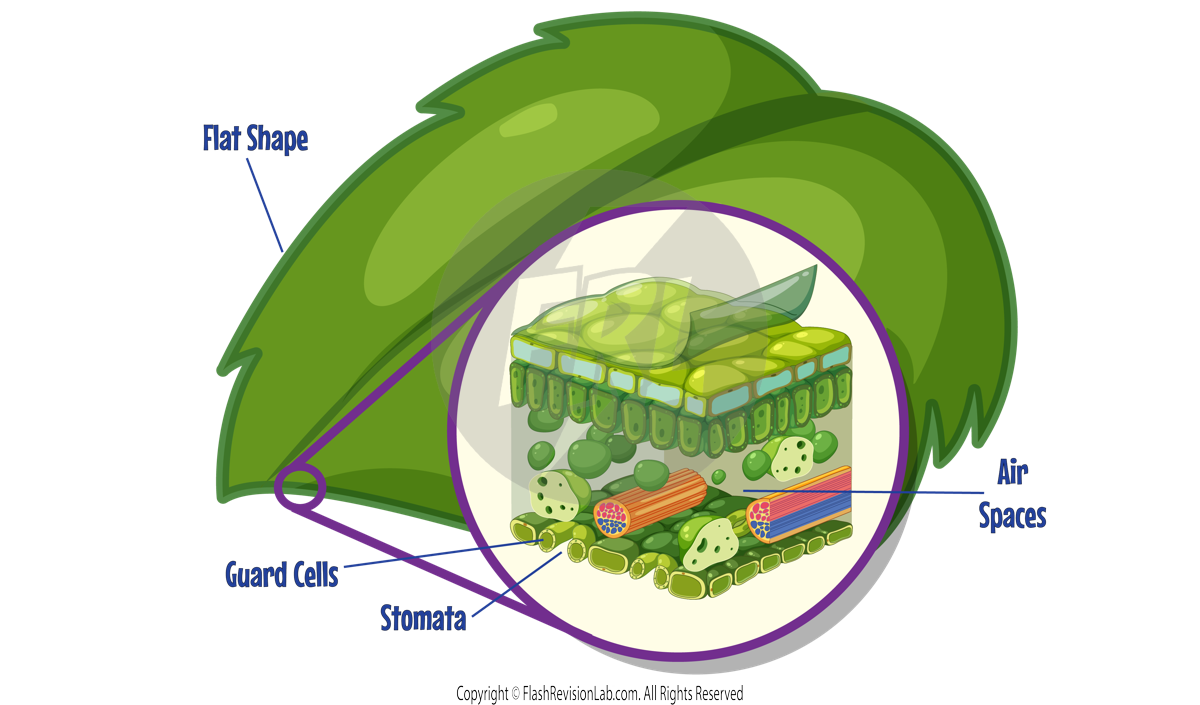
- Stomata are flanked by GUARD CELLS that regulate their opening, ensuring gas exchange occurs only when necessary.
- The FLATTENED SHAPE of the leaf increases the surface area for gas exchange.
- Internal cell walls also contribute to a larger exchange surface, with air spaces to facilitate DIFFUSION.
Nutrient Absorption in the Small Intestine
Villi Increase Surface Area
- The SMALL INTESTINE maximises absorption efficiency through structures called VILLI.
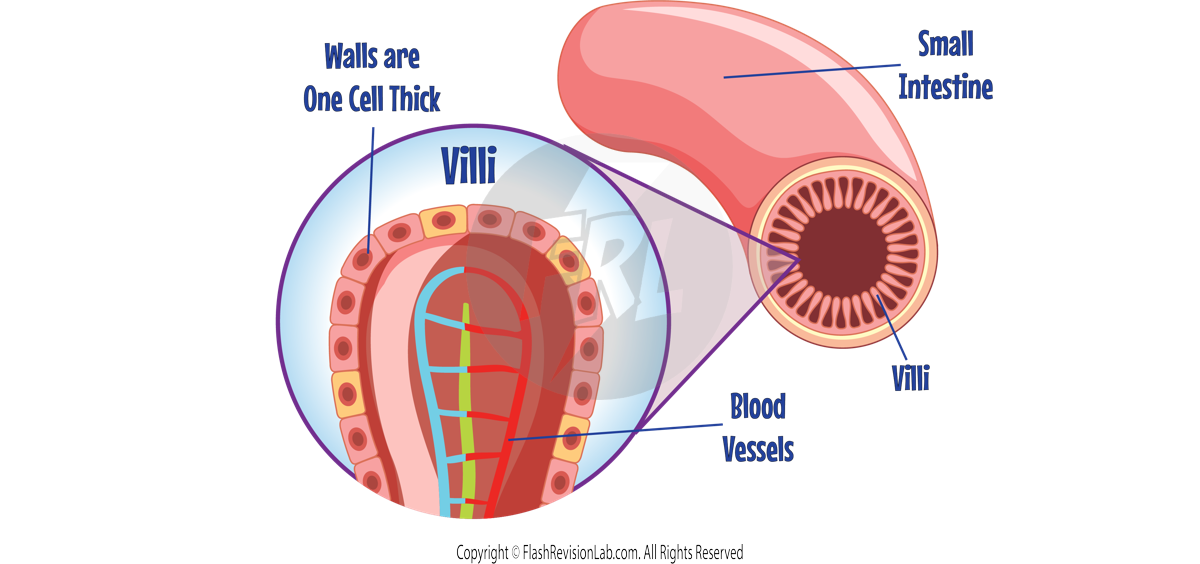
- Villi are tiny projections that significantly expand the surface area available for nutrient absorption into the bloodstream.
- They consist of a SINGLE LAYER OF SURFACE CELLS and a rich supply of BLOOD CAPILLARIES to facilitate quick absorption of digested nutrients.
Gas Exchange in Fish Gills
Structure of Gills
- Gills are the primary gas exchange surface in FISH.
- Water enters through the mouth and exits through the gills, where OXYGEN is absorbed into the blood and CARBON DIOXIDE is released.
Adaptations of Gills for Gas Exchange
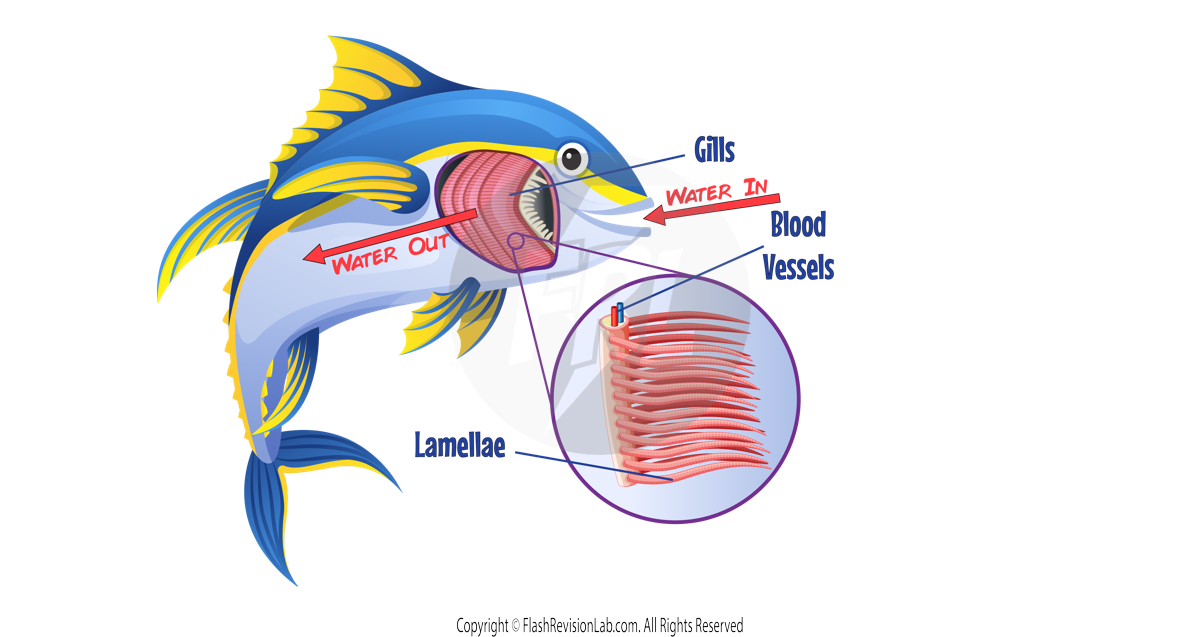
- Gills are made of thin plates called GILL FILAMENTS, providing a large surface area for gas exchange.
- Filaments are covered in numerous LAMELLAE, which further increase the surface area.
- Lamellae are rich in blood capillaries, ensuring rapid diffusion of gases.
- A THIN SURFACE LAYER of cells in lamellae minimizes the distance over which gases must diffuse.
- Blood flows in one direction through the lamellae while water flows in the opposite, maintaining a CONCENTRATION GRADIENT for oxygen.
- The CONCENTRATION. OF OXYGEN in water is always higher than in the blood, facilitating its diffusion into the bloodstream.
Osmosis
OSMOSIS is the process where WATER MOLECULES move from an area of HIGH WATER CONCENTRATION to an area of LOW WATER CONCENTRATION across a PARTIALLY PERMEABLE MEMBRANE.
A PARTIALLY PERMEABLE MEMBRANE has tiny holes that allow only small molecules like water to pass through, preventing larger molecules like proteins and sucrose from moving across.
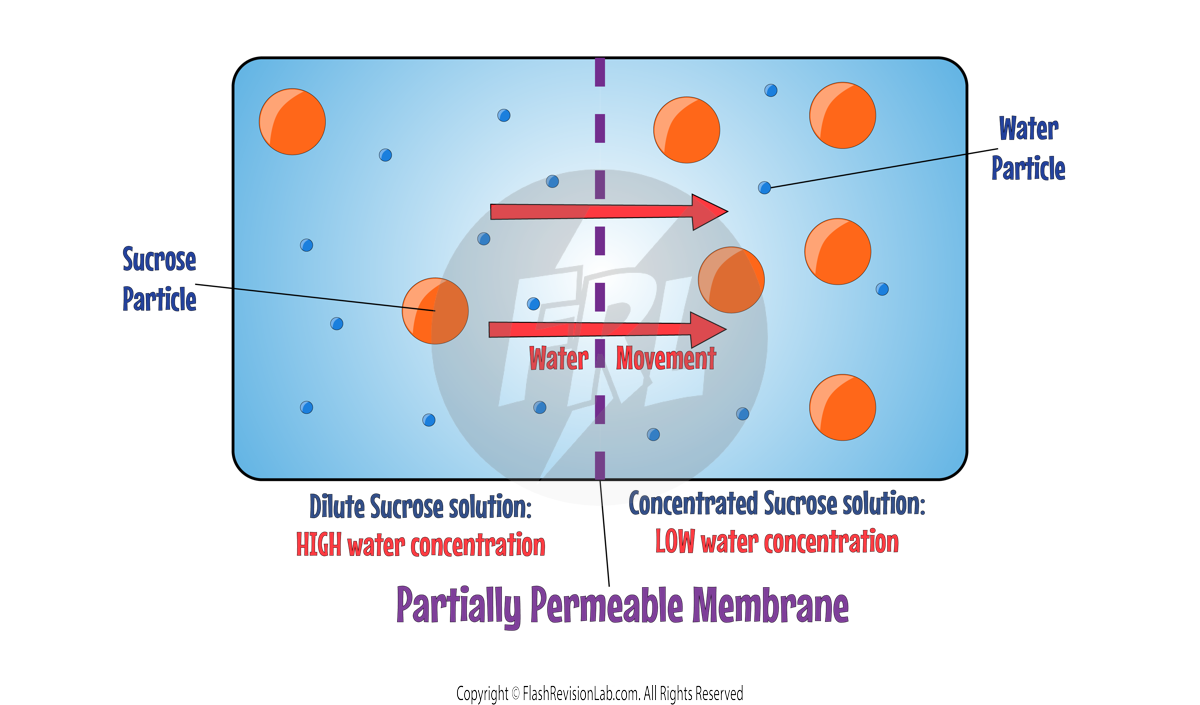
- Water molecules move in both directions across the membrane during osmosis, but there is a NET MOVEMENT (Overall Movement) of water towards the region with fewer water molecules, which happens because water molecules are constantly in random motion.
- The net movement results in the dilution of stronger sugar solutions as the water moves to even out the concentrations on both sides of the membrane.
- Osmosis can be described as a PASSIVE movement of water molecules without requiring energy, simply moving from higher to lower water concentration areas.
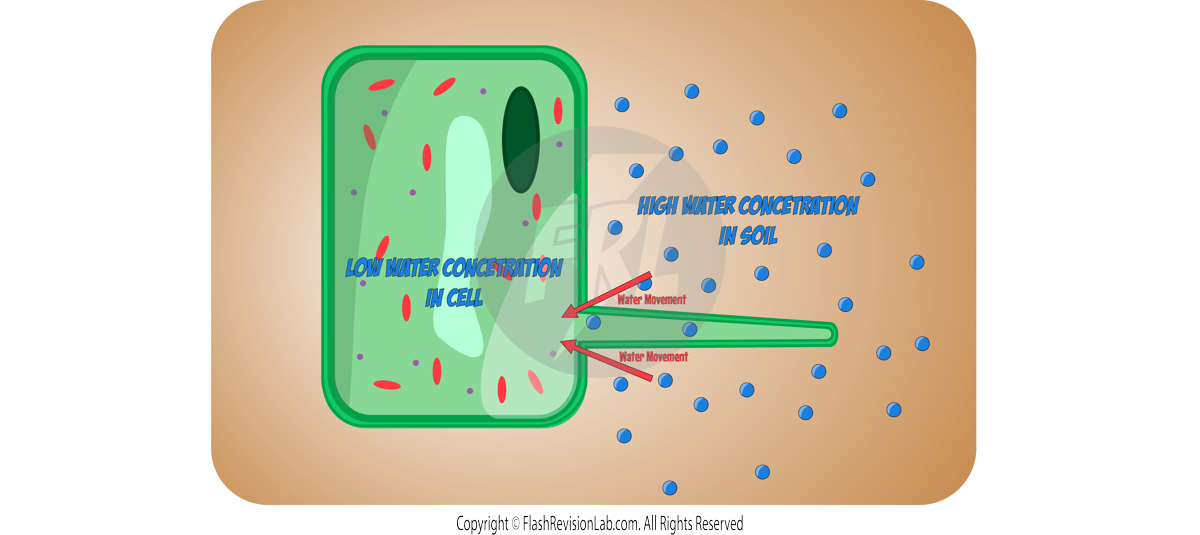
Example: Root hair cells use osmosis to take in WATER from the soil as there is a higher water concentration outside in the soil. This causes water particles to pass into the cell where there is a lower water concentration.
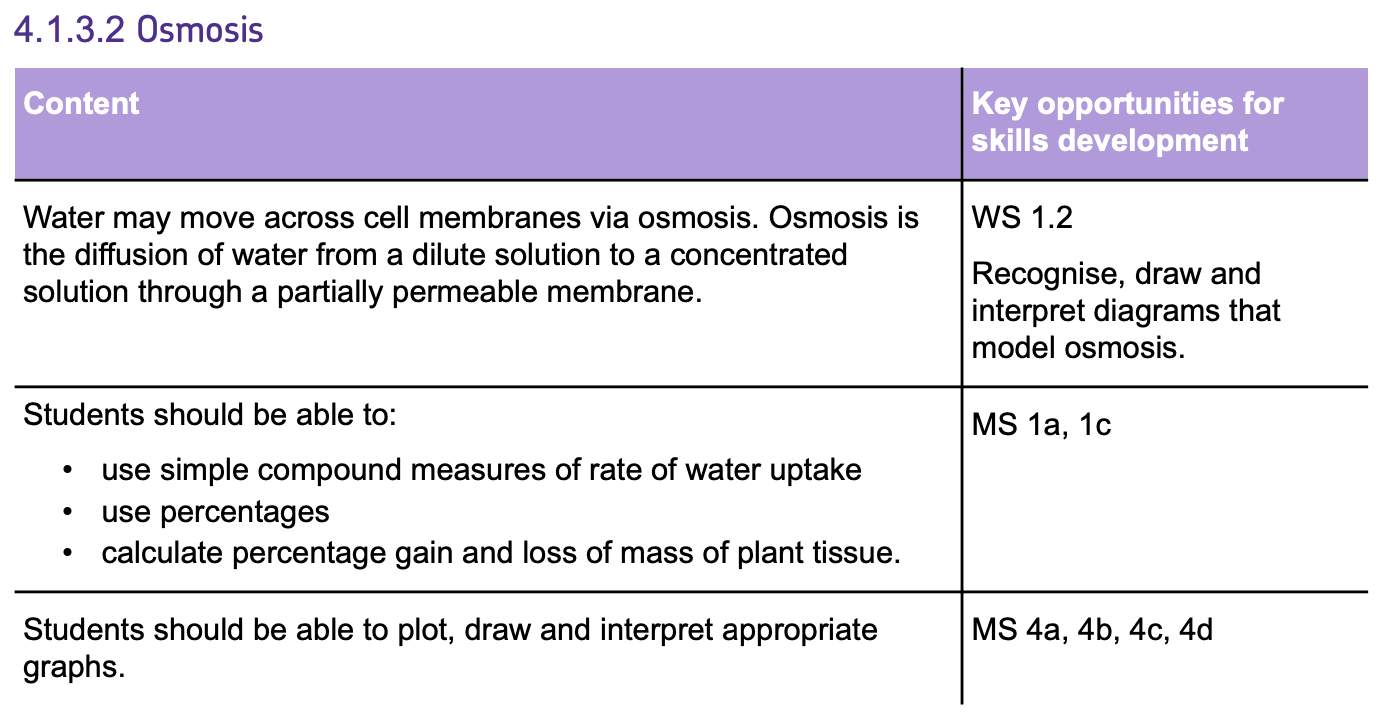
Required Practical: Osmosis
Osmosis is a process where water moves across a PARTIALLY PERMEABLE MEMBRANE from an area of HIGH WATER CONCENTRATION to an area of LOWER WATER CONCENTRATION. It’s a key concept in cell biology that can be investigated through a practical experiment using potato cylinders in sugar solutions.
The Osmosis Experiment Setup
Preparing Your Samples:
- Begin by CUTTING POTATO CYLINDERS of the same size.
- Immerse the cylinders in DIFFERENT SUGAR SOLUTIONS with varying concentrations (e.g., 0.2 mol/dm³, 0.4 mol/dm³, etc.) to see how different solute concentrations affect osmosis.
- One cylinder should be placed in PURE WATER as a CONTROL.
Measuring Mass Changes:
- Using a MASS BALANCE, record the initial mass of the potato cylinders and then place them in the beaker of solution
- After around 24hrs, take the cylinders out, blot them with a PAPER TOWEL to remove surface moisture and REWEIGH to determine mass change.
Analysing Results:
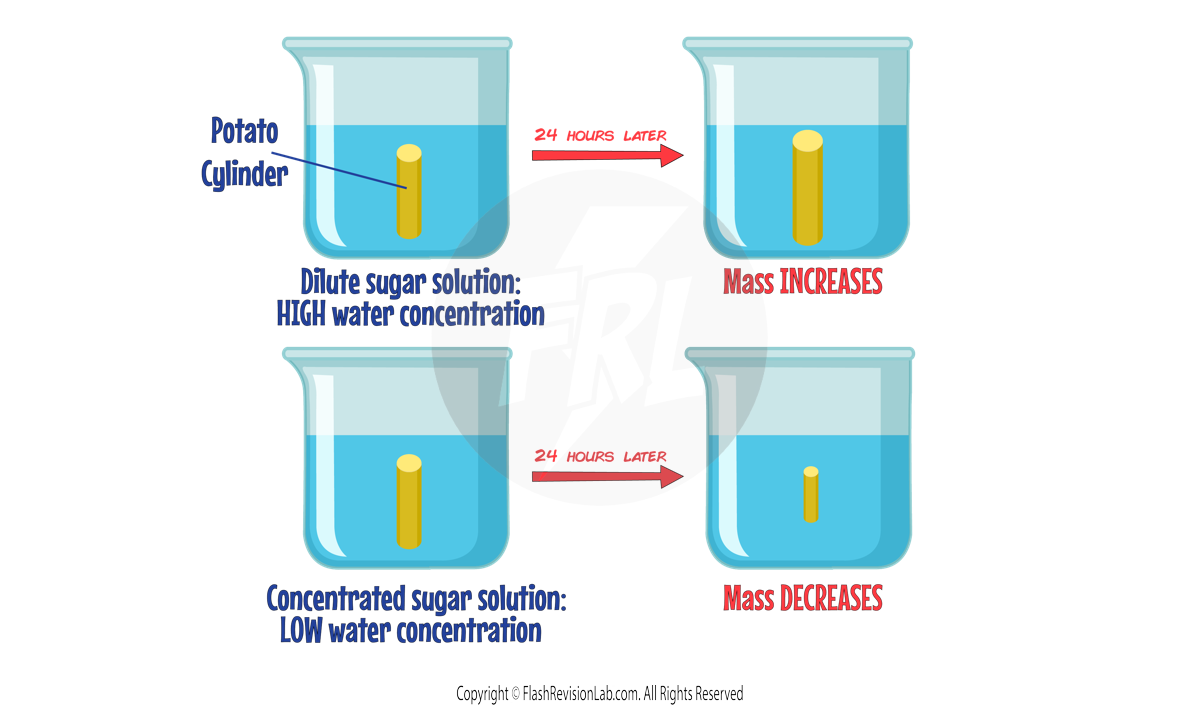
- If cylinders in sugar solutions GAIN mass, water has moved INTO the cells by osmosis, indicating the solutions had a HIGHER WATER CONCENTRATION than the inside of the potato.
- If cylinders in sugar solutions LOSE mass, water has moved OUT OF the cells by osmosis, indicating the solutions had a LOWER WATER CONCENTRATION than the inside of the potato.
- If cylinders in sugar solutions stay the SAME mass, water has neither moved out, nor moved into the cells, this is because the solutions had the SAME WATER CONCENTRATION as the inside of the potato.
Variables:
- The CONTROLLED VARIABLES in this experiment include, the volume of the solution, temperature, time, and type of sugar/salt. These should be kept the SAME across all samples to ensure a fair test.
- The DEPENDENT VARIABLE is the MASS of the potato cylinders, and the INDEPENDENT VARIABLE is the sugar solution CONCENTRATION.
Calculating Results:
- The effect of the sugar solution on osmosis can be quantified by calculating the PERCENTAGE CHANGE in mass for each sugar concentration.
Minimising Errors:
- Ensure the potato cylinders are FULLY SUBMERGED in the solutions without touching the sides of the beaker.
- FULLY DRY the potato cylinders before measuring their mass
- REPEAT the experiment multiple times to calculate a MEAN PERCENTAGE CHANGE, reducing random errors.

Active Transport
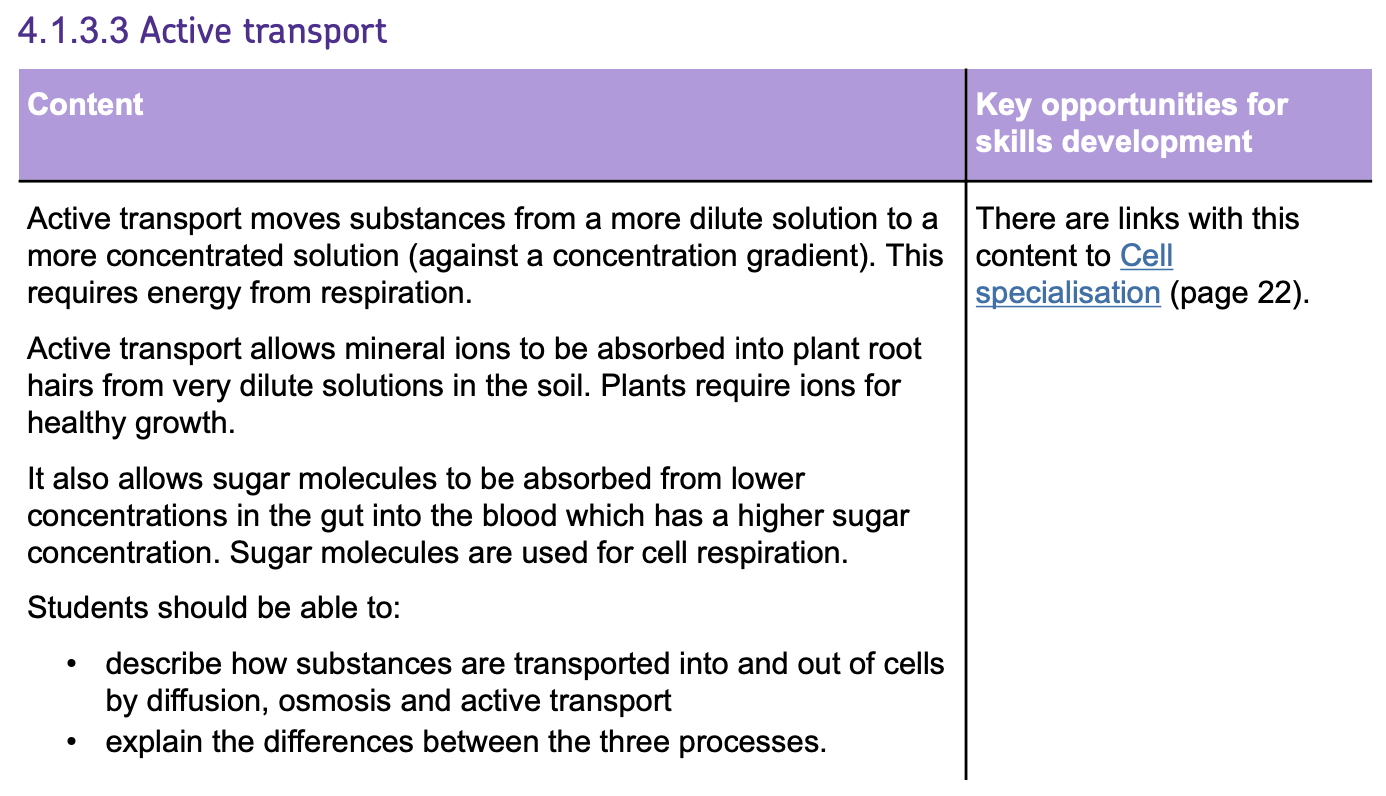
ACTIVE TRANSPORT is the net movement of particles from an area of LOW concentration to an area of HIGH concentration using energy from RESPIRATION.
- Active transport involves particles moving AGAINST a concentration gradient (From a low to high concentration)
- Moving AGAINST a concentration gradient does not happen naturally as it is NOT a PASSIVE process like diffusion (moving from a high concentration to a low concentration)
- This means that ENERGY is required for active transport.
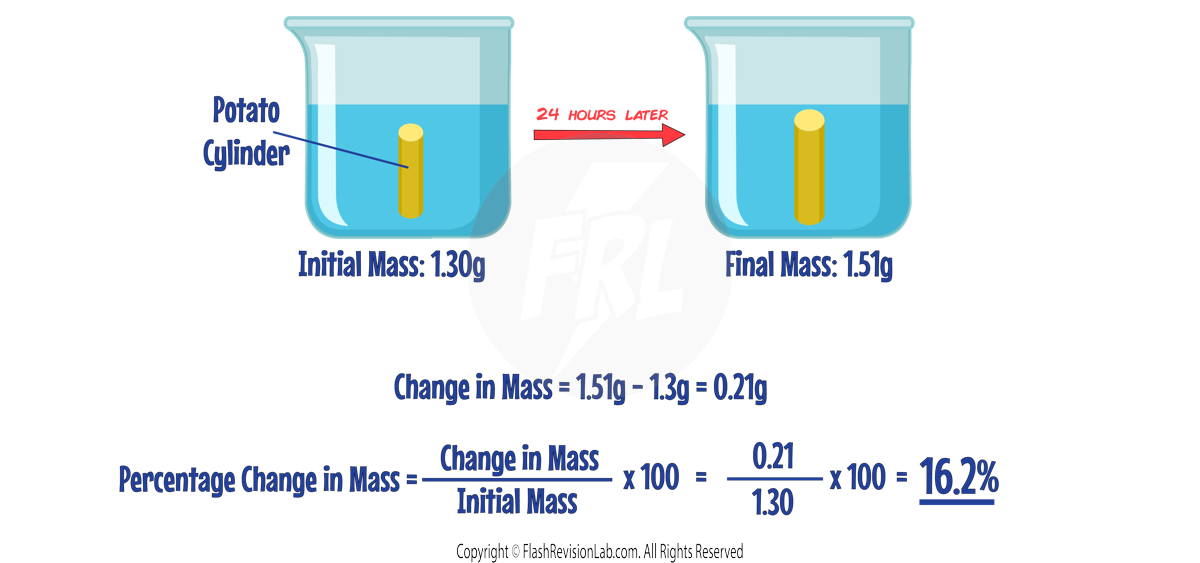
Example: Root cells use active transport to take in MINERALS
- Minerals are usually at a higher concentration in root hair cells than in the surrounding soil.
- Since diffusion can't occur against the concentration gradient, root hair cells use ACTIVE TRANSPORT to absorb minerals from the surrounding soil.
- This process allows plants to absorb essential nutrients from a very dilute solution (low concentration) in the soil.
Example: Humans absorbing GLUCOSE from the gut.
- In the human gut, when there's a lower concentration of nutrients compared to the blood, ACTIVE TRANSPORT allows nutrients, including glucose, to be absorbed into the bloodstream.
- This is essential for providing ENERGY to our cells, even when the concentration gradient is the opposite direction of diffusion.
Principles of Organisation
- Cells are the fundamental units of life, each designed to perform specialised functions through a process called DIFFERENTIATION.
- These specialised cells combine to form TISSUES, which then group to create ORGANS.
- Multiple organs work together to form ORGAN SYSTEMS within larger multicellular organisms.
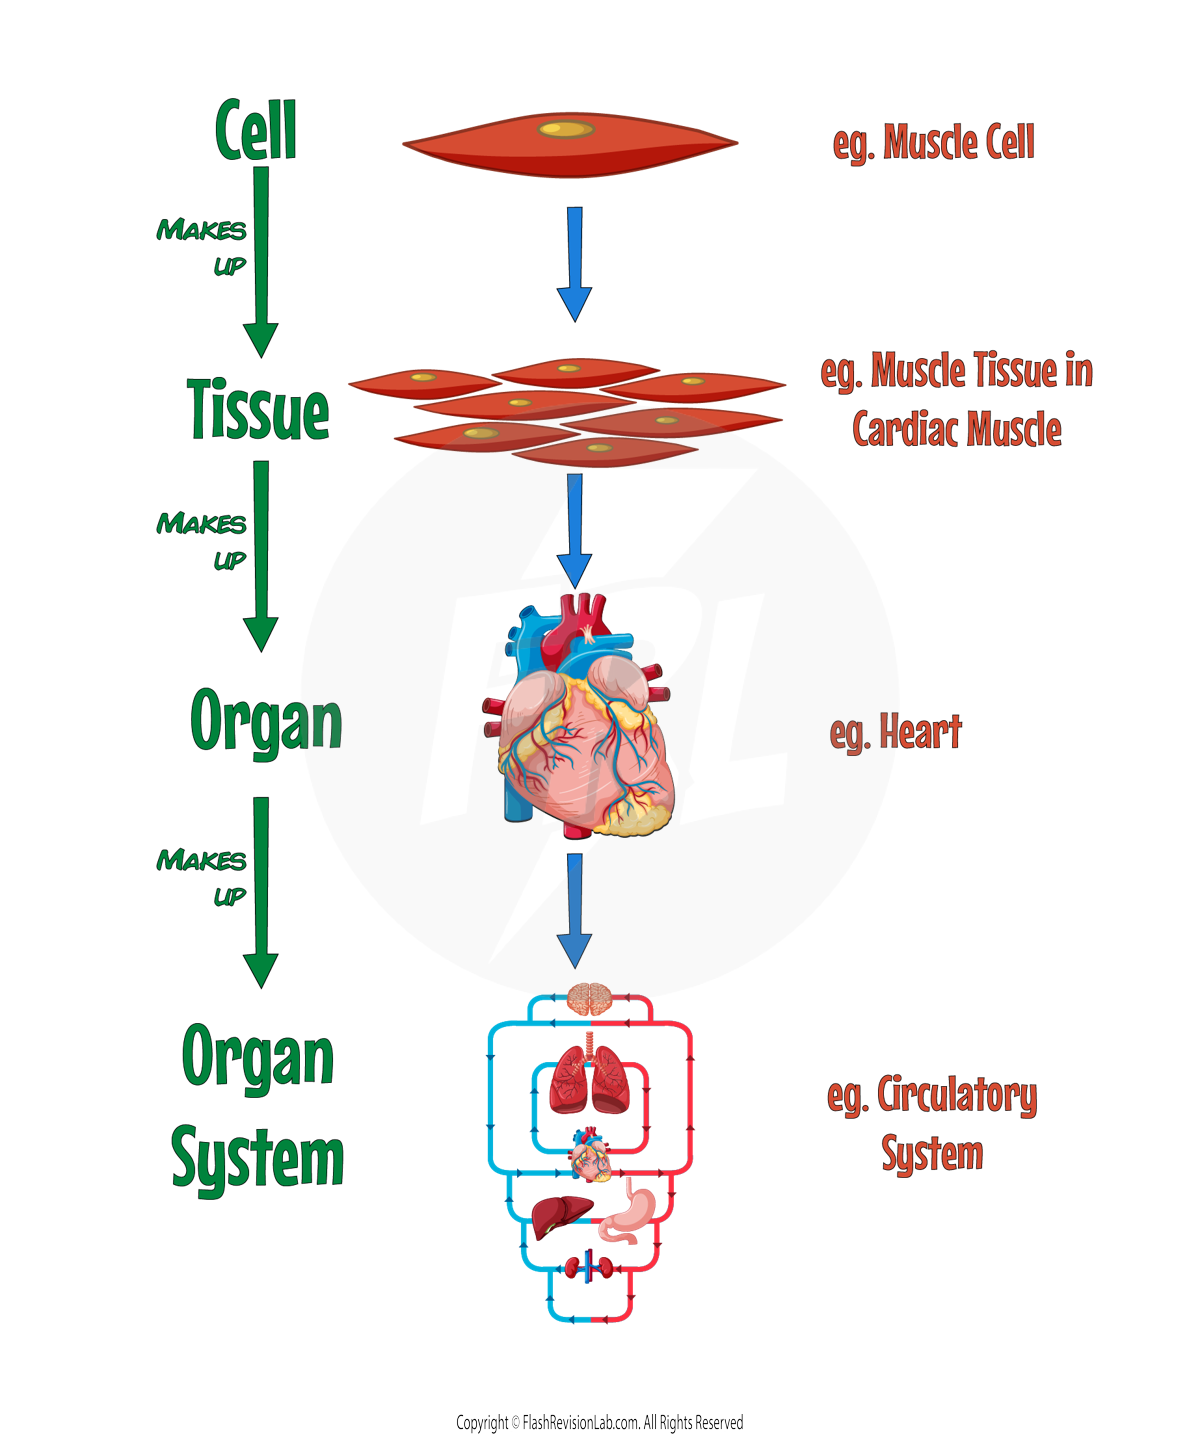
Tissues:
- A TISSUE is a group of cells with similar structures and function that work together to carry out specific jobs. Examples in mammals include:
- Muscular tissue: Responsible for movement by contracting and relaxing.
- Glandular tissue: Produces and releases substances like enzymes and hormones.
- Epithelial tissue: Covers the surfaces of the body, such as the inside of the gut.
Organs:
- Organs are complex structures composed of different tissues, each contributing to the organ's overall function.
- For instance, the HEART is an organ that contains muscular tissue for PUMPING BLOOD around the body
Organ Systems: The Teamwork of Organs
- An ORGAN SYSTEM is a group of ORGANS working together to perform complex functions for the organism's survival.
- The CIRCULATORY SYSTEM is an example of an organ system
Enzymes
Role and Function of Enzymes
- Enzymes are BIOLOGICAL CATALYSTS—they speed up reactions without being consumed or altered.
- ENZYMES are produced by living organisms to regulate chemical reactions.
Structure of Enzymes
- Enzymes are large PROTEINS composed of amino acid chains.
- These proteins fold into UNIQUE SHAPES that are crucial for their function.
How Enzymes Work
Lock and Key Mechanism
- Each enzyme has an ACTIVE SITE with a shape that fits substances known as SUBSTRATES.
- Enzymes are SPECIFIC which means one type of enzyme will only fit one type of substrate.

- When the substrate binds to the active site, it BREAKS UP to form the products
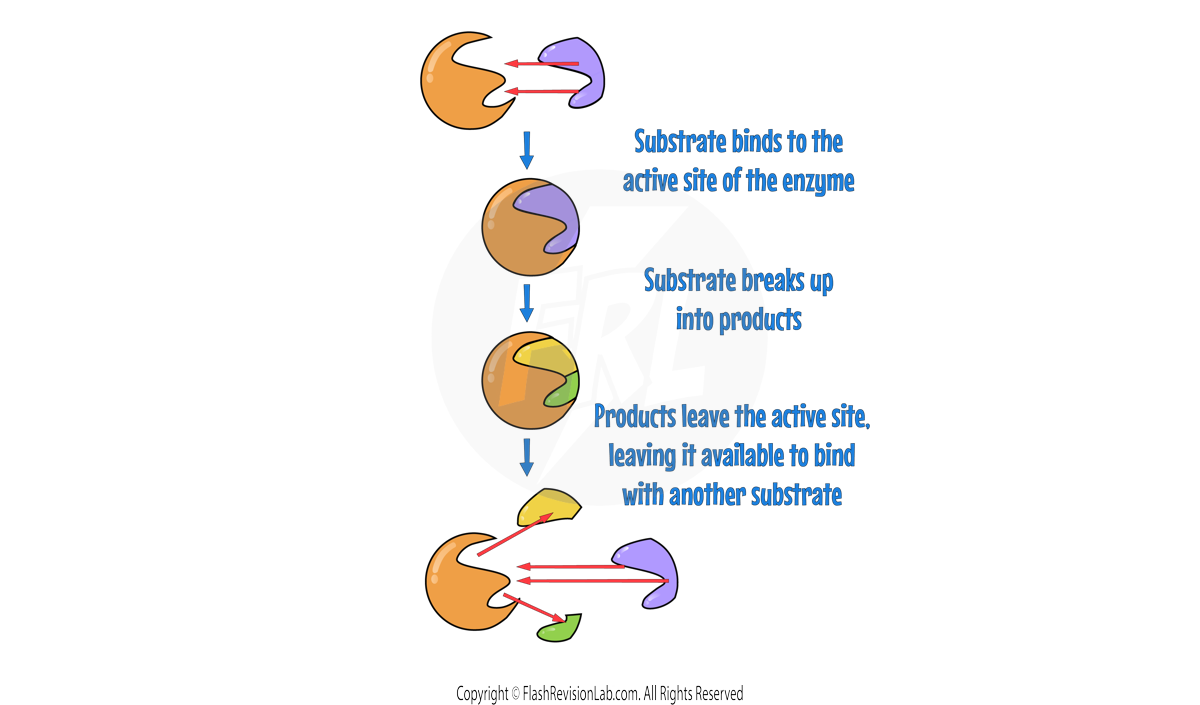
- This specificity means that enzymes catalyse one particular reaction, ensuring precision in biological processes.
- The concept of the 'LOCK AND KEY' model explains this specificity, although the more accurate 'INDUCED FIT' model acknowledges that the enzyme's active site changes slightly to secure the substrate.
Factors Affecting Enzyme Activity
Temperature
- As you increase the temperature, the rate at which the enzyme controlled reactions occur also increase up to a certain point.
- This is because the enzyme and substrates move around faster meaning there are MORE COLLISIONS per second.
- The rate is the fastest at the OPTIMUM TEMPERATURE.
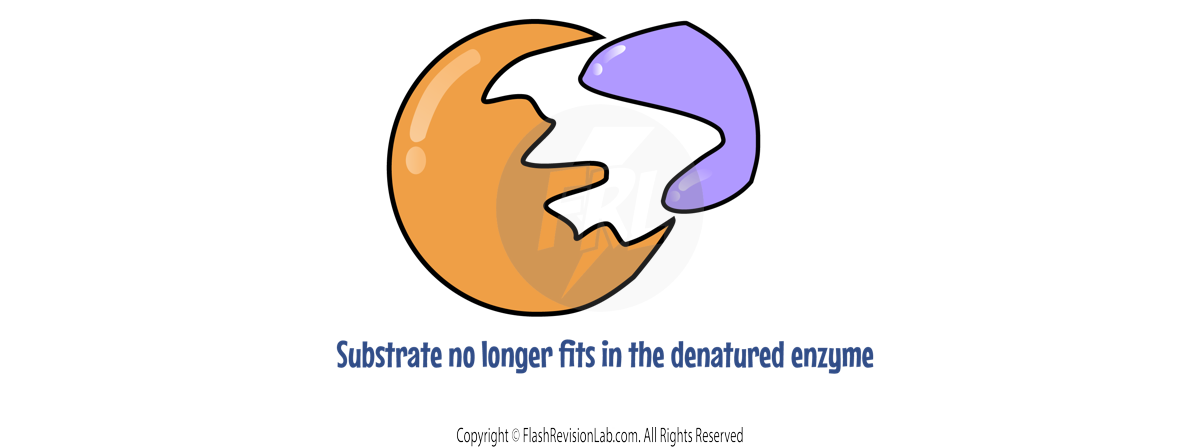
- As the temperature increases past the optimum, the rate DECREASES. This is because the enzymes DENATURE causing the active site to change shape.
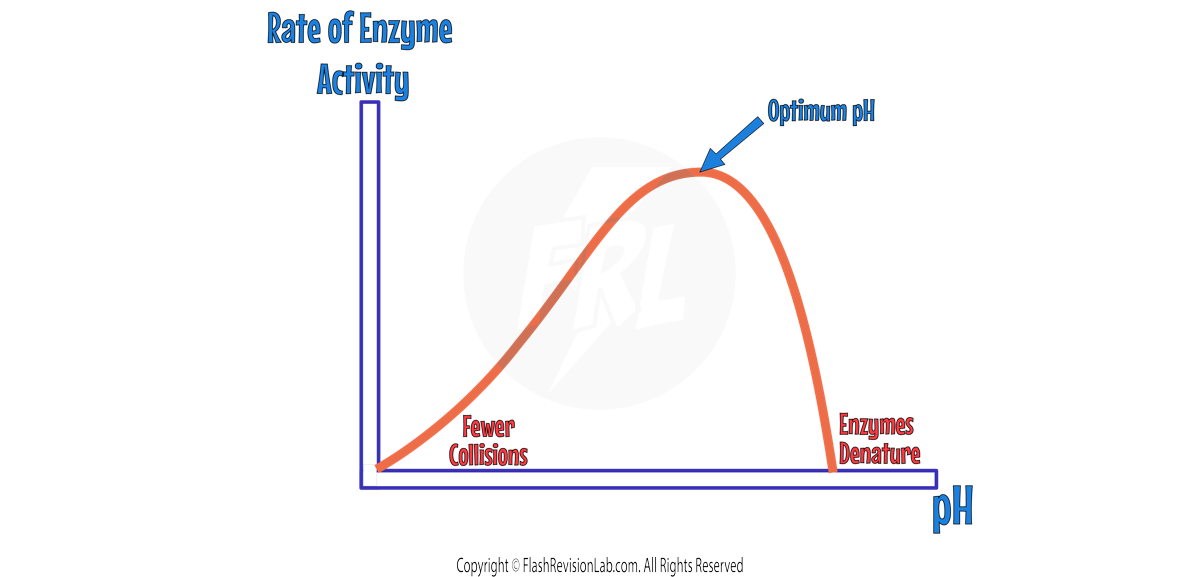
pH
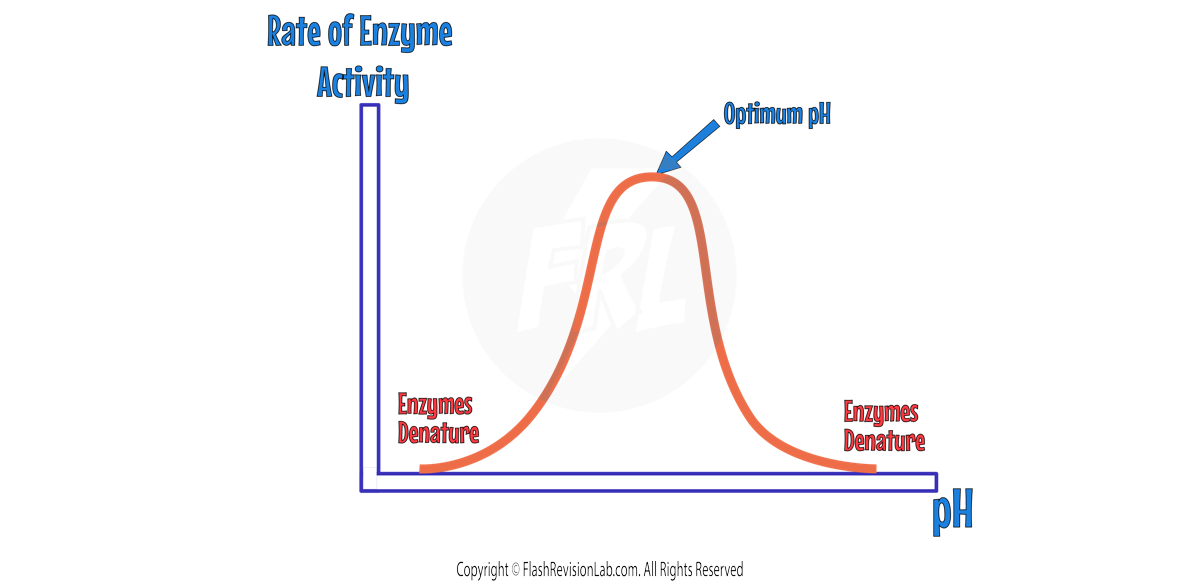
- All enzymes have an OPTIMUM pH that they work the best in
- As the pH increases or decreases from the optimum, the rate of reaction DECREASES. This is because enzymes DENATURE causing the active site to change shape.
- Most enzymes in the human body have an optimum pH of 7, but there are some which have different ones.
- The enzyme PEPSIN, for instance, works best in acidic conditions (pH 2) found in the stomach, which shows the importance of the optimum pH for enzyme activity.
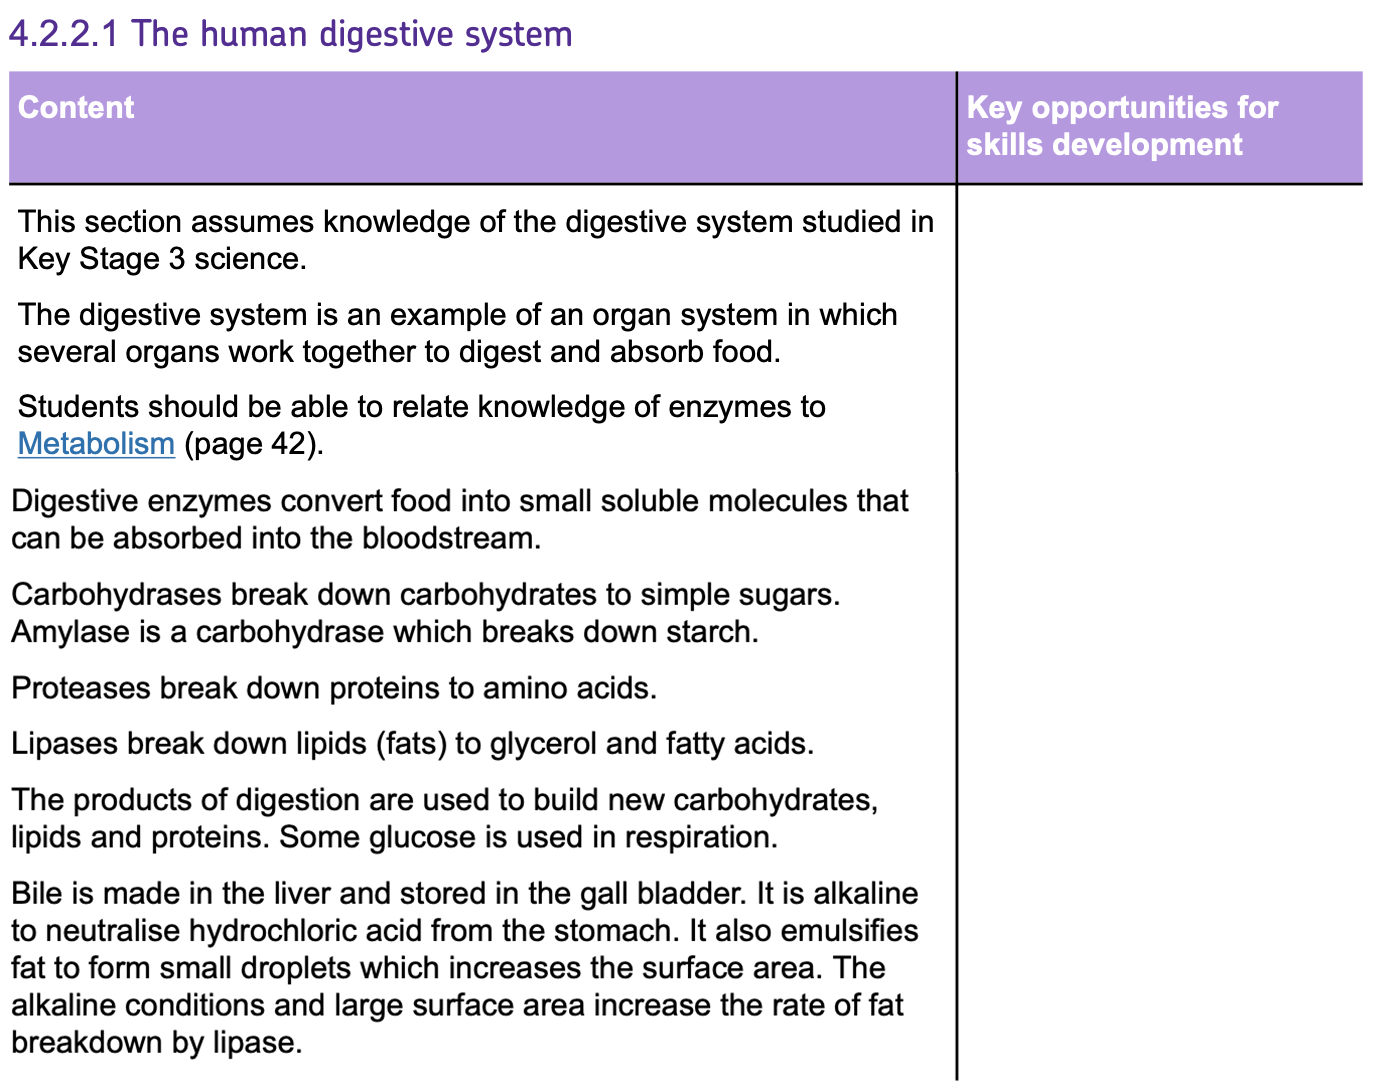
The Digestive System
Digestive Enzymes and Their Functions
Breaking Down Nutrients
- DIGESTIVE ENZYMES are crucial in breaking down large molecules like STARCH, PROTEINS, and FATS into smaller, soluble molecules. This allows them to be absorbed into the bloodstream.
There are THREE types of digestive enzymes
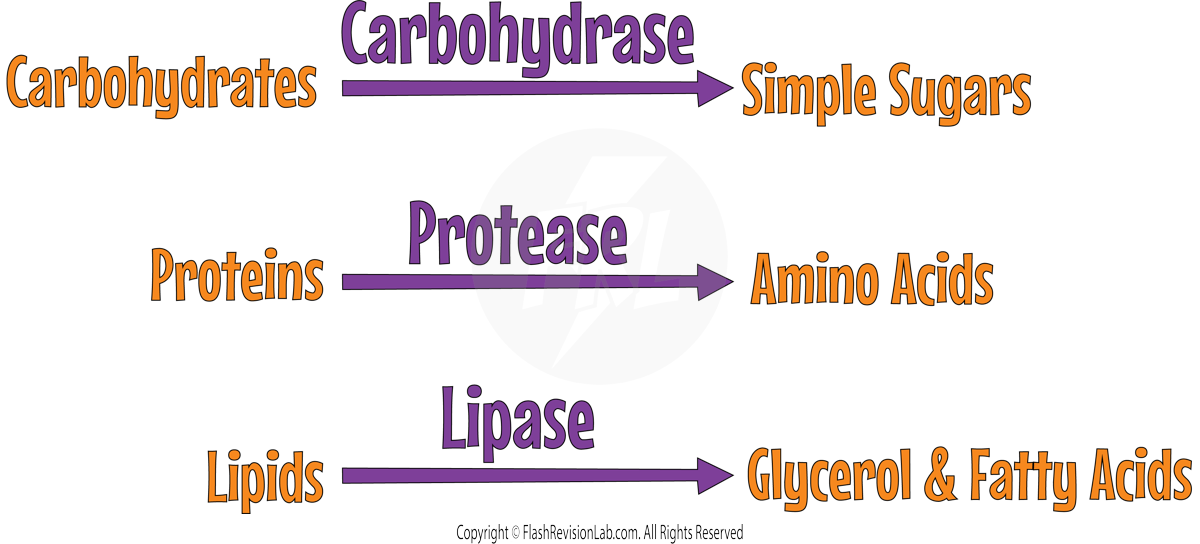
- CARBOHYDRASES break down carbohydrates into simple sugars.
- PROTEASES convert proteins into amino acids.
- LIPASES break down lipids into glycerol and fatty acids.
Examples of digestive enzymes:
- AMYLASE: A type of carbohydrase enzyme that breaks down STARCH into maltose (a simple sugar).
- PEPSIN: A type of protease enzyme that is produced in the STOMACH. It has a LOW OPTIMUM pH. The hydrochloric acid in the stomach provides a low pH for the pepsin to work at a faster rate. Pepsin breaks down PROTEINS into AMINO ACIDS.
Absorption and Utilisation of Digested Products
- Some products of digestion are used to synthesise new carbohydrates, proteins, and lipids.
- Other products are utilised in other ways, e.g. glucose is used in respiration to release energy.
The Digestive System & Enzymes
- Digestive enzymes are key in breaking down food into absorbable nutrients.
- These enzymes are produced by specialised cells in various digestive system GLANDS and the gut lining.
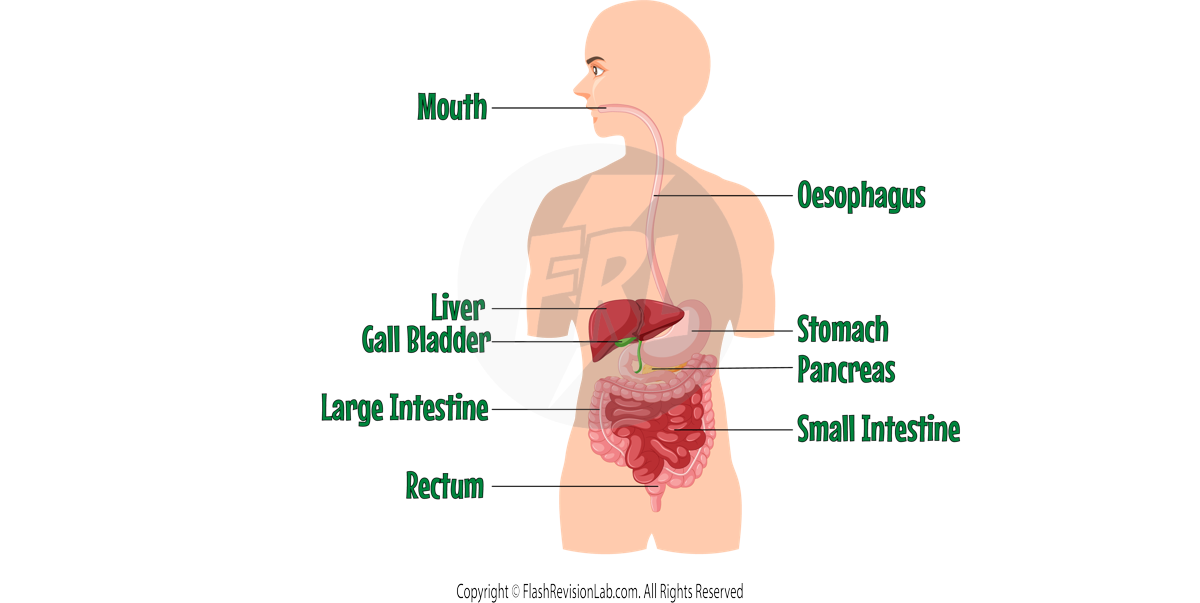
The Mouth
- Teeth CHEW the food
- SALIVARY GLANDS in the mouth secrete AMYLASE enzyme in saliva to begin carbohydrate digestion.
Oesophagus
- A tube that connects the mouth to the stomach
The Stomach
- Has muscular walls that churn food into smaller pieces
- It produces PEPSIN, a type of protease enzyme to break down PROTEINS
- It produces HYDROCHLORIC ACID to KILL BACTERIA and to provide the optimum pH for the pepsin to work in
The Liver
- Produces BILE, crucial for NEUTRALISING stomach acid and EMULSIFYING FATS into smaller droplets
- The bile is STORED in the GALL BLADDER.
The Pancreas
- It produces PROTEASE, CARBOHYDRASE, and LIPASE.
The Small Intestine
- It produces PROTEASE, CARBOHYDRASE, and LIPASE.
- This is where digestion is completed, where the broken down nutrients are ABSORBED into the bloodstream.
The Large Intestine
- The large intestine absorbs EXCESS WATER from digested food.
- Waste is eventually moved to the RECTUM as faeces and exits the body through the ANUS.
Required Practical: Enzymes
Practical Investigation of Amylase Activity
- This experiment is carried out to see the effect of pH on enzyme activity.
- The enzyme used is AMYLASE which breaks down STARCH into MALTOSE.
- The reaction will involve the amylase reacting with starch solution
- This reaction can be monitored using IODINE solution, which changes from brown-orange to blue-black in the presence of starch.

- If the enzyme does it’s job and the reaction is SUCCESSFUL, the starch will turn into maltose and the iodine solution will be BROWN-ORANGE.
- If the enzymes DENATURE and the reaction is NOT CARRIED OUT, starch will remain present and the iodine solution will be BLUE-BLACK.
- A BUFFER solution is used to change the pH of the reaction
Steps for Enzyme Activity Experiment
To examine the impact of pH on amylase, you can set up a practical experiment using the following steps:
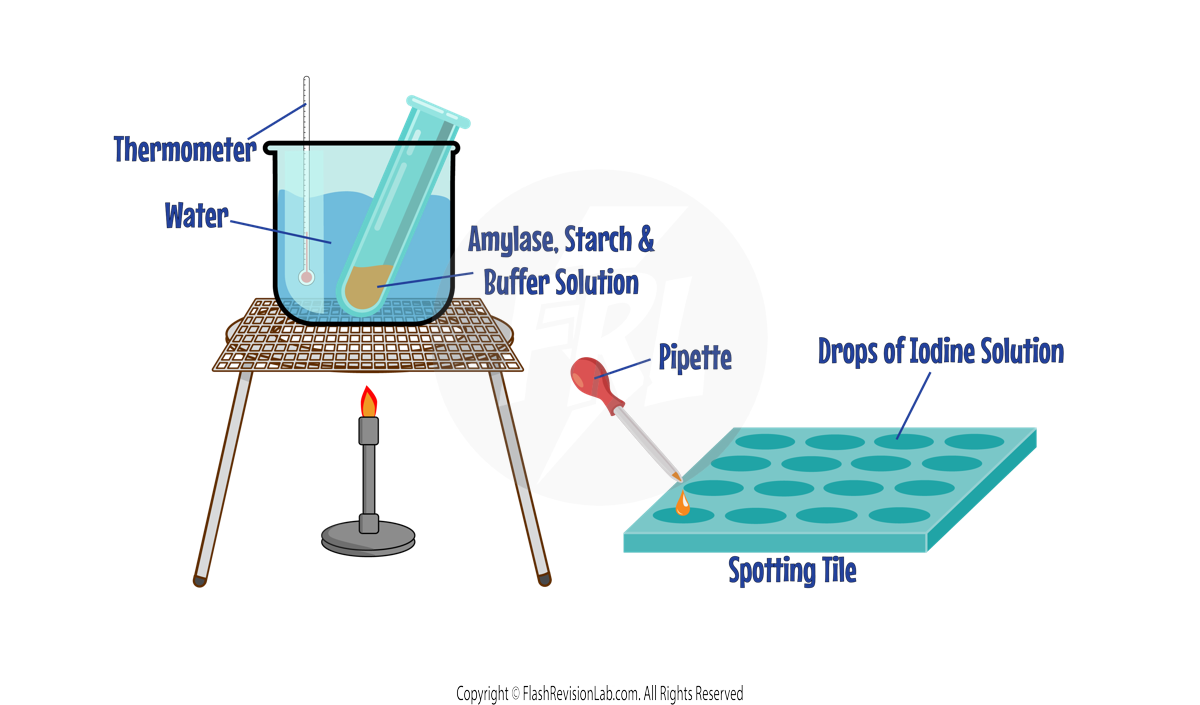
- Add iodine solution to each well of a SPOTTING TILE.
- Set up a WATER BATH at 35°C using a beaker of water and a thermometer for consistent temperature control during the experiment.
- Combine 1 cm³ of amylase solution with 1 cm³ of a buffer solution with a pH of 5 in a test tube.
- Place the tube in the water bath for five minutes using test tube holders.
- Add 5 cm³ of starch solution to the amylase and buffer mixture and start timing the reaction using a stopwatch.
- Every 30 seconds, use a DROPPING PIPETTE to add a drop of the mixture to the iodine on the spotting tile.
- Note the colour of the iodine
- Record when the iodine no longer turns BLUE-BLACK, indicating starch breakdown.
- Repeat with buffers of different pH values to see the effect of pH on amylase activity.
Understanding the Results
- The sooner the colour of the iodine solution stops turning BLUE-BLACK, the FASTER the rate of reaction, and the better the enzyme works.
- The pH at which the iodine stops turning blue-black the FASTEST, will be the OPTIMUM pH
- If the iodine remains BLUE-BLACK at a particular pH for the full amount of time, the amylase is assumed to have DENATURED, meaning the starch has NOT been broken down
- Comparing rates across different pH levels will highlight the pH sensitivity of amylase.
- CONTROLLED VARIABLES: Ensure a FAIR TEST by keeping other variables constant, such as amylase concentration and temperature.
Required Practical: Food Tests
Identifying Nutrients in Food Samples
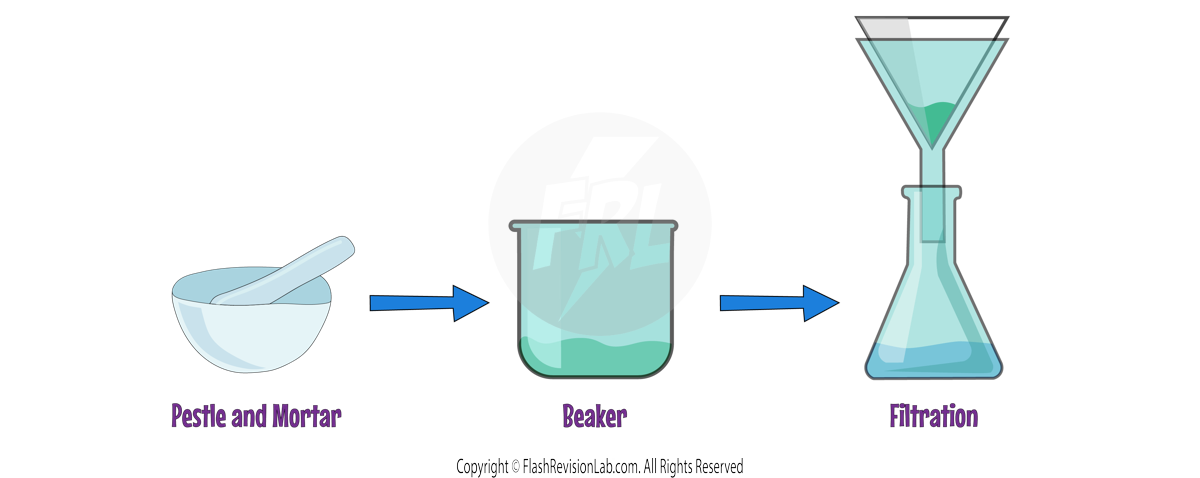
General Preparation for Food Tests
- Start by breaking down the food using a PESTLE AND MORTAR.
- Transfer the ground food into a BEAKER with distilled water.
- STIR the mixture to dissolve some food particles.
- FILTER the mixture to remove solid residues.
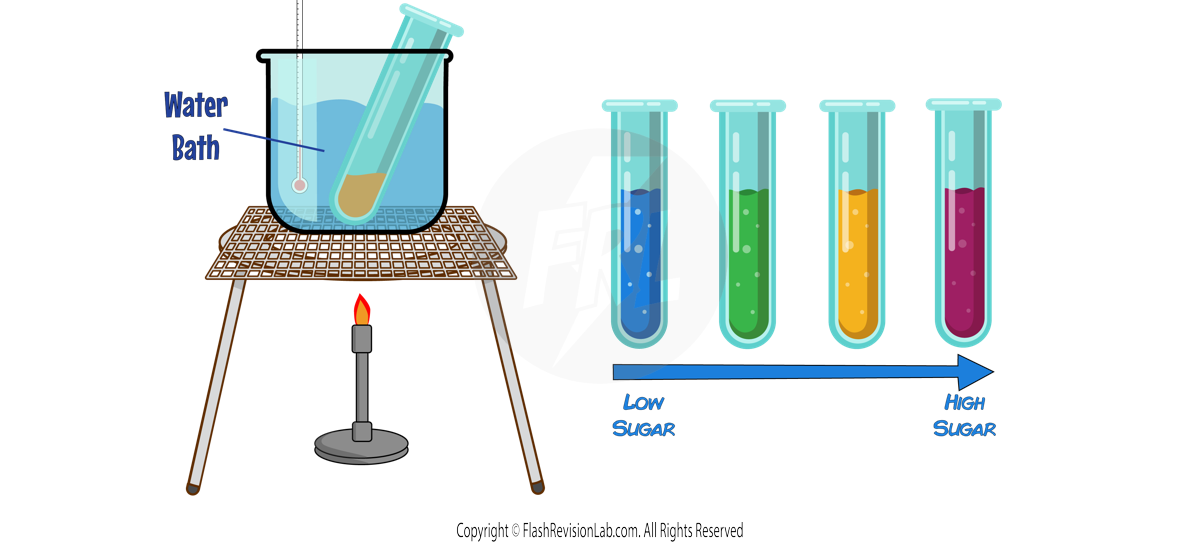
Testing for Sugars: BENEDICTS REAGENT
- Add the food sample to a test tube, mix in Benedict's solution.
- Heat the tube in a WATER BATH at 75°C for 5 minutes.
- A color change indicates the presence of reducing sugars, with the color varying from BLUE to GREEN to YELLOW or BRICK-RED depending on sugar concentration.
Testing for Starch: IODINE SOLUTION
- Place the sample in a test tube and add iodine solution.
- A color change from BROWN-ORANGE to BLUE-BLACK signifies the presence of starch.
Testing for Proteins: BIURET TEST
- Combine the food sample with Biuret solution in a test tube.
- Gently shake; a change to PURPLE indicates protein. If no protein, the solution remains BLUE.
Testing for Lipids: SUDAN III TEST:
- Add the food sample and Sudan III stain solution to a test tube without filtering.
- Gently shake the tube. Lipid presence will show as a separate BRIGHT RED LAYER.

The Circulatory System
The circulatory system is an ORGAN SYSTEM that transports many substances including FOOD and OXYGEN around the body, so that they can be received by cells.
It also transports WASTE SUBSTANCES out of cells so that they can be excreted.
It is mainly made out of BLOOD, BLOOD VESSELS and THE HEART.
Components and Functions of Blood
The blood is made out of 4 main components:
1. Red Blood Cells
- Red Blood Cells are specialised to carry OXYGEN.
- They have NO NUCLEUS to increase space to carry OXYGEN.
- They have a BICONCAVE DISC shape, increasing SURFACE AREA to carry more oxygen.
- Red blood cells contain HAEMOGLOBIN, a protein that binds to oxygen in the lungs and releases it in body tissues.

2. White Blood Cells
- White Blood Cells fight INFECTION and are a key part of the IMMUNE SYSTEM.
- They can change shape to ENGULF pathogens by PHAGOCYTOSIS.
- Some white blood cells produce ANTIBODIES and ANTITOXINS to fight infections.

3. Platelets
- Platelets are cell fragments important for BLOOD CLOTTING.
- They activate at injury sites to form clots, preventing excessive bleeding.
- A lack of platelets can lead to EXCESSIVE BLEEDING and INFECTION.

4. Plasma
- Plasma is the LIQUID in blood, which carries all the substances.
- It transports red blood cells, white blood cells, platelets, nutrients, hormones, proteins, carbon dioxide and urea

The Heart
- The heart is the central PUMP of the circulatory system, maintaining the flow of blood throughout the body.
- It supplies OXYGENATED blood to tissues and organs and returns DEOXYGENATED blood to the lungs for re-oxygenation.
- The walls of the heart are mostly made up of MUSCLE TISSUE which contract to pump the blood.
- The heart contains VALVES which prevent the BACKFLOW of blood.
How the Heart Pumps Blood
- The heart is a muscular organ divided into four chambers: two ATRIA and two VENTRICLES.
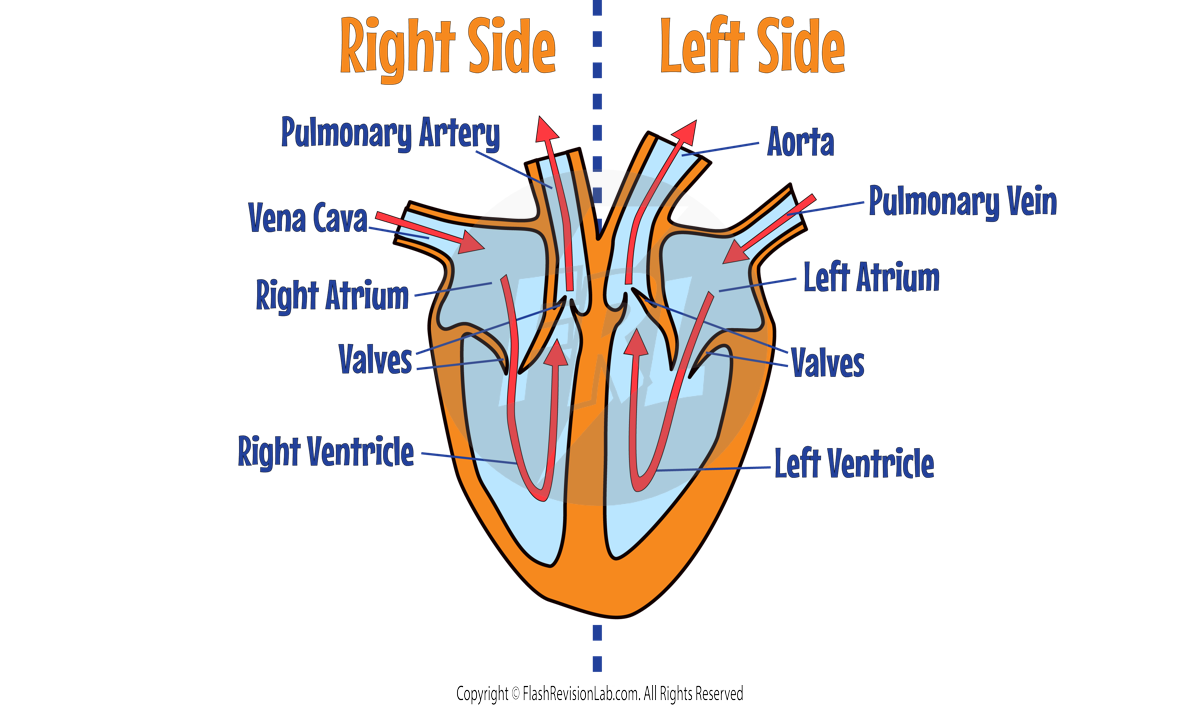
- Blood enters the atria from the VENA CAVA and PULMONARY VEIN.
- The atria contract, pushing blood into the ventricles, which then contract to send blood out of the heart via the PULMONARY ARTERY and AORTA.
- The LEFT side of the heart has THICKER WALLS than the right side. This because the left side needs to pump the blood to the REST OF THE BODY, therefore it needs to be pumped out at a much HIGHER PRESSURE.
The Double Circulatory System
- Humans have a DOUBLE CIRCULATORY SYSTEM consisting of two separate circuits that work together. Both circuits have the HEART at its centre which PUMPS blood.
- One circuit pumps blood to the LUNGS.
- The other circuit pumps blood to the REST OF THE BODY.
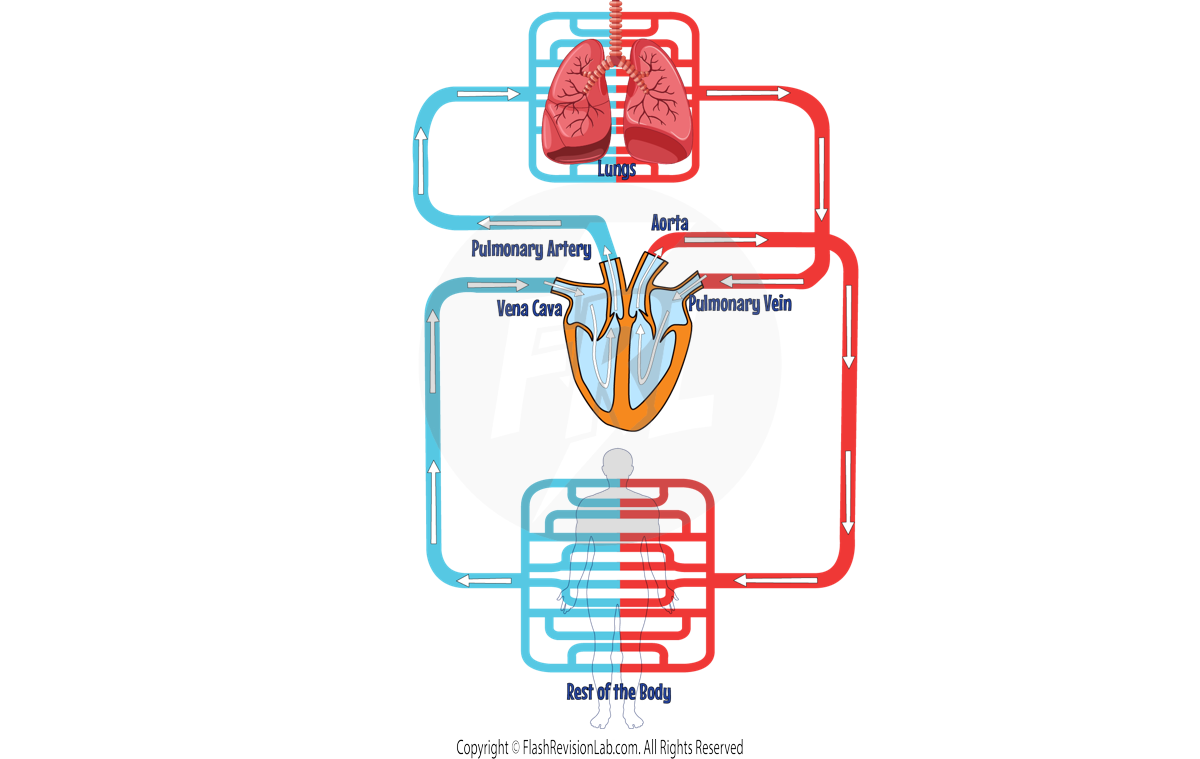
- The RIGHT VENTRICLE pumps deoxygenated blood to the LUNGS for gas exchange where oxygen is collected into the blood.
- The oxygenated blood returns from the lungs to the LEFT VENTRICLE, which then pumps it to the rest of the body.
- After delivering oxygen and collecting waste, blood returns to the heart, completing the cycle.
The Heart's Oxygen Supply
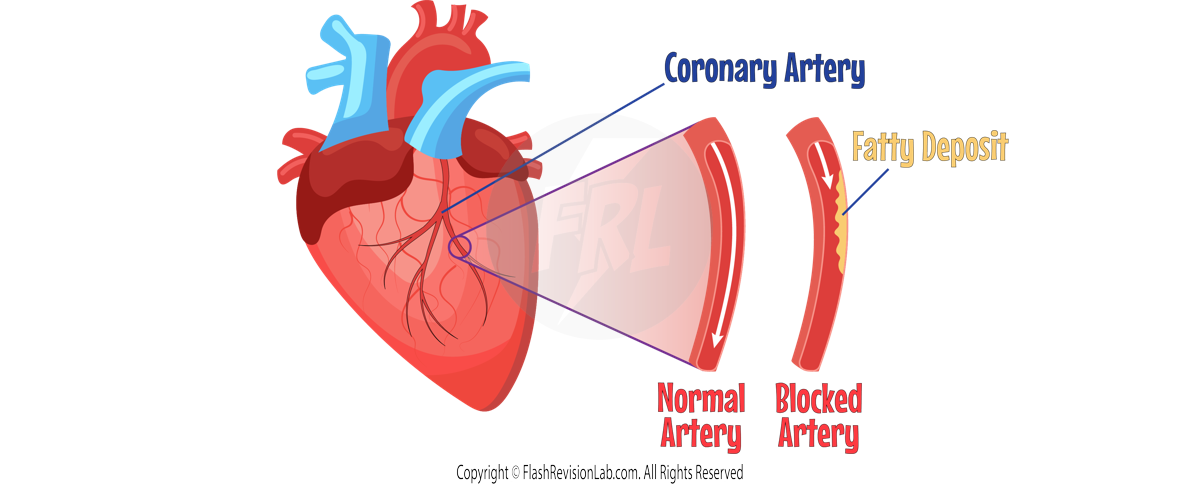
- The heart receives oxygenated blood through its own network of CORONARY ARTERIES, ensuring it has the oxygen it needs to function effectively. This is what causes the heart muscles to contract.
The Heart's Natural Pacemaker
- A group of cells in the RIGHT ATRIUM act as a natural PACEMAKER.
- It regulates the HEARTBEAT by generating ELECTRICAL IMPULSES that cause the heart muscles to contract.
- Some people may have a natural pacemaker that does NOT work properly. They can use an ARTIFICIAL pacemaker, which is a small device that is placed under the skin with a wire that connects it to the heart. The device produces an ELECTRICAL CURRENT that keeps the heart beating.
Types and Functions of Blood Vessels
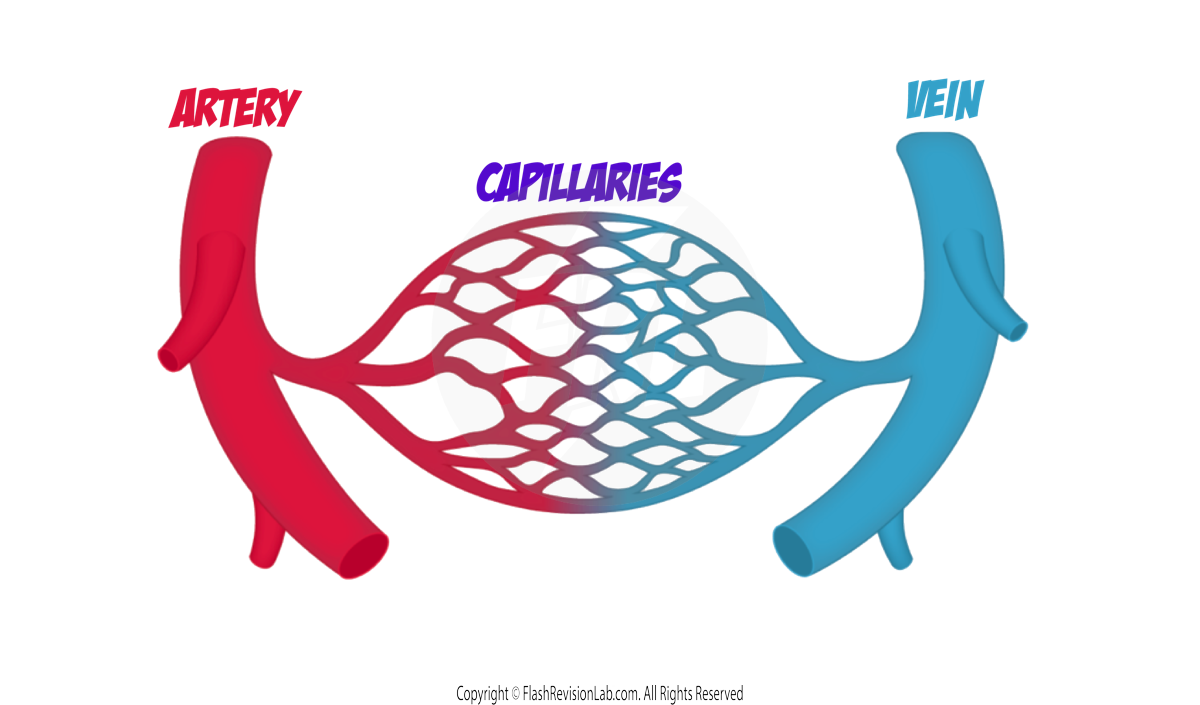
ARTERIES, CAPILLARIES, and VEINS are the three types of blood vessels, each designed for specific functions within the circulatory system.
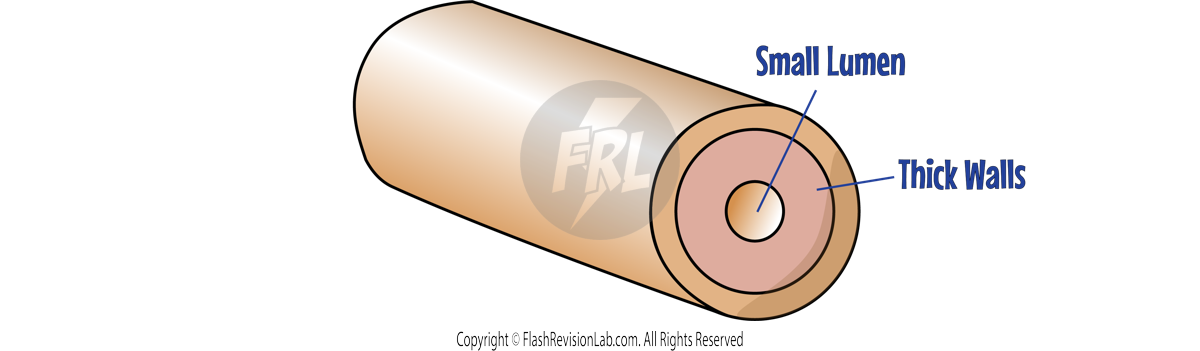
Arteries:
- Arteries transport blood AWAY from the heart under HIGH PRESSURE.
- Their walls are THICK and muscular, with elastic fibers to withstand and maintain this pressure.
- The LUMEN (the interior passage of a blood vessel) is SMALL in comparison to its walls.
Capillaries:
- Capillaries are tiny blood vessels where the actual EXCHANGE of gases and nutrients occurs.
- They are extremely small, with walls only ONE CELL THICK, facilitating the diffusion of substances.
- Oxygen and nutrients pass from capillaries to body cells, while carbon dioxide and other wastes are collected for removal.

Veins:
- Veins carry deoxygenated blood back TOWARDS the heart.
- They have a LARGER LUMEN than arteries with THINNER WALLS.
- They carry blood at a LOWER PRESSURE.
- They have VALVES to prevent backflow of blood.

Anatomy and Function of the Lungs
The lungs are an important part of the circulatory system, which are involved in the OXYGENATING of the blood
Structure of the Lungs
- The LUNGS are located in the THORAX.
- Air enters the lungs through the TRACHEA, which divides into two BRONCHI, one for each lung.
- The BRONCHI branch into smaller tubes called BRONCHIOLES, ending in tiny air sacs known as ALVEOLI where gas exchange occurs.
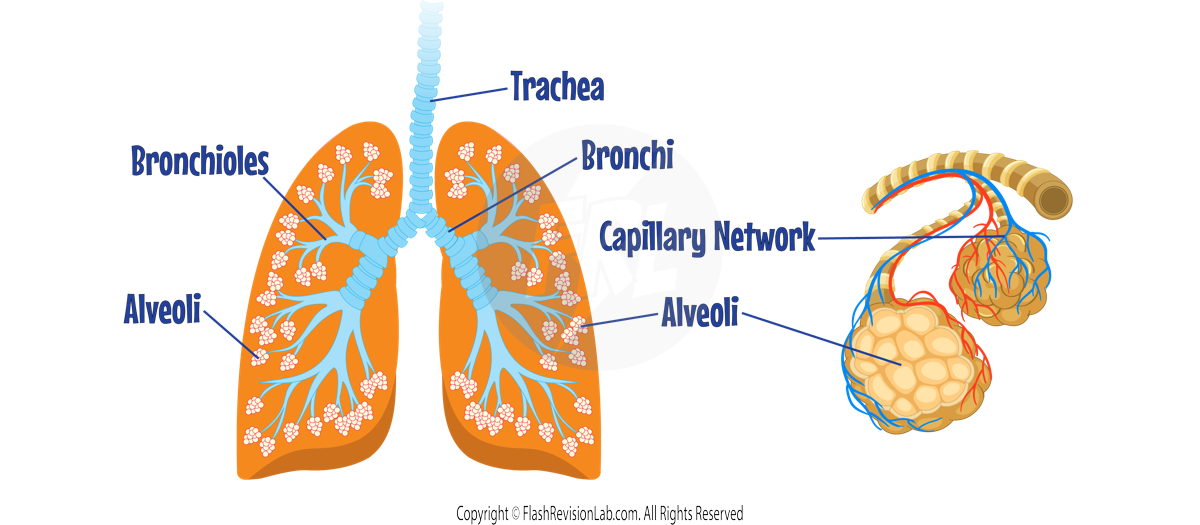
Gas Exchange Process
- ALVEOLI are the sites of gas exchange, and are surrounded by a CAPILLARY NETWORK.
- Oxygen diffuses from the alveoli into the blood, while carbon dioxide moves from the blood into the alveoli to be exhaled.
- This exchange ensures oxygenation of blood and removal of carbon dioxide, a by-product of respiration.
Cardiovascular Disease
These are diseases which are related to the CIRCULATORY SYSTEM.
Coronary Heart Disease
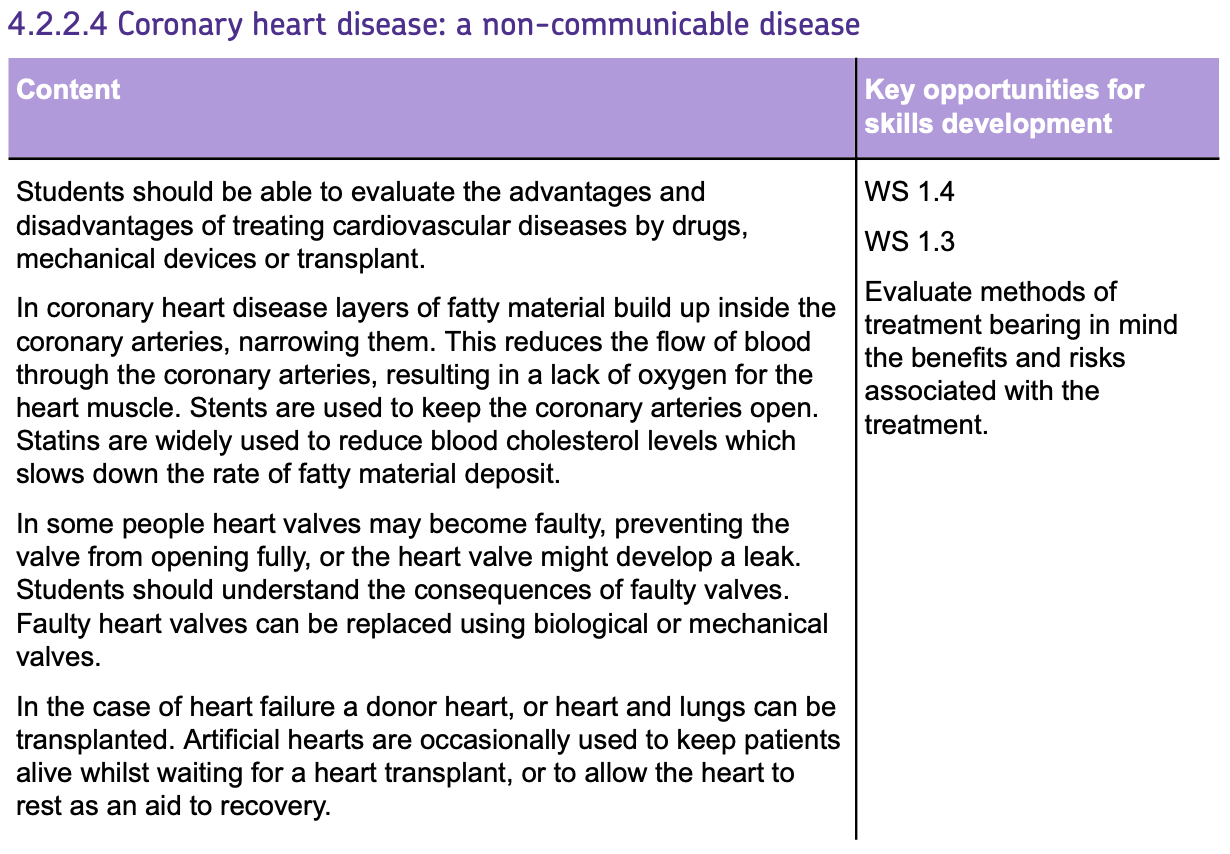
Coronary heart disease (CHD) is a significant health condition where the CORONARY ARTERIES (the blood vessels supplying oxygen-rich blood to the heart muscle) become narrowed by a gradual build-up of FATTY MATERIAL. This condition can lead to chest pain, shortness of breath, and in severe cases, HEART ATTACKS.
Treating CHD
1. Stents
- A STENT is a device used to keep coronary arteries OPEN, ensuring adequate blood flow to the heart.
- They are typically made of metal mesh and are inserted into clogged arteries.
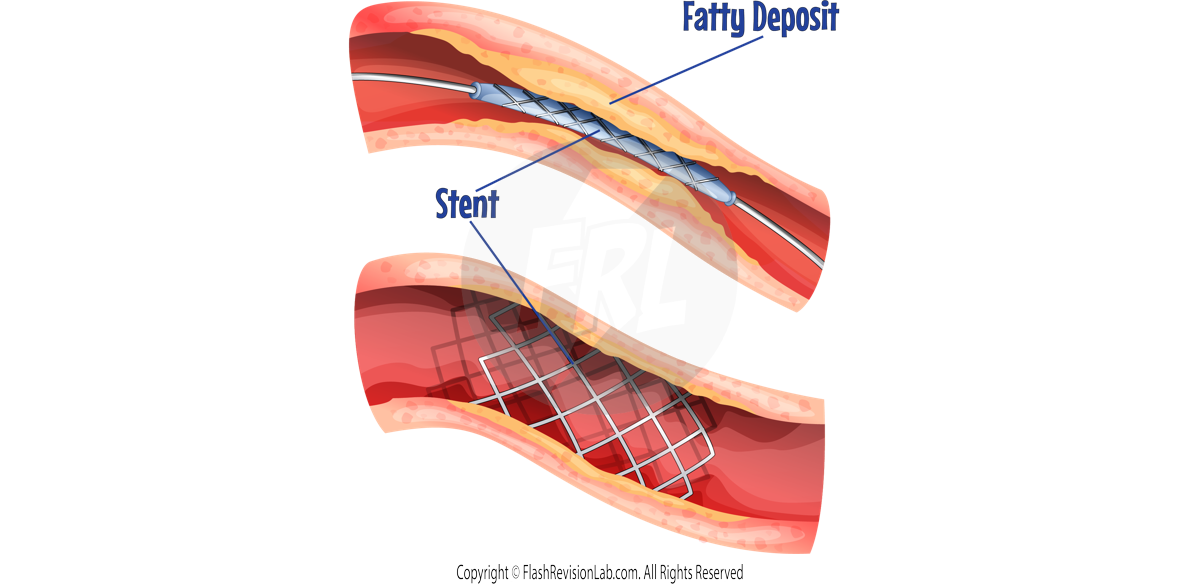
- Stents can reduce the symptoms of CHD, like chest pain, and help minimise the risk of a heart attack by preventing the artery from re-narrowing.
2. Statins
- STATINS are a class of DRUGS used to lower cholesterol levels in the blood, particularly the 'bad' LDL cholesterol that contributes to fatty deposit build-up.
- By reducing LDL levels, statins help to slow the progression of CHD and can also stabilise existing fatty deposits, making it less likely to cause a heart attack.

Advantages of Statins
- Statins are proven to decrease the chances of STROKE and HEART DISEASE.
- They contribute to increasing 'good' cholesterol, which helps remove bad cholesterol from the body.
Disadvantages of Statins
- Regular, long-term medication is required, which means they must be taken as prescribed without interruption.
- Potential SIDE EFFECTS may impact patients' well-being and can range from mild to severe.
- The positive effects of statins on cholesterol levels are gradual and require time to become significant.
3. Artificial Hearts
- ARTIFICIAL HEARTS may be utilised when a patient's heart has failed and a heart transplant isn't immediately available or suitable.
- These devices are typically a temporary solution but can sometimes be permanent.
- The key benefit is REDUCED RISK OF REJECTION by the body's immune system because they are made from MAN-MADE materials, unlike donor hearts.
- However, there are risks of BLEEDING and INFECTION.
- Mechanical parts of the artificial heart can wear out, and the electrical motor could fail.
4. Valve Replacement Therapies
- Damaged or faulty heart valves can be replaced with BIOLOGICAL or MECHANICAL valves.
- Biological valves are derived from other mammals, like cows or pigs.
- Mechanical valves are man-made and durable.
- Valve replacement is significant surgery but less so than heart transplantation.
Non-Communicable Diseases
Health and Disease
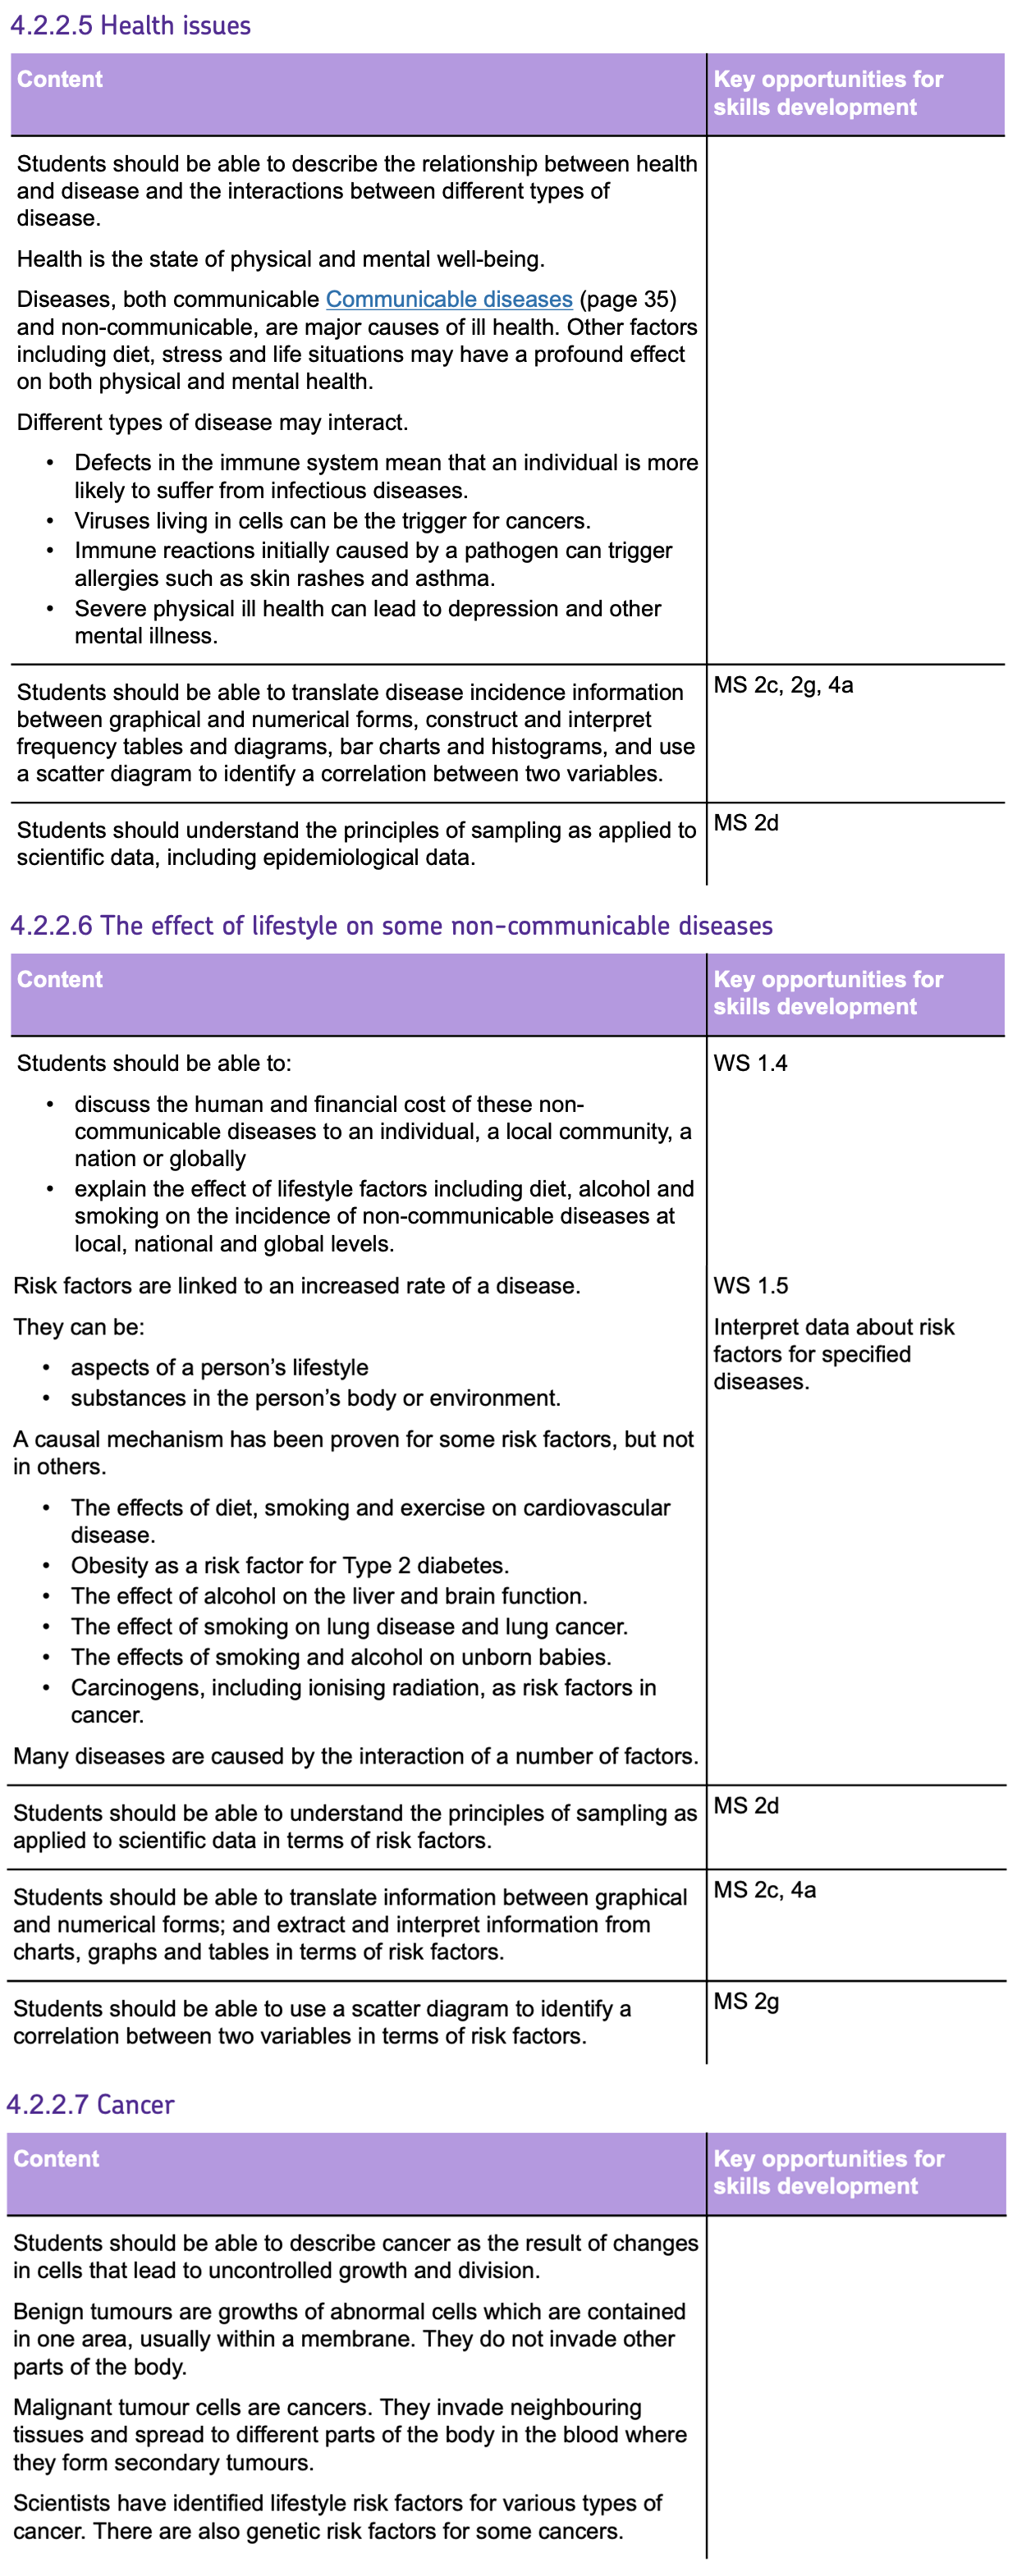
- HEALTH is a state of complete physical and mental well-being.
- DISEASES disrupt this state and are classified as either COMMUNICABLE or NON-COMMUNICABLE.
Communicable Diseases
- These are infections that SPREAD between organisms, often caused by bacteria, viruses, parasites, or fungi.
- Examples include MEASLES, SALMONELLA and MALARIA.
Non-Communicable Diseases
- These diseases do NOT spread from person to person and typically progress slowly. They include conditions like CANCER, DIABETES and CORONARY HEART DISEASE.
Interaction Between Disease Types
Diseases can INTERACT, where one may aggravate symptoms or lead to the development of another. For example:
- If someone had a DEFECTED IMMUNE SYSTEM, that person is more likely to suffer from infectious disease.
- Some VIRUSES living in cells can be the trigger for CANCERS.
- Immume reactions initially caused by a PATHOGEN can trigger ALLERGIES such as SKIN RASHES and ASTHMA.
- Mental health can also be affected by physical health issues, influencing a person’s overall well-being.
Health and Lifestyle
Various certain lifestyle choices can significantly impact health, particularly non-communicable diseases. These include:
1. Balanced Diet
A BALANCED DIET is crucial. It should provide all the necessary nutrients in the correct amounts. Lack of a balanced diet leads to health issues like OBESITY, MALNUTRITION, and even MENTAL HEALTH struggles due to deficiencies in essential nutrients.
2. Stress Management
STRESS is a silent contributor to many health problems. Chronic stress can lead to serious health issues, including HYPERTENSION, HEART DISEASE, and a WEAKENED IMMUNE SYSTEM. Effective stress management strategies are essential for maintaining good health.
3. Life Situation
Access to healthcare and preventive measures plays a significant role in one's health. Factors like access to MEDICINES, HEALTHY FOOD, and preventive tools like CONDOMS can prevent diseases and improve the quality of life.
Lifestyle and Non-communicable Diseases
Lifestyle has a profound effect on non-communicable diseases. Here's how:
- DIET: Poor diet can lead to diseases like TYPE 2 DIABETES and CARDIOVASCULAR DISEASES.
- ALCOHOL and SMOKING: A major risk factor for numerous diseases, including CANCER and HEART DISEASE. Quitting smoking can drastically reduce these risks.
- EXERCISE: Regular physical activity can help prevent and manage diseases like HEART DISEASE, DIABETES, and OBESITY.
The Wider Impact
Understanding how lifestyle factors affect non-communicable diseases isn't just about personal health. It's also about the HUMAN COST and FINANCIAL BURDEN these diseases place on communities and healthcare systems globally.
HUMAN COST:
- Non-communicable diseases claim millions of lives annually, affecting not only the individuals' health but also their QUALITY OF LIFE.
- Those afflicted may face a shortened lifespan and significant day-to-day challenges.
FINANCIAL IMPACT:
- The economic burden of non-communicable diseases is substantial. The NATIONAL HEALTH SERVICE (NHS) spends a significant amount MONEY on RESEARCH and TREATMENT of these diseases.
- Families often bear a personal financial strain due to these diseases. They may need to RELOCATE or MODIFY HOMES to support a family member with a chronic illness, leading to HIGH EXPENSES.
- Loss of income can occur if the family member with the disease is UNABLE TO WORK, further stressing family FINANCES and potentially impacting the ECONOMY at large due to reduced workforce participation.
Risk Factors
What are Risk Factors?
- RISK FACTORS are factors that increase the chances of a person developing diseases.
- They include the person’s lifestyle choices and the environment the person is exposed to.
Direct and Indirect Causes of Disease
Certain risk factors, can lead to other diseases and problems. Here are some examples:
1. Smoking
- SMOKING can directly cause diseases such as CARDIOVASCULAR DISEASE, LUNG DISEASE and various cancers such as LUNG and MOUTH CANCER.
- Smoking when PREGNANT can cause many health problems for the unborn baby.
2. Obesity
- OBESITY can make the body less responsive to insulin, leading to TYPE 2 DIABETES.
3. Alcohol
- ALCOHOL CONSUMPTION is linked to LIVER DISEASES and can impact brain function.
4. Carcinogens
- Exposure to specific substances or radiation, known as CARCINOGENS, can directly cause cancer. For instance, ionising radiation from X-RAYS is a well-known carcinogen.
CANCER
Cancer is a condition characterised by UNCONTROLLED CELL GROWTH AND DIVISION.
This can lead to the formation of TUMOURS, which are classified as either BENIGN or MALIGNANT.
BENIGN TUMORS are growth of abnormal cells which are contained in one area, usually within a membrane. They do not invade other parts of the body and are NOT CANCEROUS.
MALIGNANT TUMORS, are CANCEROUS. They invade neighbouring tissues and spread to different parts of the body in the blood where they form SECONDARY TUMOURS.
Risk Factors for Cancer
The risk factors that increase the likelihood of developing cancer can be LIFESTYLE-RELATED or GENETIC.
Lifestyle-Related Risk Factors
- Smoking: A leading cause of lung cancer and also linked to other types, including mouth and cervical cancer.
- Obesity: Increases the risk of several cancers such as breast, liver, and kidney.
- UV Exposure: Exposure to ultraviolet rays from the sun increases the risk of skin cancer.
- Viral Infections: Some viruses, like human papillomavirus (HPV), can increase the risk of cancers like cervical cancer.
Genetic Risk Factors
- Inherited genes can make individuals more susceptible to cancer. For instance, mutations in the BRCA genes significantly increase the risk of breast and ovarian cancers.
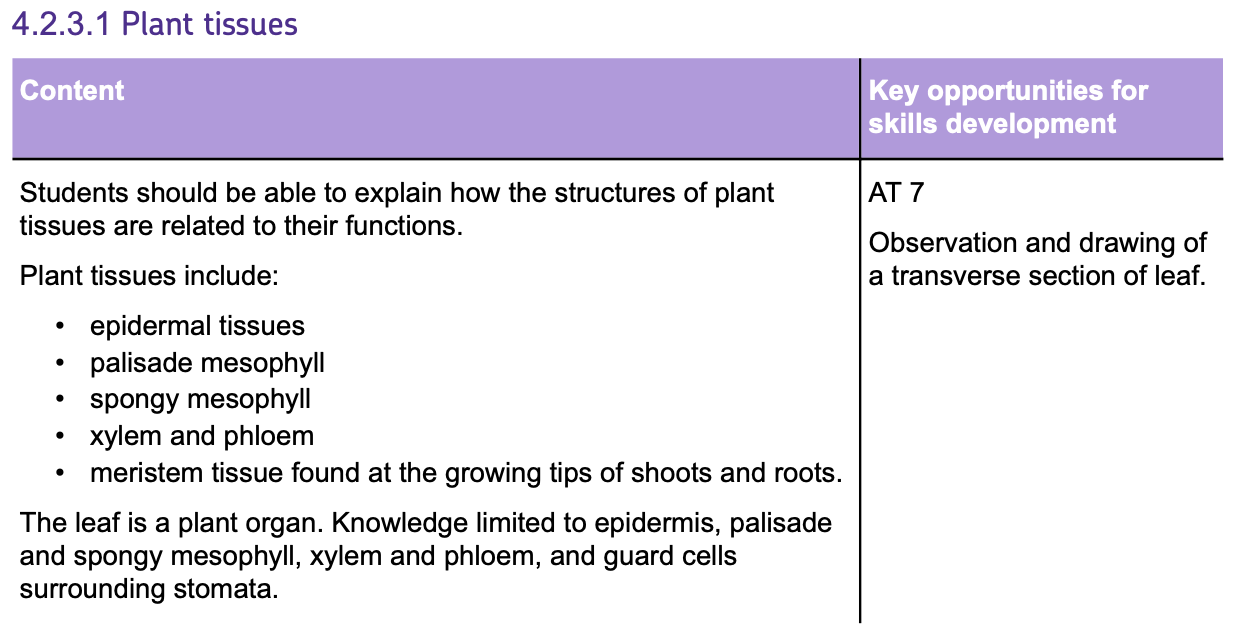
Plant Cells and Tissues
Tissue Types in Plants
- Epidermal Tissue
- Palisade Mesophyll
- Spongy Mesophyll
- Xylem and Phloem
- Meristem Tissue: Located at GROWTH POINTS at the TIPS of shoots and roots. These cells specialise through DIFFERENTIATION to become various specialised plant cell types.
The Leaf
Composed of several tissue types, including epidermal, mesophyll, xylem and phloem tissues, the leaf is a plant organ and is key for PHOTOSYNTHESIS and GAS EXCHANGE.
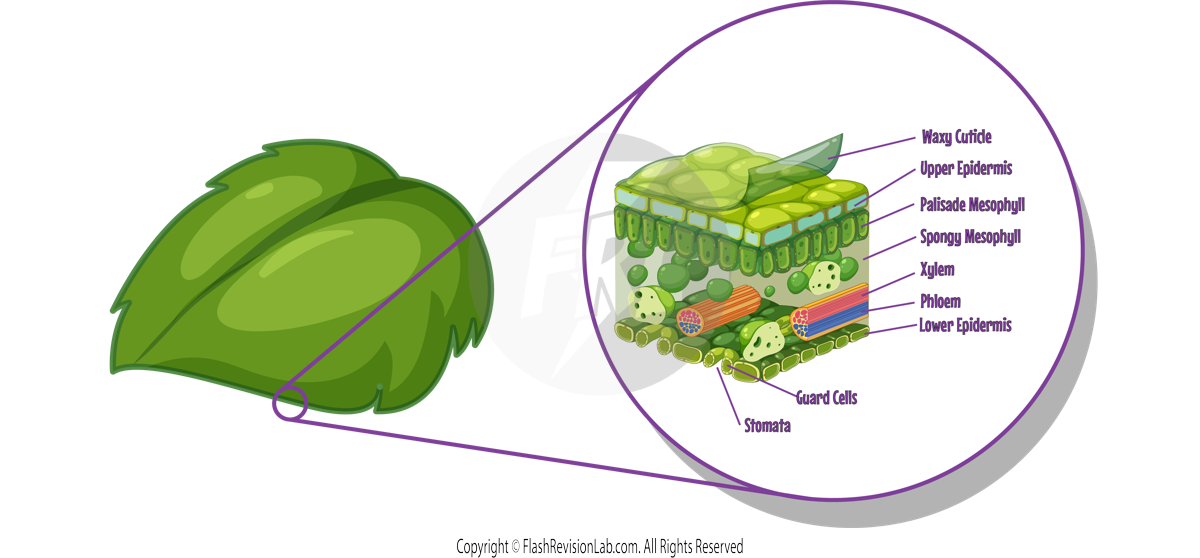
- UPPER EPIDERMIS
- This is the outermost layer of cells on the leaf. It is TRANSPARENT so it allows sunlight to pass through to the chloroplast-rich layers beneath, which is vital for photosynthesis.
- PALISADE MESOPHYLL
- Located just below the upper epidermis, this layer consists of CLOSELY PACKED CELLS that contain MANY CHLOROPLASTS to maximise light absorption for photosynthesis.
- SPONGY MESOPHYLL
- The cells here are arranged MORE LOOSELY, which creates air spaces to facilitate the efficient diffusion of gases like carbon dioxide (CO₂). This structure enhances the leaf's SURFACE AREA TO VOLUME RATIO.
- LOWER EPIDERMIS
- Similar to the upper layer but mainly contains STOMATA and GUARD CELLS that regulate gas exchange and water loss from the leaf.
- STOMATA
- These are HOLES primarily found on the lower epidermis that allow for the exchange of oxygen and carbon dioxide. They open during the day to facilitate photosynthesis and close at night to conserve water.
- GUARD CELLS
- These are cells found either side of the stomata and can change shape to open or close them. They REGULATE WATER AND GAS EXCHANGE by reacting to environmental conditions.
- XYLEM AND PHLOEM
- This is the plant's TRANSPORT SYSTEM. The xylem transports water and minerals from the roots upward throughout the plant, while the phloem distributes sugars and other nutrients from the leaves to the rest of the plant.
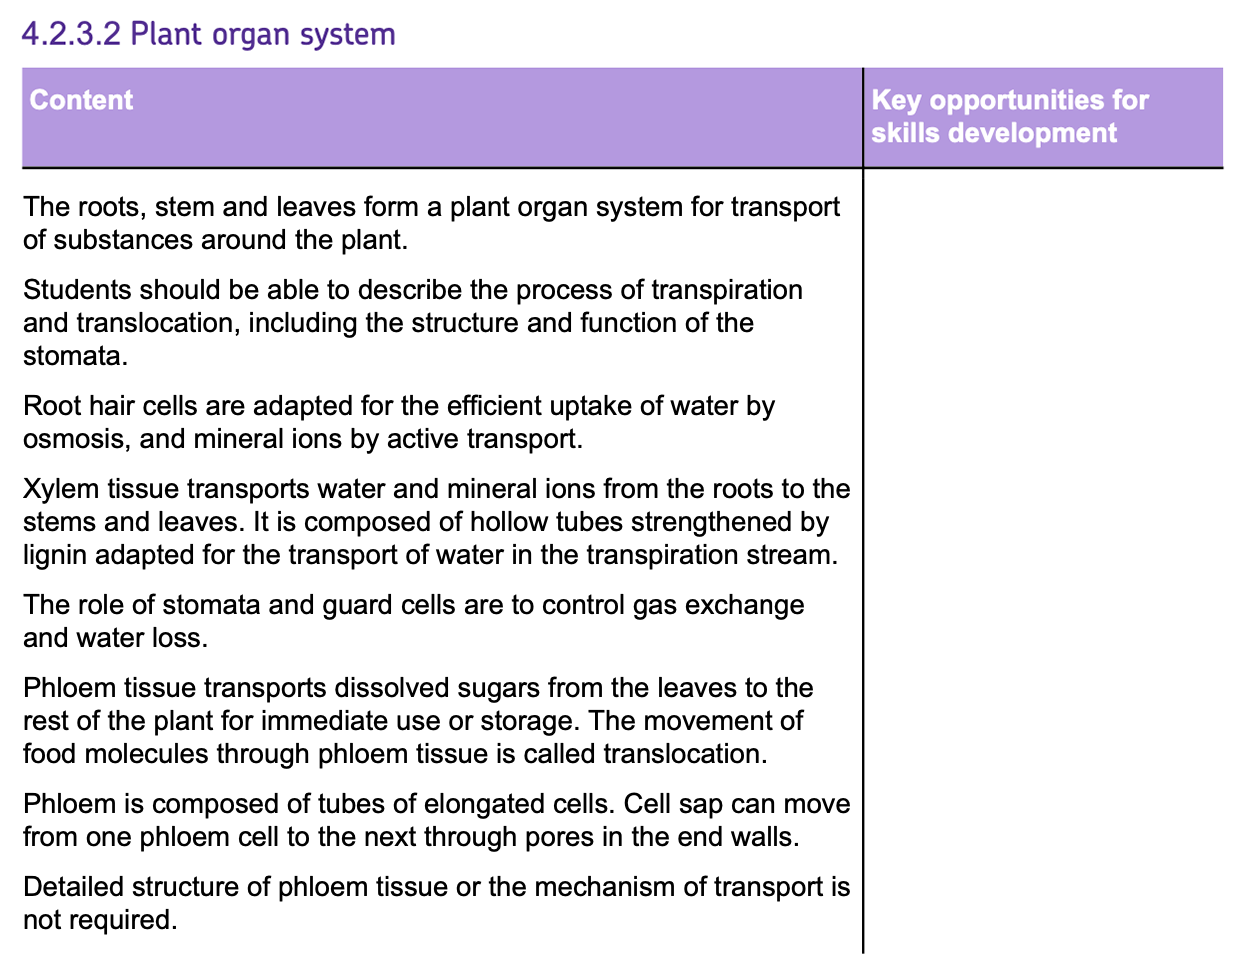
Plant Organ Systems
The roots, stem and leaves form a plant organ system for TRANSPORT OF SUBSTANCES around the plant. Here are examples of different structures within plants and how they're adapted to perform their functions:
1. Phloem Tubes
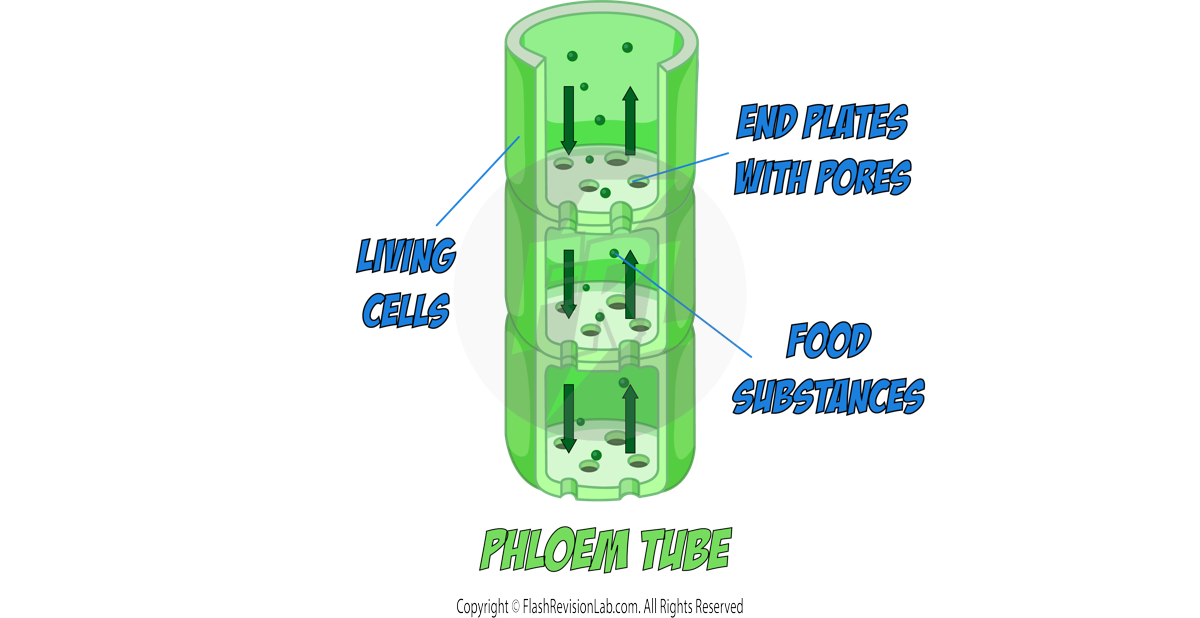
- Transports SUGAR and other FOOD SUBSTANCES in the form of CELL SAP around the plant.
- They are made of ELONGATED LIVING CELLS that are joined together to create a continuous tube.
- Cell sap can move from one phloem cell to the next through PORES in the end walls.
- The sugar and nutrients can travel in BOTH DIRECTIONS of the phloem.
- The process where sugar and nutrients move through the phloem is called TRANSLOCATION.
2. Xylem Tubes
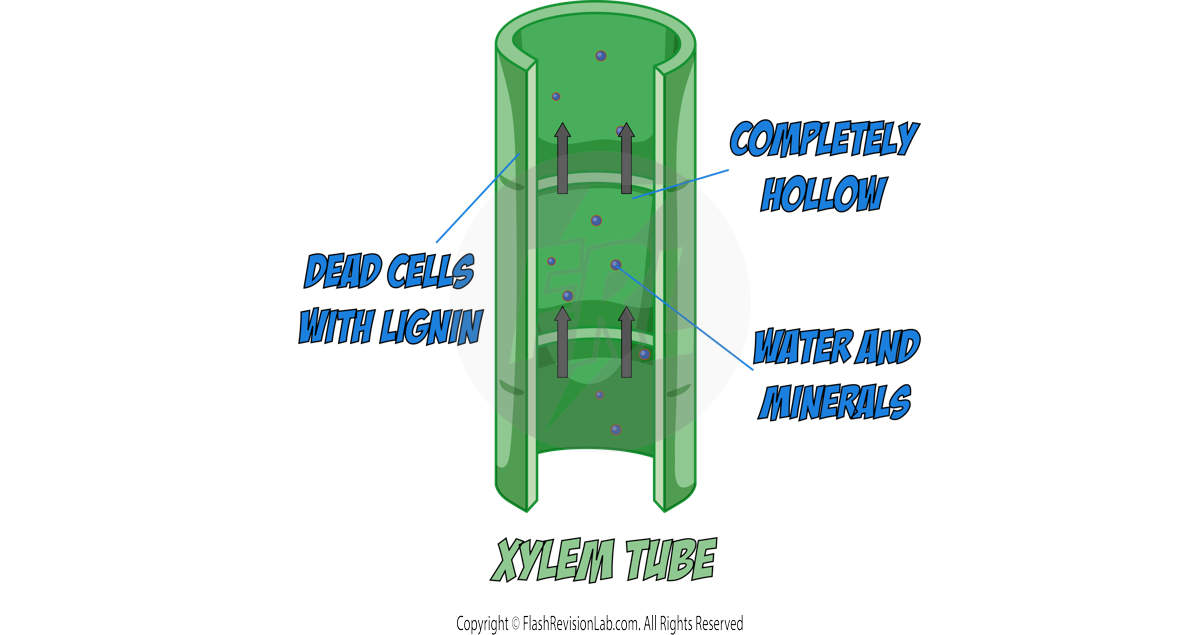
- Transports WATER and MINERALS from the roots to the leaves.
- They are made of DEAD CELLS that form continuous tubes and are strengthened by a substance known as LIGNIN.
- The xylem is completely HOLLOW
- The water and minerals can only move in ONE DIRECTION up the plant from the roots to the leaves.
- The route that the xylem takes is known as the TRANSPIRATION STREAM.
3. Root Hair Cells:
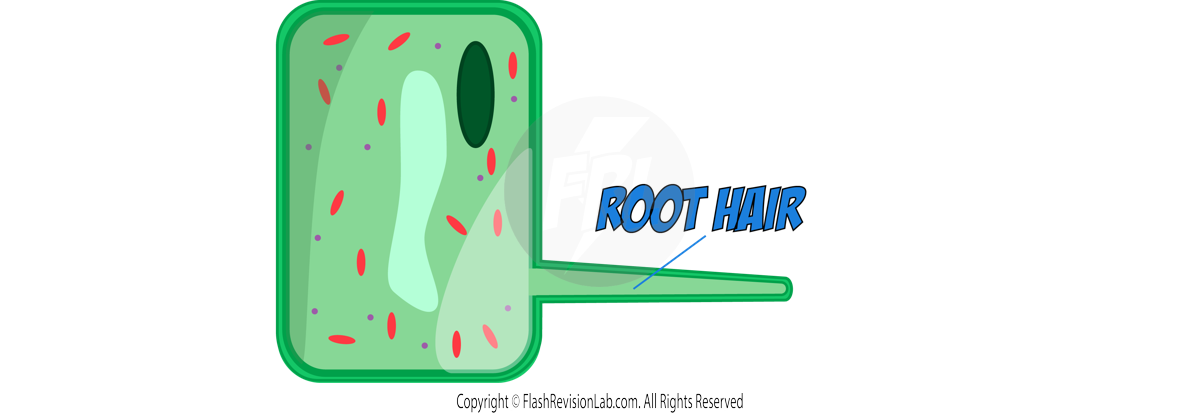
- Found in the ROOTS and are specialised for ABSORBING WATER AND MINERALS.
- Water is taken in by OSMOSIS and minerals are taken in by ACTIVE TRANSPORT.
- They grow long "hairs" to INCREASE SURFACE AREA for absorption from the soil.
4. Stomata
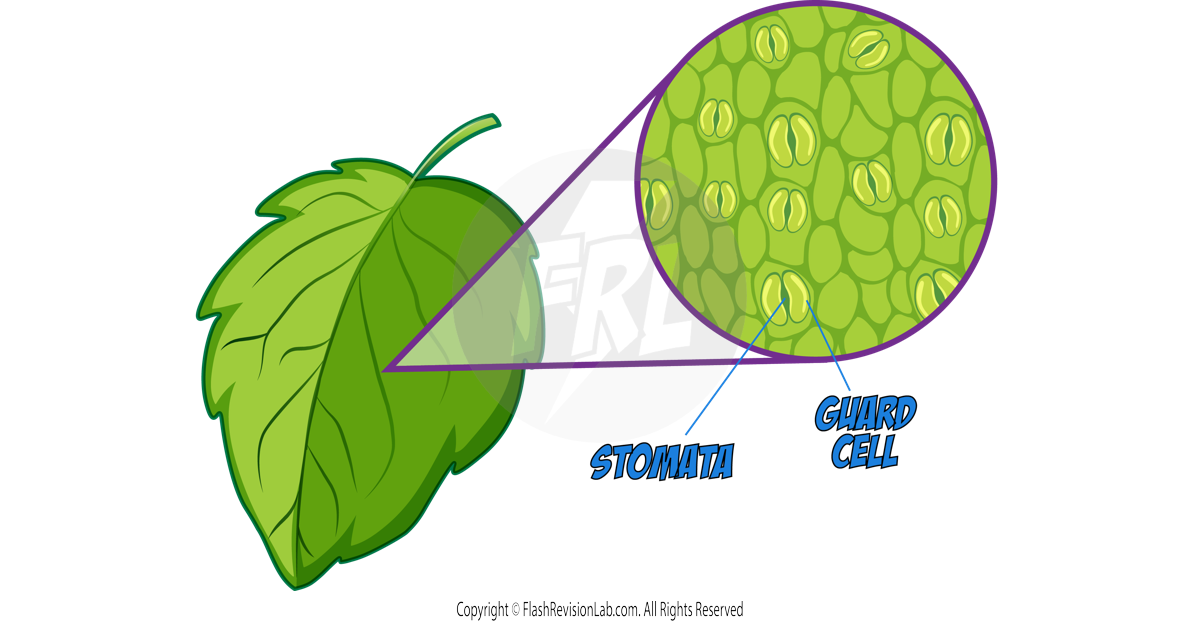
Stomata are small openings on the underside of leaves, regulated by GUARD CELLS:
- In the day time when light intensity is HIGH, the guard cells become TURGID (full of water) and they OPEN the stomata. This is because more PHOTOSYNTHESIS occurs in the daytime which means more CARBON DIOXIDE needs to be taken in. This also results in the release of more WATER and OXYGEN.
- In the night time, the light intesity is LOW and the guard cells become FLACCID (less water). This means the stomata CLOSE as less PHOTOSYNTHESIS occurs. This prevents the loss of excess WATER.
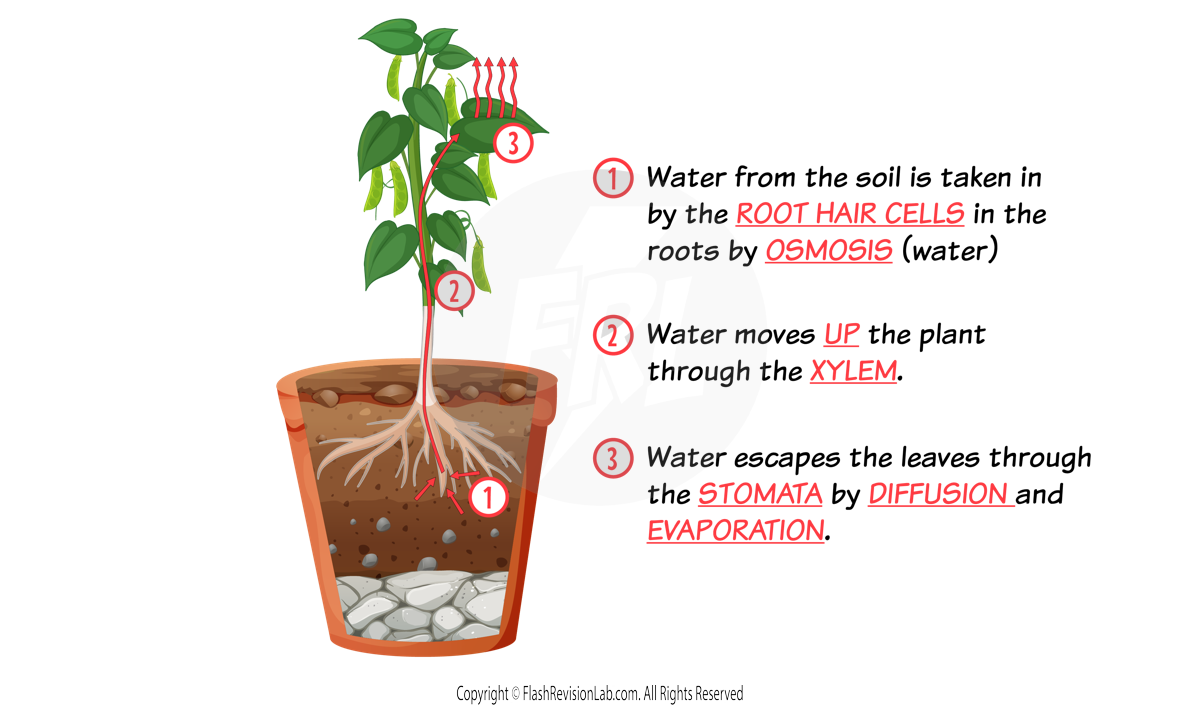
Transpiration
- TRANSPIRATION is caused by the EVAPORATION and DIFFUSION of water from the plant's surface, primarily the leaves.
- Most of the transpiration in a plant occurs through the STOMATA; small PORES found on the bottom of leaves.
- This process helps draw water up from the roots through the xylem and is a key part of the plant's WATER MANAGEMENT and NUTRIENT DISTRIBUTION
Transpiration rate, the movement of water within plants, is influenced by FOUR different factors:
1. LIGHT INTENSITY:
More light INCREASES transpiration. This is because the STOMATA OPEN UP in bright conditions to allow more gas exchange for photosynthesis.
2.TEMPERATURE:
Higher temperatures INCREASE transpiration because they increase the energy of the water molecules, and makes them move FASTER. This means the rate of DIFFUSION and EVAPORATION of the water molecules out of the stomata increases.
3. AIR FLOW:
Good air circulation around a leaf INCREASES transpiration. This is because the air removes water vapour from the surface of the leaf and keeps the concentration of water outside lower than the inside. This increase in CONCENTRATION GRADIENT makes DIFFUSION faster.
4. HUMIDITY:
Higher humidity levels outside the leaf DECREASES transpiration. This is because it means there is a high water concentration OUTSIDE the leaf, which results in a LOW CONCENTRATION GRADIENT which results in slower DIFFUSION.
Measuring the Rate of Transpiration
Setting Up the Experiment
- Use a POTOMETER to measure water uptake.
- Fill the potometer with water, ensuring no air bubbles are in the tube when inserting the plant.
- Mark the STARTING POSITION of an air bubble in the capillary tube.
- Begin the experiment by starting a stopwatch to measure time.
- Note the DISTANCE MOVED by the air bubble over a set period, such as an hour, to calculate the rate of water uptake.
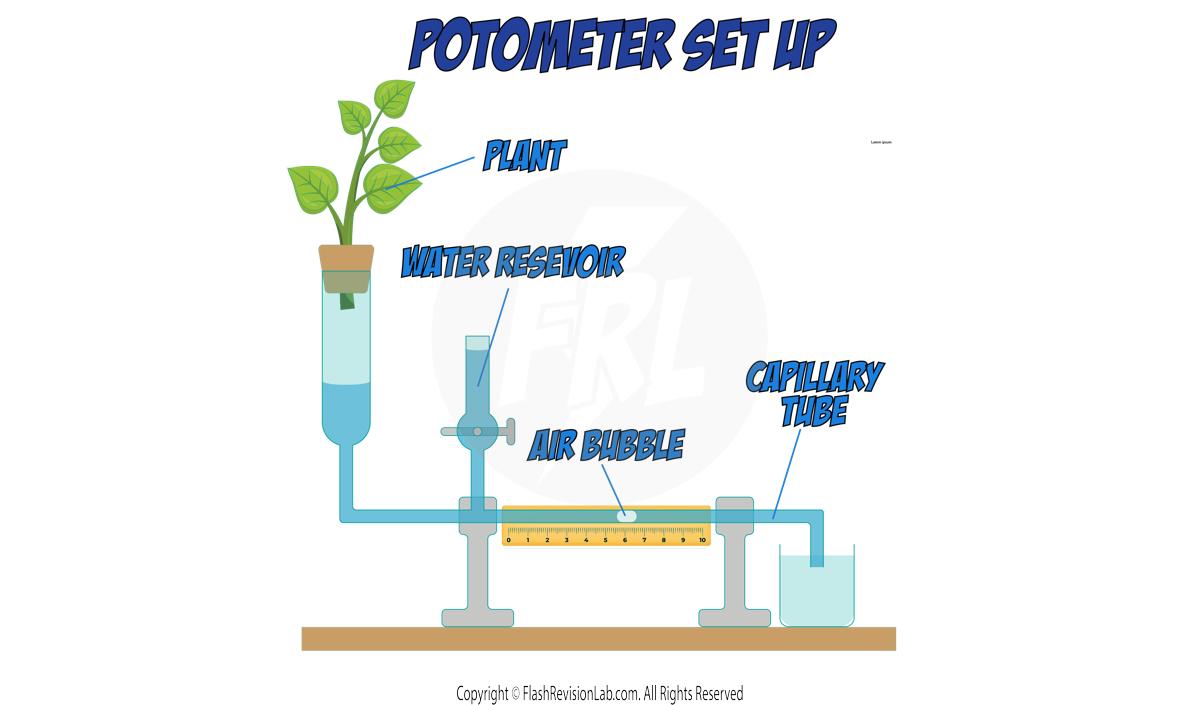
You can estimate the rate of transpiration by measuring the how much water is taken up by a plant. This is because you can assume that water uptake by the plant is directly related to water loss by the leaves.
Reading the Results
The GREATER the distance that the air bubble moves in a period of time, the FASTER the rate of transpiration. Record this distance at regular intervals to calculate the rate.
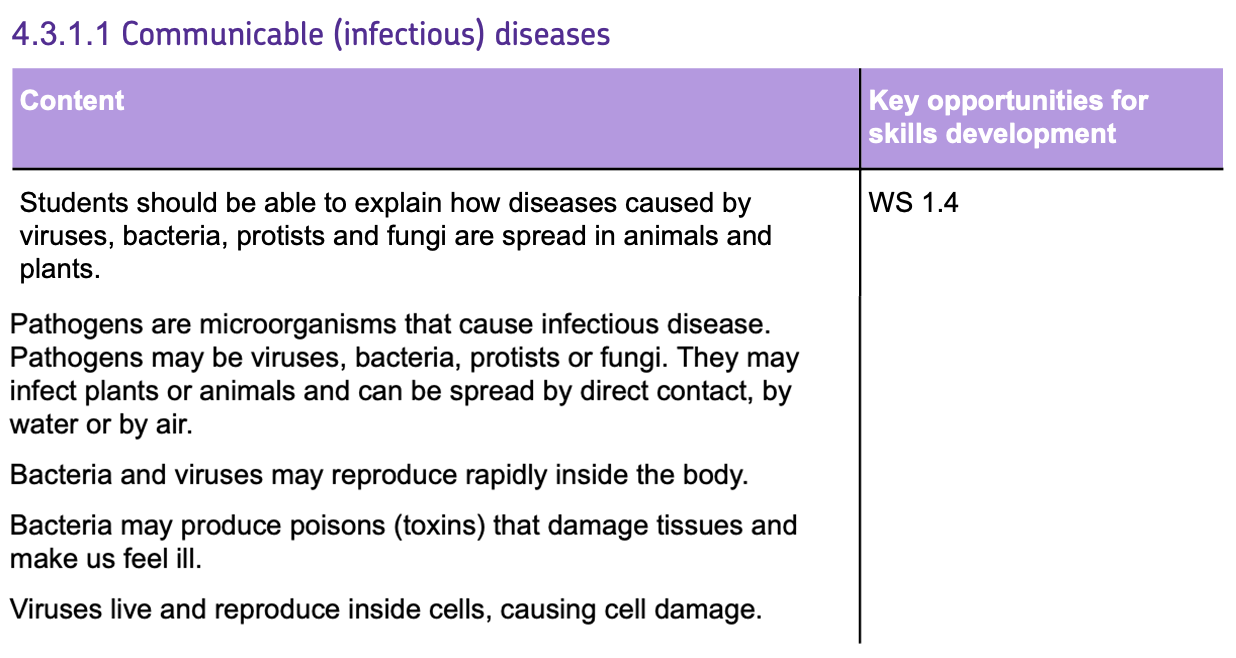
Types of Pathogens
Communicable diseases are diseases that can SPREAD between organisms
They are caused by PATHOGENS, which are microorganisms that can invade and harm the body.
There are FOUR types of pathogens:
1. BACTERIA:
- These are very small living cells that can reproduce rapidly inside your body.
- They can cause illness by producing poisins called TOXINS.
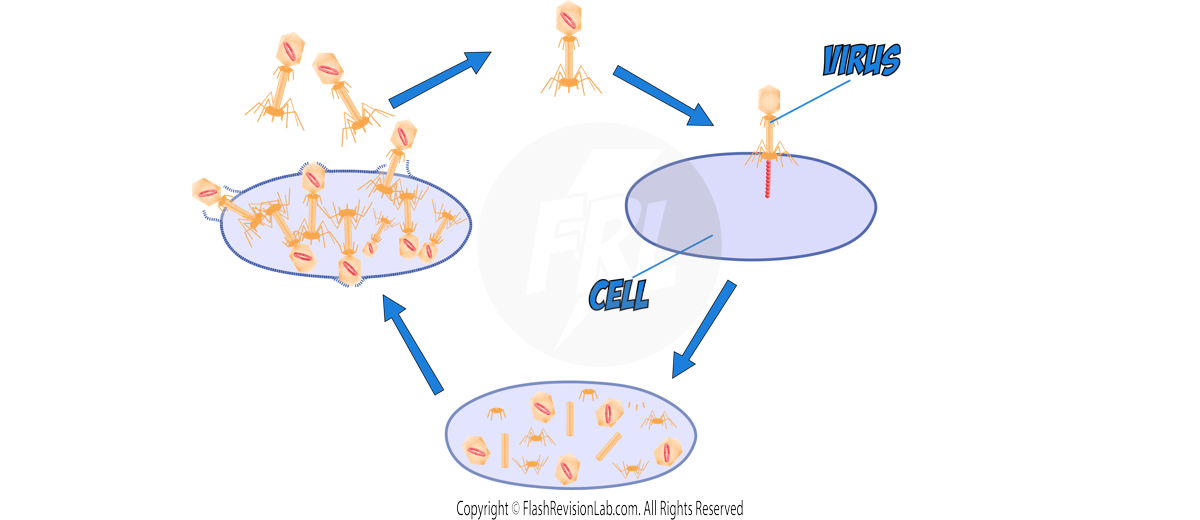
2. VIRUSES:
- Much smaller than bacteria, viruses are NOT cells.
- They invade and reproduce INSIDE body cells. Once the cell is full of viruses, it BURSTS and releases them to attack other cells
- The damage to your cells during this process can make you feel unwell.
3. PROTISTS:
- These SINGLE-CELLED EUKARYOTES can live as PARASITES, which means they may live on or inside other organisms and can cause harm.
- They are often transferred to the host by a VECTOR, like a mosquito, which itself does not get the disease.
4.FUNGI:
- These organisms can be single-celled or multi-celled
- Multi-celled fungi have a body made of HYPHAE; Structures that can cause infections by penetrating human skin or plant surfaces.
- Hyphae can produce SPORES which aid in their spread to other plants and animals.
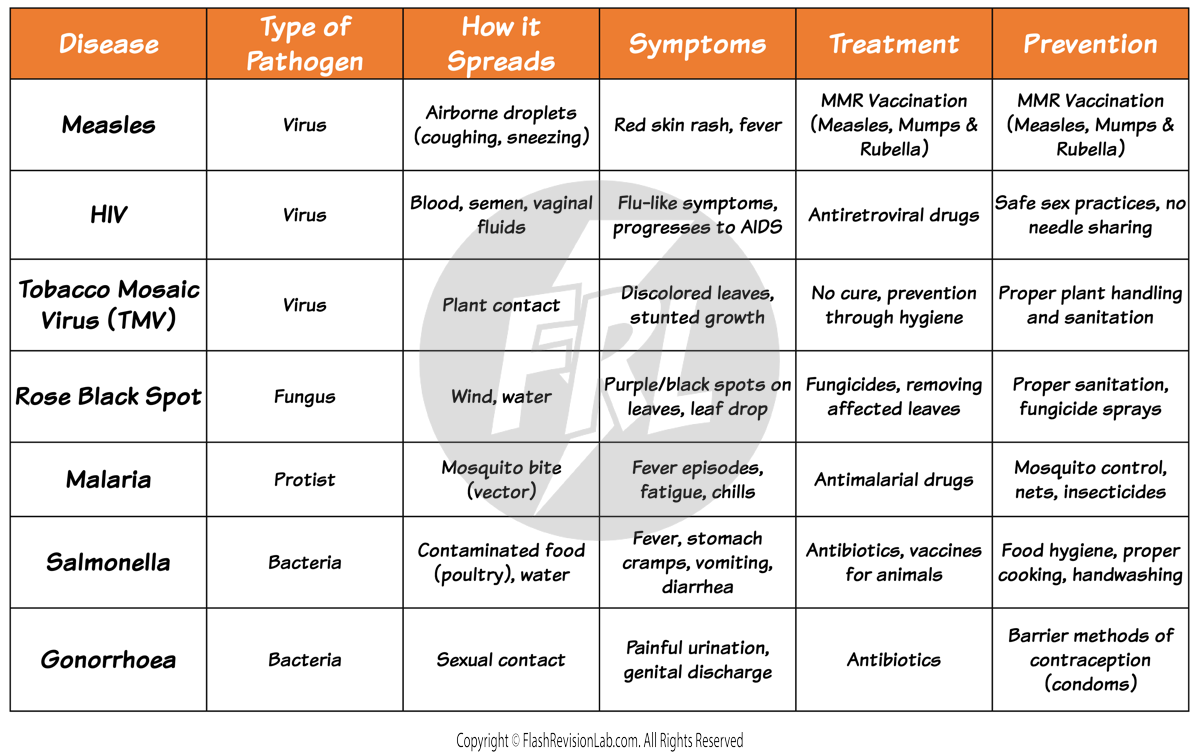
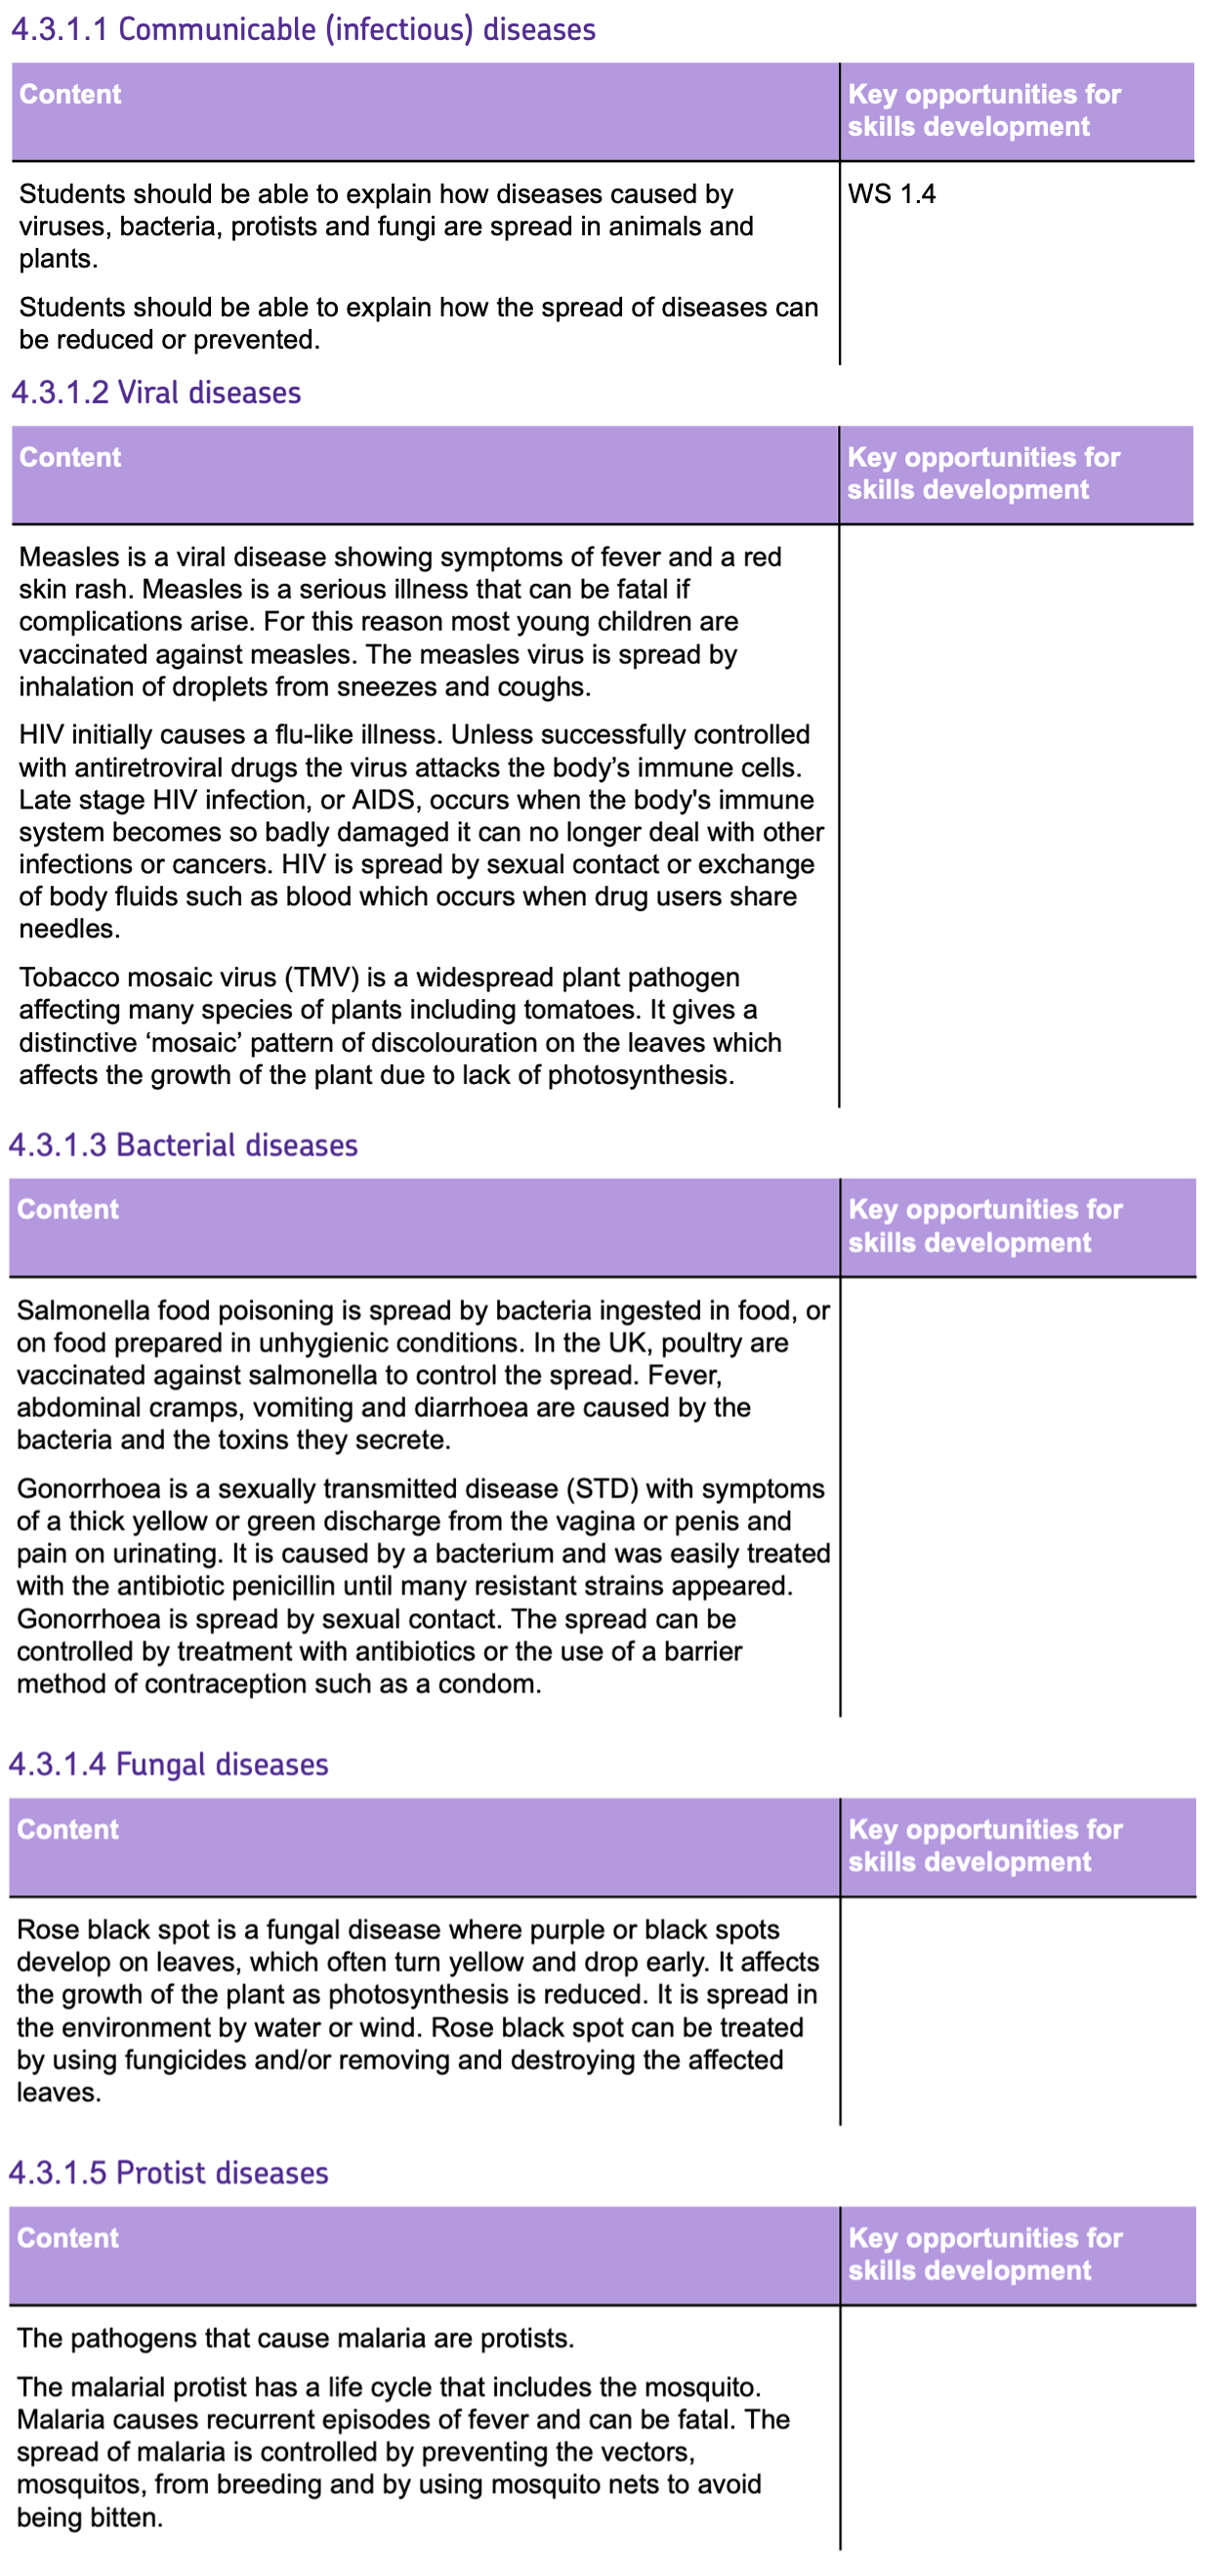
Types of Communicable Diseases
Examples of Communicable Diseases
How Pathogens Spread
1. WATER:
- Drinking or bathing in CONTAMINATED water can lead to diseases like cholera.
2. AIR:
- Airborne pathogens are spread through droplets when someone with an infection COUGHS or SNEEZES.
3. DIRECT CONTACT:
- TOUCHING contaminated surfaces or skin-to-skin contact can transmit diseases such as athlete's foot.
Reducing or Preventing the Spread of Disease:
1. HYGIENE:
- WASHING hands and maintaining cleanliness.
2. DESTROYING VECTORS:
- Eliminating disease-carrying organisms (like insects) by using INSECTICIDES or destroying their HABITAT.
3. ISOLATING INFECTED INDIVIDUALS:
- Keep people with the disease AWAY from the general public to prevent them from spreading to others.
4. VACCINATION:
- Reduces the likelihood of DEVELOPING and PASSING ON the infection.
Human Defence Systems
Communicable Diseases are spread by PATHOGENS (microorganisms that cause disease). The body has several DEFENCES to prevent pathogens from entering the body and infecting a person.
The Body's DEFENCE SYSTEM
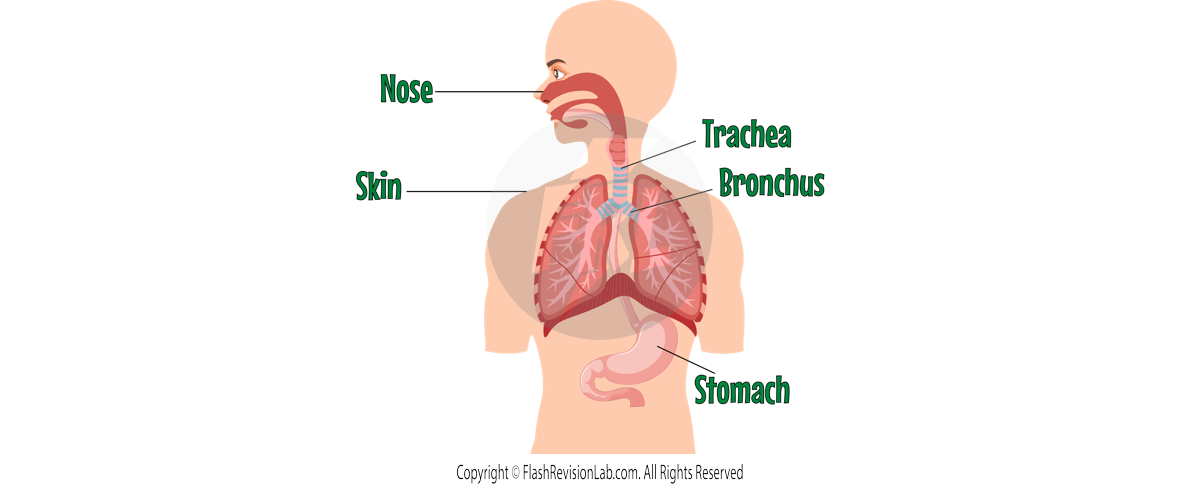
1. The SKIN
- Provides a protective BARRIER against pathogens.
- Produces ANTIMICROBIAL SUBSTANCES to actively kill potential threats.
2. The NOSE
- HAIRS and MUCUS in the nose serve as physical traps for dust, microbes, and other particles.
- Helps prevent the entry of pathogens into the respiratory system.
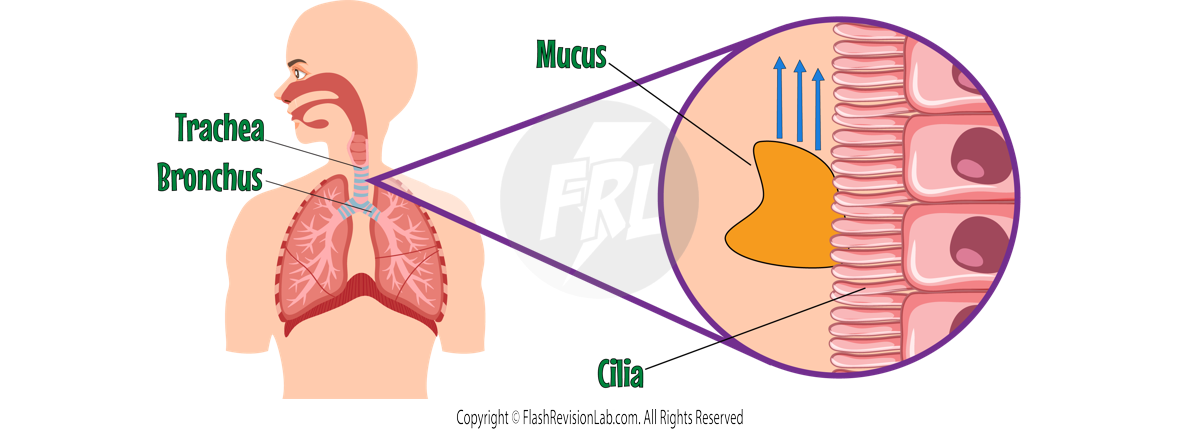
3. The TRACHEA and BRONCHI (Air Passages)
- Secrete MUCUS to capture and trap pathogens.
- Lined with CILIA, tiny hair-like structures that move mucus loaded with trapped pathogens OUT OF the respiratory system to the back of the throat. From there it is swallowed and goes into the STOMACH.
4.The STOMACH:
- Produces HYDROCHLORIC ACID, a strong acid that destroys pathogens ingested through food or drink.
If these defences fail and the pathogens enters the blood stream of a person, they are said to be INFECTED. From this stage the IMMUNE SYSTEM kicks in to try and kill the pathogens.
The IMMUNE SYSTEM
The immune system is mainly made up of WHITE BLOOD CELLS which can fight pathogens in THREE different ways:
1. PHAGOCYTOSIS:
- A process where WHITE BLOOD CELLS (phagocytes) ENGULF and DIGEST invading pathogens.
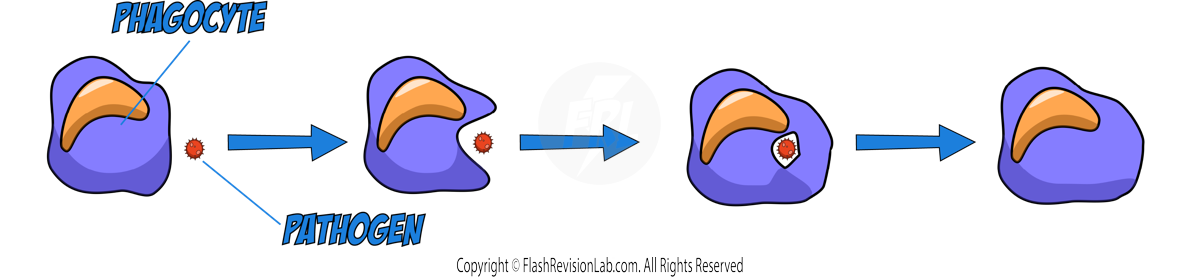
- The phagocytes goes up to a pathogen and changes its shape to SURROUND the pathogen. It then releases ENZYMES to digest it.
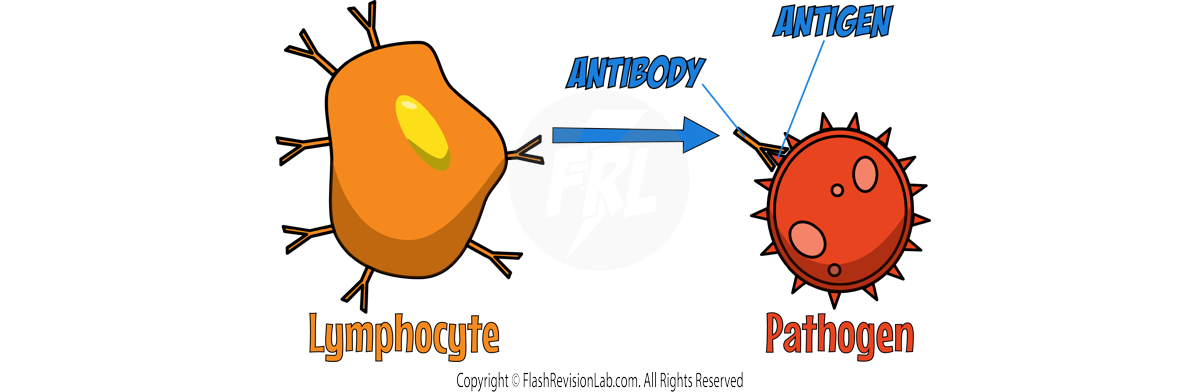
2. ANTIBODY PRODUCTION:
- Pathogens have unique markers on their surface called ANTIGENS, which white blood cells known as LYMPHOCYTES can identify.
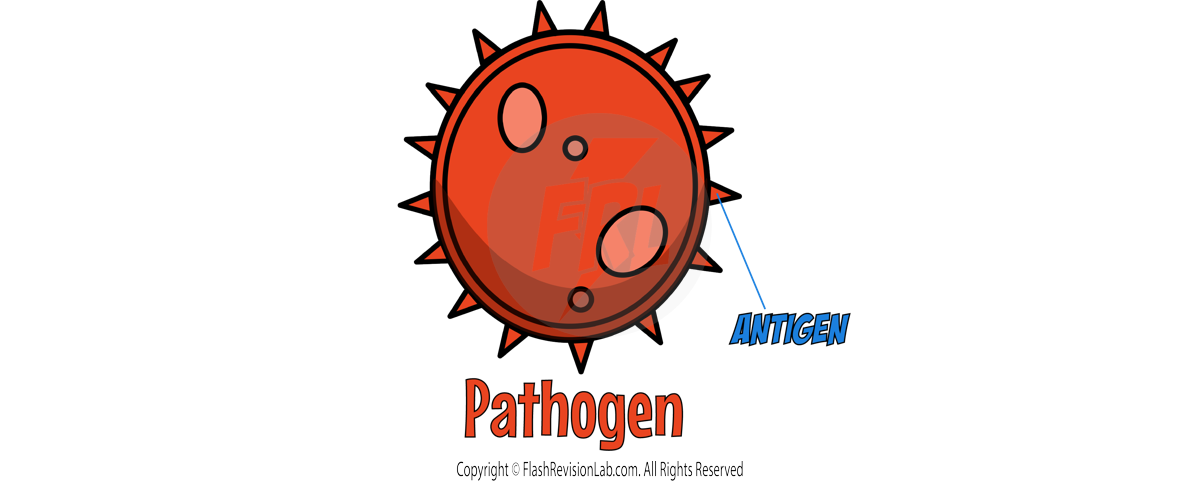
- The lymphocytes produce ANTIBODIES; special proteins with specific shapes to bind to the antigens of a pathogen and marks them for destruction.
- When a pathogen is marked, it makes it easier for PHAGOCYTES to find them and engulf them.
- Once all of the pathogens of a disease have been killed, most of the lymphocytes that produced the antibodies to kill them die off as they are no longer needed. However a few lymphocytes still remain in the body, just in case the pathogen REAPPEARS.
- The lymphocytes that remain are known as MEMORY CELLS and these produce MORE antibodies RAPIDLY so that the pathogens die off quickly before the symptoms of the disease have even appeared.
- If this occurs, we say that the person is IMMUNE to the disease and pathogen.
3. ANTITOXIN PRODUCTION:
- These help with BACTERIAL infections
- Bacteria produce poisons known as TOXINS which cause harm to body cells
- ANTITOXINS are substances that neutralise the toxins released by invading bacteria.
Vaccination
VACCINATION is a proactive approach to prevent diseases rather than treating them after infection.
How VACCINATIONS Work:
- VACCINATIONS work by introducing DEAD or INACTIVE pathogens into the body.
- These pathogens carry ANTIGENS which prompt the LYMPHOCYTES (white blood cells) to produce ANTIBODIES without the actual disease occurring.
- The lymphocytes stay in the body as MEMORY CELLS, so if the actual pathogen was to ever enter the body, they would RAPIDLY produce a LARGE VOLUME of antibodies to eradicate the pathogens and prevent illness.
- The MMR VACCINE is an example that combines weakened versions of the viruses causing measles, mumps, and rubella.
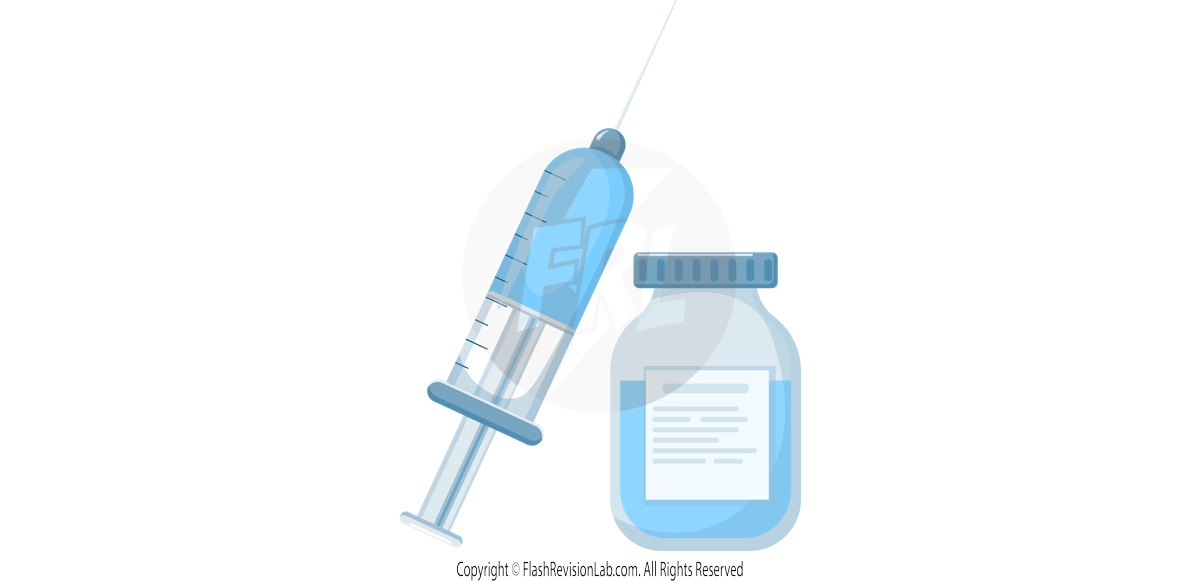
There are advantages and disadvantages to vaccinations:
Antibiotics and Painkillers
When we fall ill, it's not just about dealing with the symptoms; it's also about addressing the root cause of our discomfort. MEDICINES play a vital role in this process, with different types being used for various purposes.
PAINKILLERS:
- PAINKILLERS are drugs that manage symptoms such as PAIN and FEVER. They offer relief but DO NOT target the underlying cause of the disease.
- Examples include ASPIRIN and PARACETAMOL
ANTIBIOTICS
- ANTIBIOTICS work on a deeper level by either KILLING BACTERIA or preventing their REPRODUCTION. This stops the infection at its source.
The Science Behind ANTIBIOTICS:
- They only target BACTERIAL infections by killing bacteria cells.
- They are ineffective against viruses because viruses reproduce INSIDE body cells, so it is difficult to destroy the virus without destroying the healthy cell.
- ANTIBIOTICS recognise bacteria by the unique ANTIGENS on their surface and disrupt their life processes.
- The correct antibiotic must be matched with the right bacterial infection to be effective as they are SPECIFIC to certain bacteria.
The Issue of RESISTANCE:
- Bacteria can EVOLVE, leading to ANTIBIOTIC RESISTANCE.
- This makes some antibiotics LESS EFFECTIVE or even useless against these resistant bacteria.
- If these resistant bacteria reproduce and spread, it can become difficult to treat and can lead to a SERIOUS INFECTION.
- An example of this is MRSA which was a bacteria which EVOLVED to become resistant to the antibiotic METICILLIN.
- To combat this, medical professionals recommend completing the FULL COURSE of antibiotics even if the patient is feeling better, and only using them when symptoms are SERIOUS (eg. Not for small coughs).
The Origin and Evolution of DRUGS:
- Many of today's medicines have their roots in natural remedies.
- ASPIRIN: derived from WILLOW BARK, is used as a PAINKILLER and to LOWER FEVER.
- PENICILLIN: comes from MOULD, and is used as an ANTIBIOTIC.
- DIGITALIS: Comes from FOXGLOVES, is used to treat HEART CONDITIONS.
Discovery and Development of Drugs
Discovery of Drugs:
Many of today's medicines have their roots in natural remedies.
- ASPIRIN: derived from WILLOW BARK, is used as a PAINKILLER and to LOWER FEVER.
- PENICILLIN: comes from MOULD, and is used as an ANTIBIOTIC.
- DIGITALIS: Comes from FOXGLOVES, is used to treat HEART CONDITIONS.
Development of Drugs
The journey from the lab to the pharmacy shelf is a rigorous one for every new drug. Understanding this process is crucial for anyone interested in how medicines are safely brought to the market.
PRECLINICAL TRIALS (Cells, Tissues and Animals)
Stage 1:
- Drugs first undergo tests on HUMAN CELLS and TISSUES in the laboratory.
- Tests on whole or multiple body systems require the use of whole ANIMALS due to their complex circulatory systems.
Stage 2:
- The drug is tested on ANIMALS.
- The drug is tested for EFFICACY (how well it works), TOXICITY (potential harm) and DOSAGE (the concentration and how often the drug needs to be taken) using LIVE ANIMALS.
- In Britain, law requires testing on two different LIVE MAMMALS to ensure the drug's safety.
CLINICAL TRIALS (Humans)
Stage 3:
HEALTHY VOLUNTEERS are first to receive the drug to check for SIDE EFFECTS at low doses.
The dose is gradually INCREASED and tested until an OPTIMUM DOSE is found.
Stage 4:
Next, the drug is administered to PATIENTS in two groups:
- One group receives the NEW DRUG.
- The other group gets a PLACEBO (a substance that looks like a drug but doesn't do anything).
Trials are BLIND so the patient DOESN'T KNOW whether they are taking the real drug or the placebo. This prevents the PLACEBO EFFECT where the patient expects the drug is working so is subconsciously influenced.
Some trials are DOUBLE BLIND which means neither the patient nor the monitoring doctors know who received the actual drug or the placebo. This stops the doctors from being subconsciously influenced when analysing the results.
Finally PEER REVIEW of the results is conducted by other scientists to ensure the VALIDITY and RELIABILITY of the trial outcomes before publication.
Photosynthesis
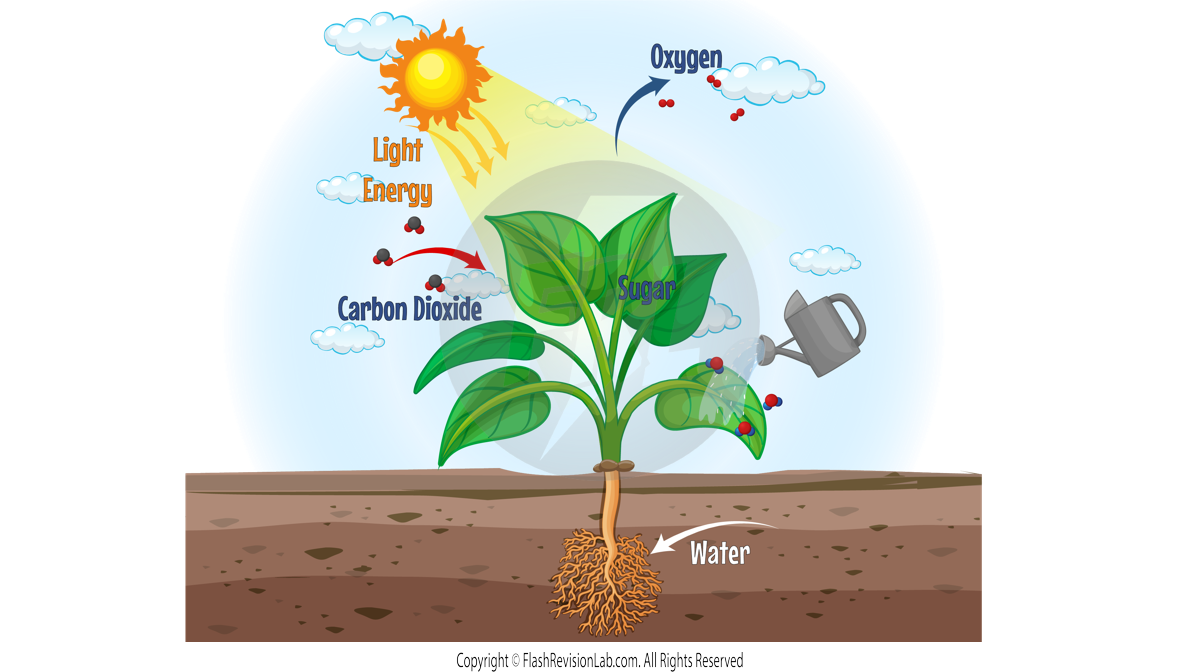
- PHOTOSYNTHESIS is the process where plants convert CARBON DIOXIDE and WATER into GLUCOSE and OXYGEN using LIGHT ENERGY.
- It occurs in CHLOROPLASTS within plant cells, which contain the pigment CHLOROPHYLL that absorbs light.
- PHOTOSYNTHESIS is an ENDOTHERMIC reaction, meaning it absorbs energy from the environment.
Equation:
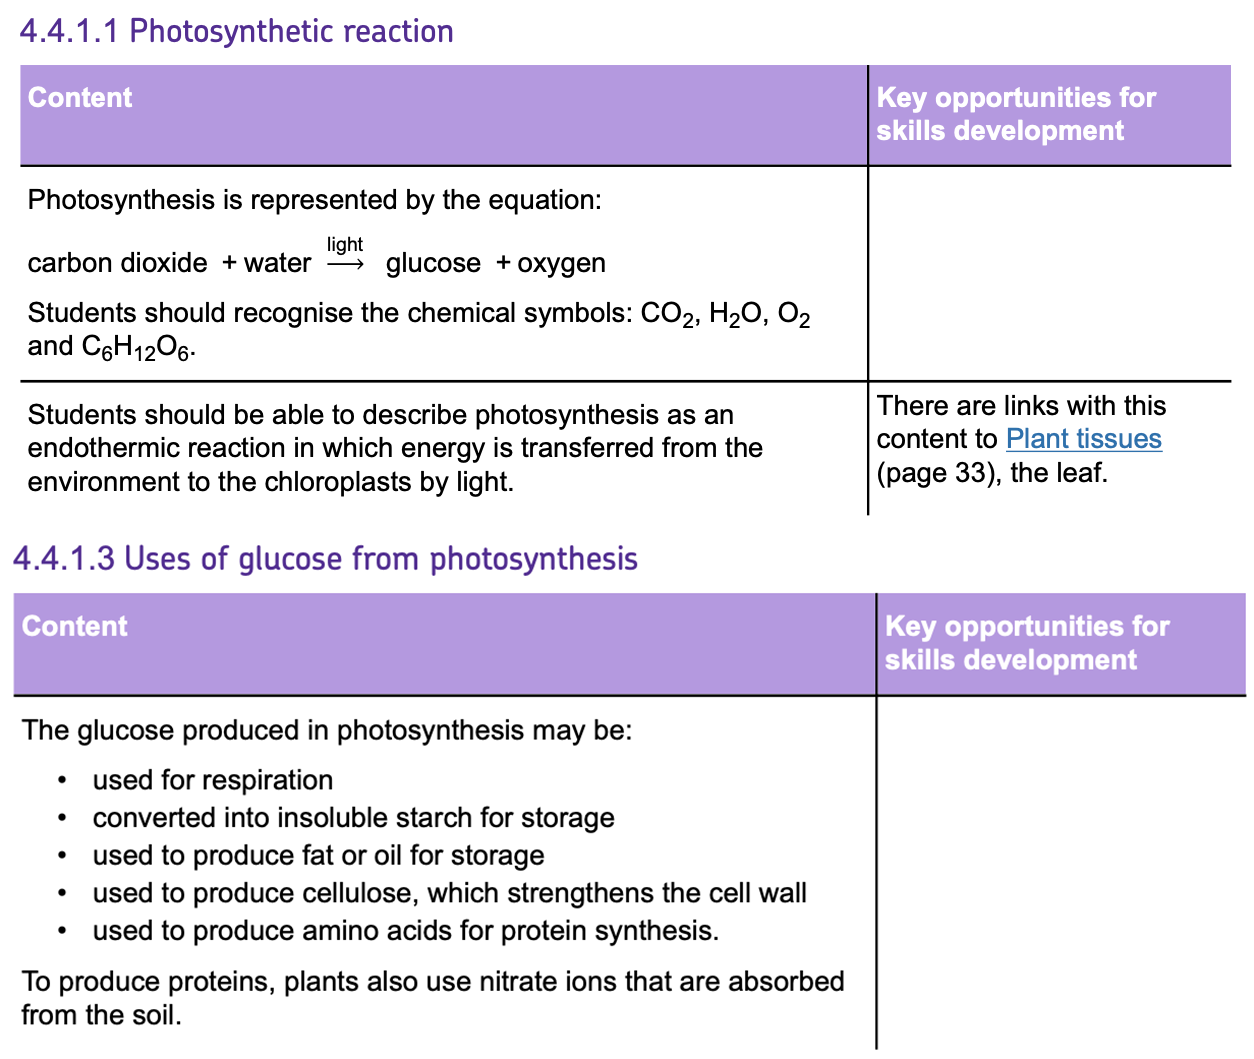
- Word equation: CARBON DIOXIDE + WATER → GLUCOSE + OXYGEN
- Symbol equation: 6CO₂ + 6H₂O (light) → C₆H₁₂O₆ + 6O₂
How Plants Use GLUCOSE:
1. RESPIRATION
Glucose is used to TRANSFER ENERGY by respiration for the plant's FUNCTIONS and to create other substances.
2. CELLULOSE:
Glucose is transformed into CELLULOSE, which is crucial for making PLANT CELL WALLS to SUPPORT cells' structures.
3. AMINO ACIDS:
Glucose is combined with NITRATE IONS from the soil to make amino acids, which are then assembled into PROTEINS for GROWTH and REPAIR.
4. LIPIDS:
Glucose is turned into fats and oils for storage in SEEDS.
5. STARCH:
Glucose is stored as starch in roots, stems, and leaves for use when photosynthesis is not active, like during winter. Starch is a good storage form because it is INSOLUBLE, preventing the cell from swelling with water.
The Rate of Photosynthesis
The RATE OF PHOTOSYNTHESIS can be influenced by three primary factors:
1. LIGHT INTENSITY
2. CARBON DIOXIDE (CO₂) CONCENTRATION
3. TEMPERATURE
Limiting Factors
- At any moment, one of these factors may act as the LIMITING FACTOR, determining the maximum rate of photosynthesis.
- The limiting factor is any factor that STOPS photosynthesis from happening FASTER.
- Here are three examples of limiting factors:
1. On a WARM NIGHT, the limiting factor is LIGHT INTESITY:
Both temperature and CO₂ concentration are high enough but the light intensity needs to be increased to make photosynthesis faster.
2. On a COLD DAY at MIDDAY, the limiting factor is TEMPERATURE:
Both light intensity and CO₂ concentration are high enough but the temperature needs to be increased to make photosynthesis faster.
3. On a WARM DAY at MIDDAY, the limiting factor is CO₂ CONCENTRATION:
Both temperature and light intensity are high enough but the CO₂ concentration needs to be increased to make photosynthesis faster.
Graphs for the Rate of Photosynthesis
When studying photosynthesis, graphs are a crucial tool for visualising how different factors can limit the rate at which plants produce glucose and oxygen.
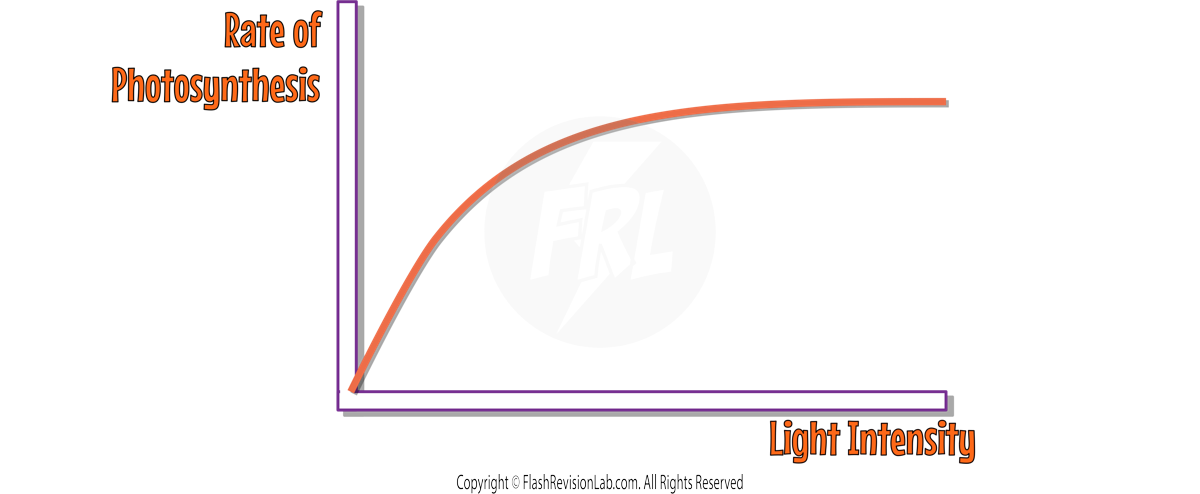
LIGHT INTENSITY Graph:
- This can be represented by a graph that rises steeply before plateauing, forming a curve that eventually flattens out.
- Initially, as light intensity increases, the rate of photosynthesis increases proportionally.
- Beyond a certain point of light intensity, the rate no longer increases, indicating another factor such as CO₂ CONCENTRATION or TEMPERATURE is the LIMITING FACTOR.
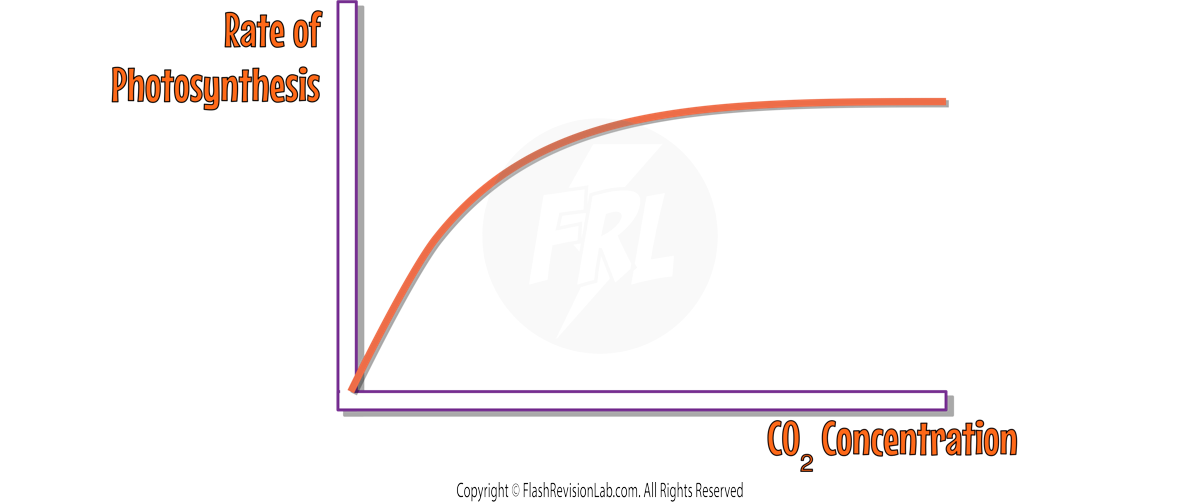
CARBON DIOXIDE CONCENTRATION Graph:
- A graph plotting the rate of photosynthesis against CO₂ concentration also shows a similar initial steep increase.
- As with light intensity, there's a level of CO₂ concentration at which an increase does not further increase the rate of photosynthesis. At this point, either LIGHT INTENSITY OR TEMPERATURE are acting as the LIMITING FACTOR.
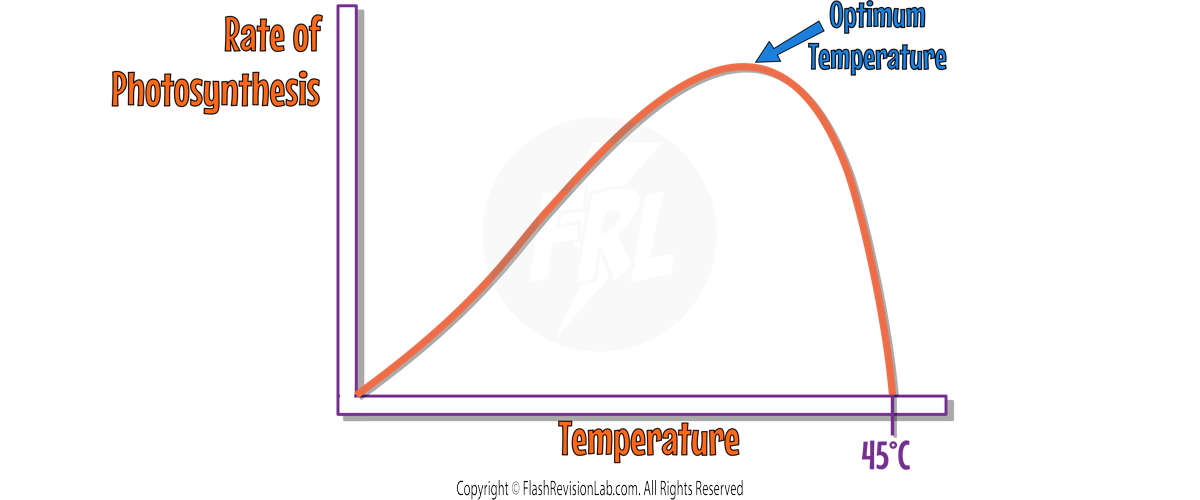
TEMPERATURE Graph:
- The rate of photosynthesis increases with temperature due to more COLLISIONS between enzymes and substrates, but this only happens up to a point known as the OPTIMUM TEMPERATURE.
- Beyond this optimal temperature, the rate rapidly declines as enzymes are sensitive to heat and can be DENATURED at high temperatures.
- This graph would typically rise, peak, and then sharply drop off as the temperature moves beyond the enzymes' tolerable range.
FARMING Practices and Controlled Conditions:
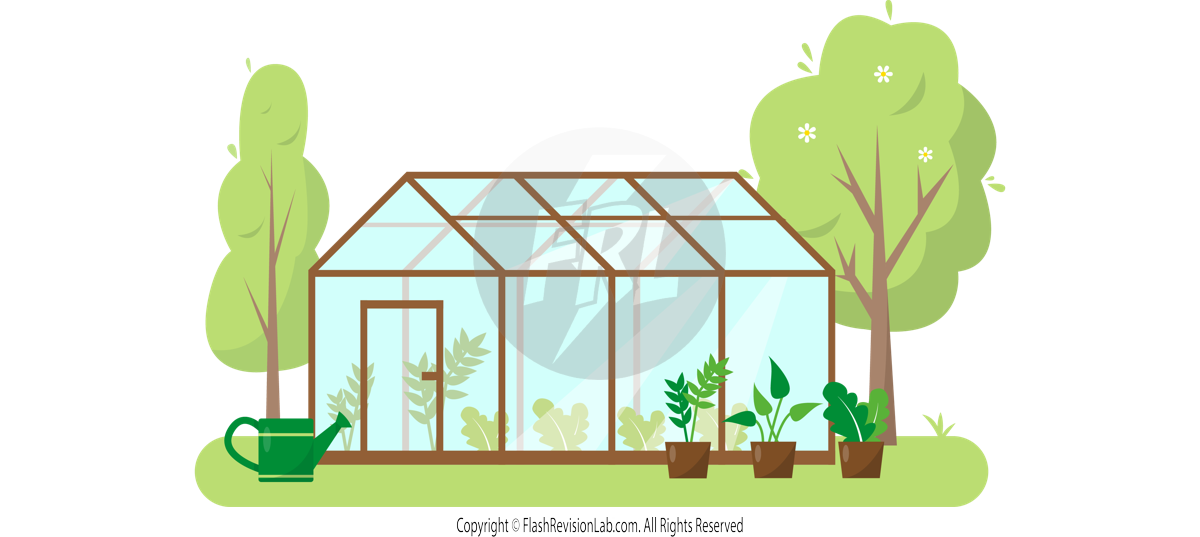
- In agriculture, creating optimal conditions for plant growth is vital. GREENHOUSES are used to manipulate environmental factors affecting photosynthesis.
- Greenhouses trap the Sun's HEAT, ensuring temperatures remain within the optimal range for photosynthetic enzymes to function effectively. They also allow for the control of CO₂ levels and light intensity.
- Farmers may use supplemental ARTIFICIAL LIGHT to extend the hours of light, especially during shorter days, and provide consistent light intensity, directly influencing the rate of photosynthesis.
- By monitoring and adjusting heat and light, farmers can prevent temperature and light intensity from becoming limiting factors in plant growth.
- Additional methods include using HEATERS, and VENTILATION to manage temperature, and using fertilizers to supply necessary nutrients, further optimizing the conditions for photosynthesis.
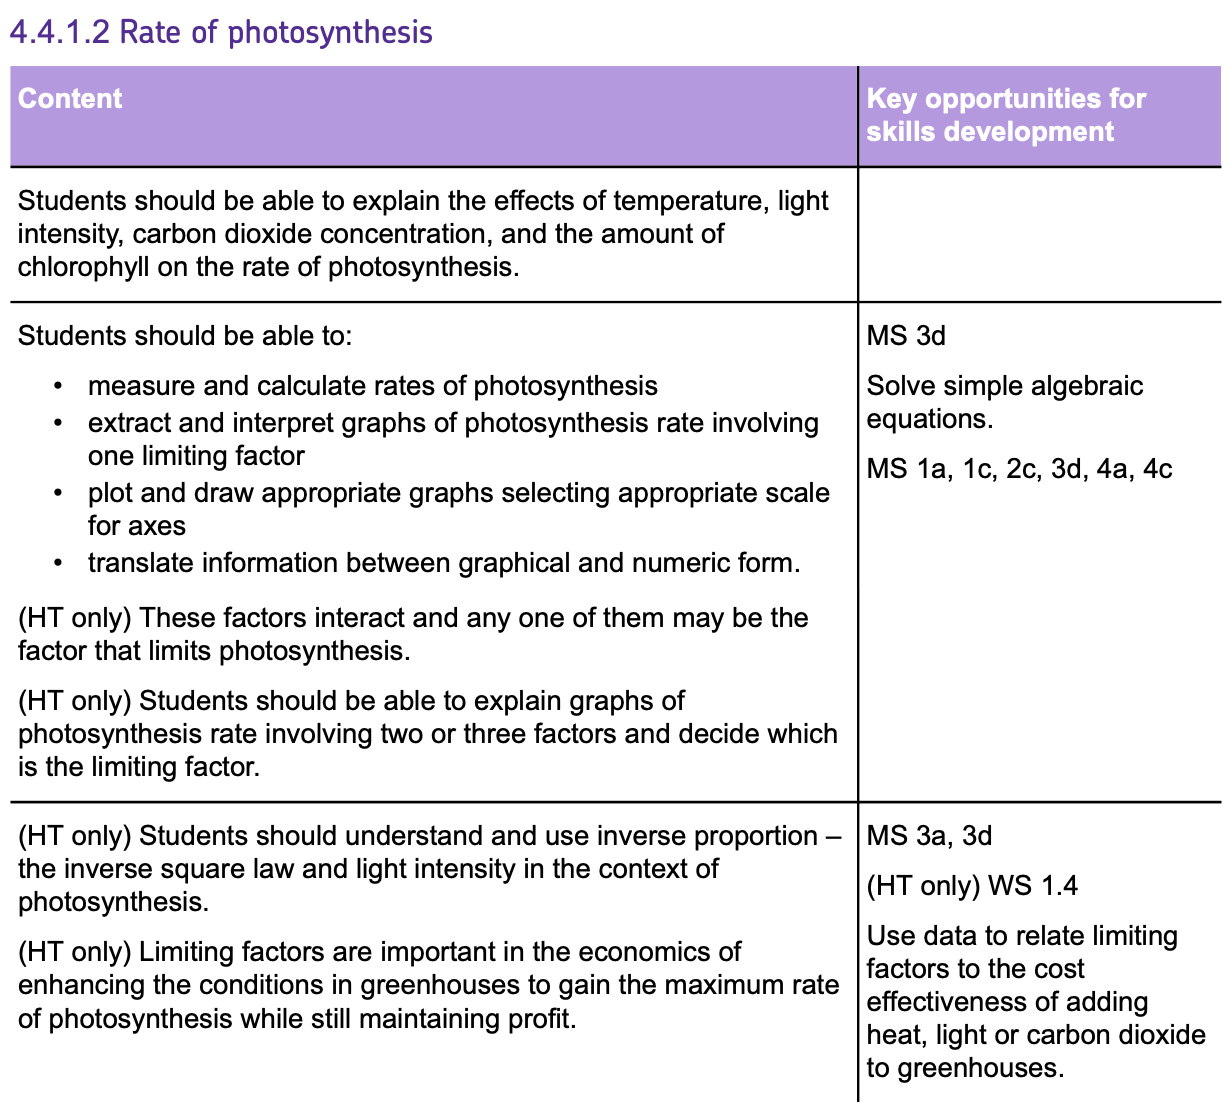
Economic Considerations in Farming:
- While creating these ideal conditions is EXPENSIVE, the INCREASE in plant GROWTH and YIELD can lead to MORE PROFIT which offsets these expenses.
- It is crucial that farmers balance the cost of creating these conditions with the benefits gained in crop yield and quality to ensure they don't lose out on money.
Required Practical: Photosynthesis
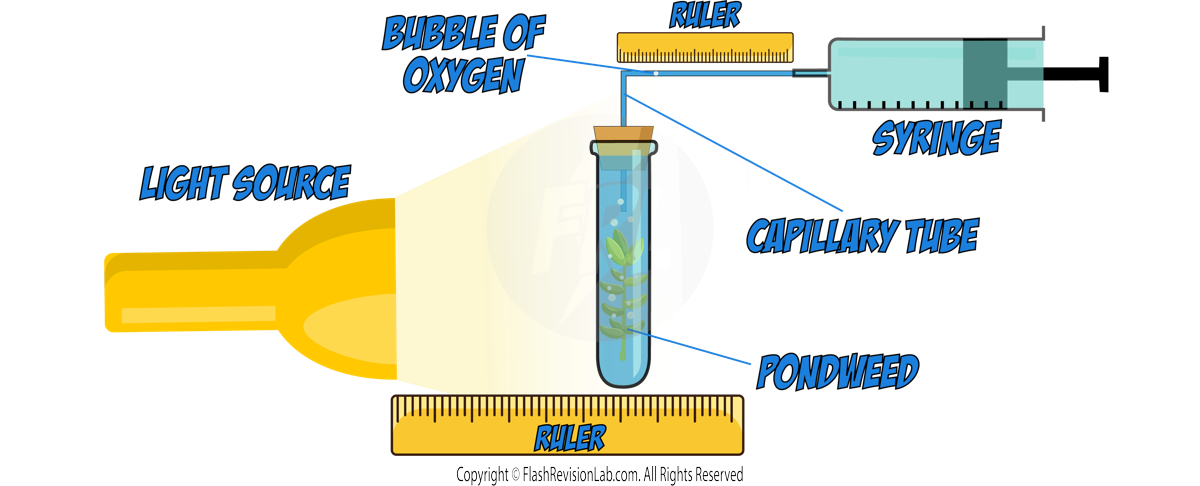
OXYGEN PRODUCTION by plants during photosynthesis can be measured to determine the RATE of photosynthesis.
- CANADIAN PONDWEED can be used in a lab setup where it is exposed to a source of LIGHT at a fixed distance to photosynthesise and produce oxygen.
- The oxygen accumulates in a CAPILLARY TUBE, and the length of the oxygen bubble is measured with a RULER to estimate the volume of oxygen produced.
Steps for the Practical Experiment:
- Set the light source at a SPECIFIC DISTANCE from the pondweed.
- Allow the pondweed to photosynthesise for a set amount of time, collecting oxygen in the capillary tube.
- Use the SYRINGE to draw the oxygen bubble alongside the ruler.
- Measure the length oxygen bubble with the ruler to determine the volume of oxygen produced and hence the rate of photosynthesis.
- Ensure other variables like TEMPERATURE and the DURATION of exposure to light are CONTROLLED.
- Repeat the experiment several times and find a MEAN.
- Repeat the whole process again with the light source at different distances from the pondweed.
The INVERSE SQUARE LAW and Light Intensity:
- When considering the effect of light on photosynthesis, the INVERSE SQUARE LAW is a fundamental concept. It states that light intensity is INVERSELY PROPORTIONAL to the SQUARE of the distance from the light source.
- Mathematically, this is expressed as

This means if the distance from the light source to the plant DOUBLES, the light intensity at the plant's location is reduced to ONE-FOURTH (quarter).
You can work out LIGHT INTENSITY by using the inverse square law.
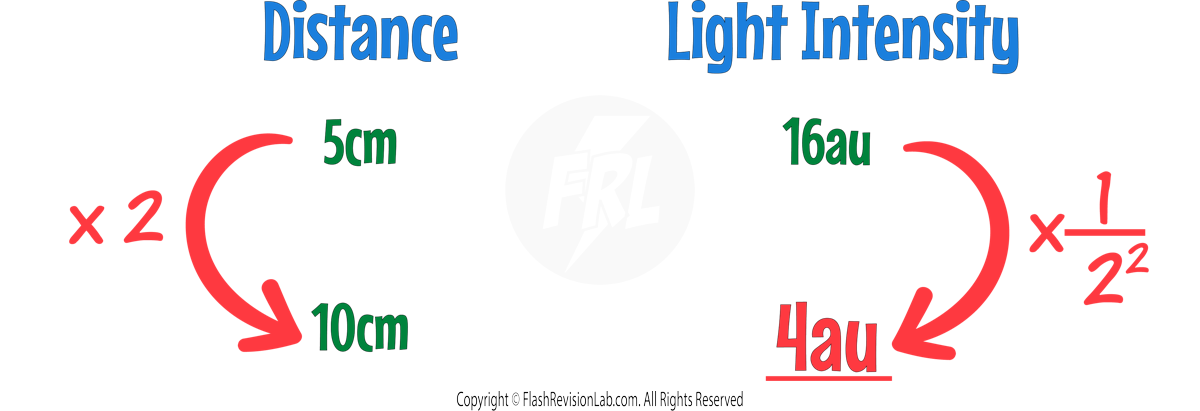
Example:
When you bring a lamp at 5 cm from the pondweed, it has a light intensity of 16au (arbitary units). Calculate the light intensity if the lamp is moved 10cm from the pondweed.
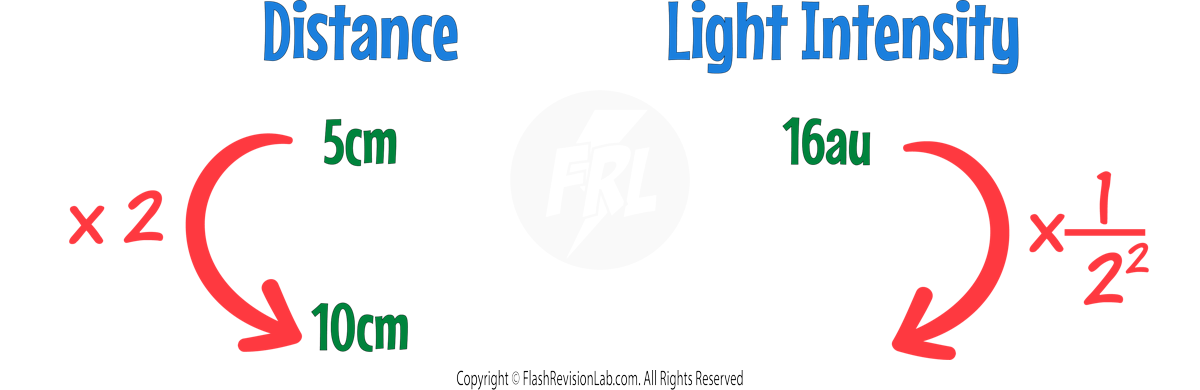
To go from 5cm to 10cm, you need to multiply the distance by 2. To find the light intensity at 10cm, you need to SQUARE the 2 to give you 4 and then do the INVERSE to give you a QUARTER. So you need to find a quarter of 16.
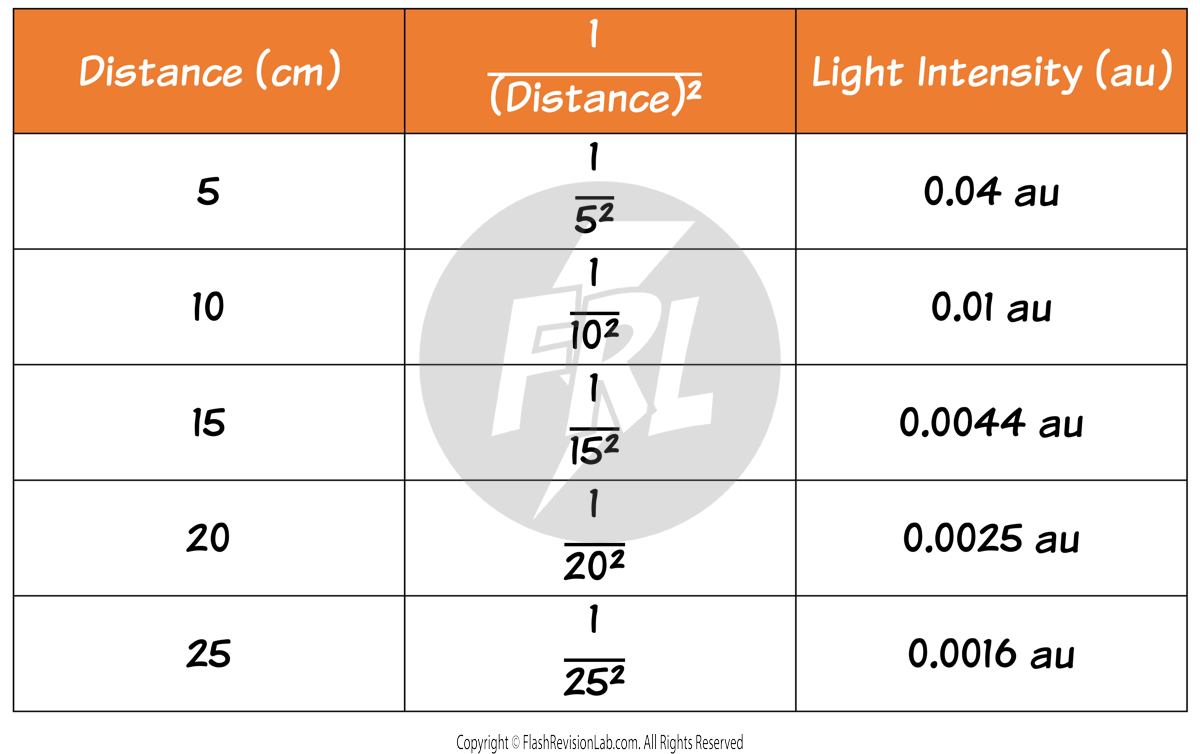
You can also use the inverse square law as an EQUATION to find out the light intensity at any distance:

Here are a few examples of light intensities at specific distances:

RESPIRATION
- RESPIRATION is a set of metabolic reactions that take place in the cells of organisms.
- Respiration is a chemical process that TRANSFERS ENERGY by breaking down GLUCOSE.
- Respiration is an EXOTHERMIC process, meaning it release energy to the surroundings, which can be observed as HEAT.
Uses of Respiration
The energy transferred from respiration supplies all the energy needed for living processes including:
- KEEPING WARM and maintaining a constant warm body temperature.
- Contracting muscles for MOVEMENT.
- Carrying out chemical reactions to build LARGER MOLECULES from smaller ones (eg. Turning amino acids into proteins)
Types of RESPIRATION
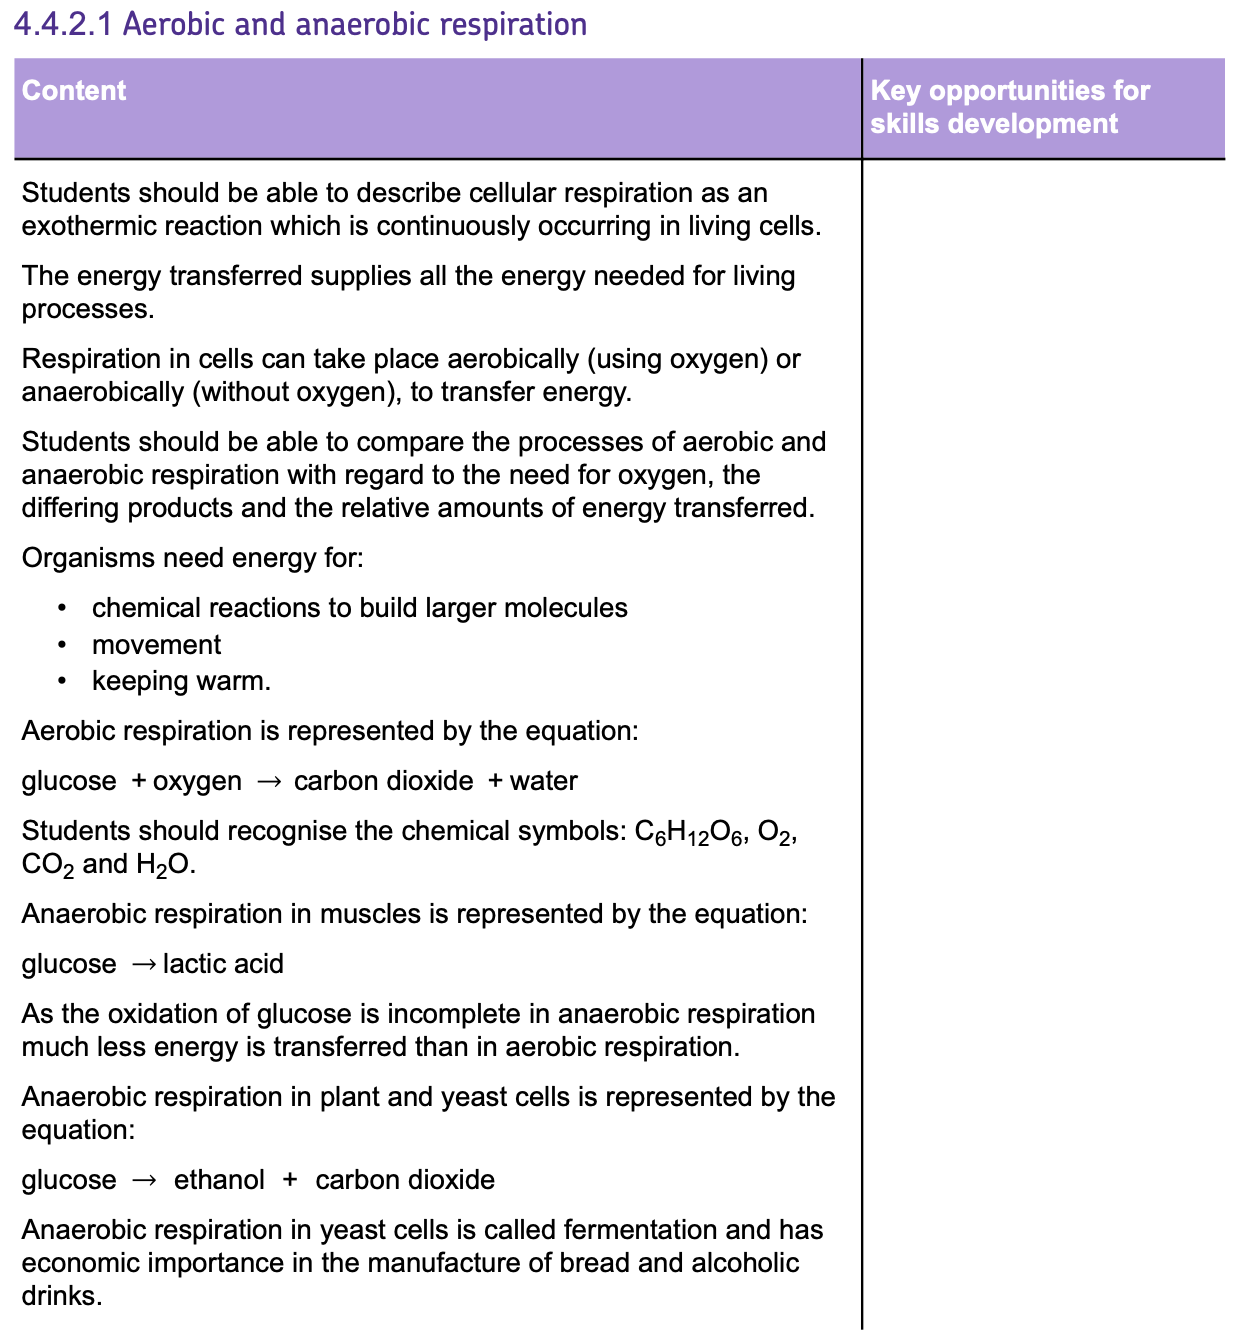
1. AEROBIC RESPIRATION:
- Occurs with OXYGEN and is the most EFFICIENT way to release energy from glucose.
- Takes place CONTINUOUSLY in animals and plants, within the MITOCHONDRIA.
The word and symbol equations for aerobic respiration are:
- Word Equation: Glucose + Oxygen → Carbon dioxide + Water
- Symbol Equation: C₆H₁₂O₆ + 6O₂ → 6CO₂ + 6H₂O
2. ANAEROBIC RESPIRATION:
- Happens when there is NOT ENOUGH OXYGEN available, such as during intense EXERCISE.
- This form of respiration does NOT produce as much energy because the oxidation of glucose is INCOMPLETE.
In MUSCLE cells, glucose is converted into LACTIC ACID.
- Equation: Glucose → Lactic acid
In PLANTS and YEAST, glucose is converted into ETHANOL and carbon dioxide.
- Equation: Glucose → Ethanol + Carbon dioxide
FERMENTATION
A type of anaerobic respiration in YEAST, which is widely used in the FOOD and DRINKS industry. It is valuable for:
1. Bread Making
The carbon dioxide released from the process causes the bread to RISE.

2. Making Alcoholic Drinks
The ethanol produced makes alcoholic drinks such as BEER and WINE.

Exercise and Metabolism
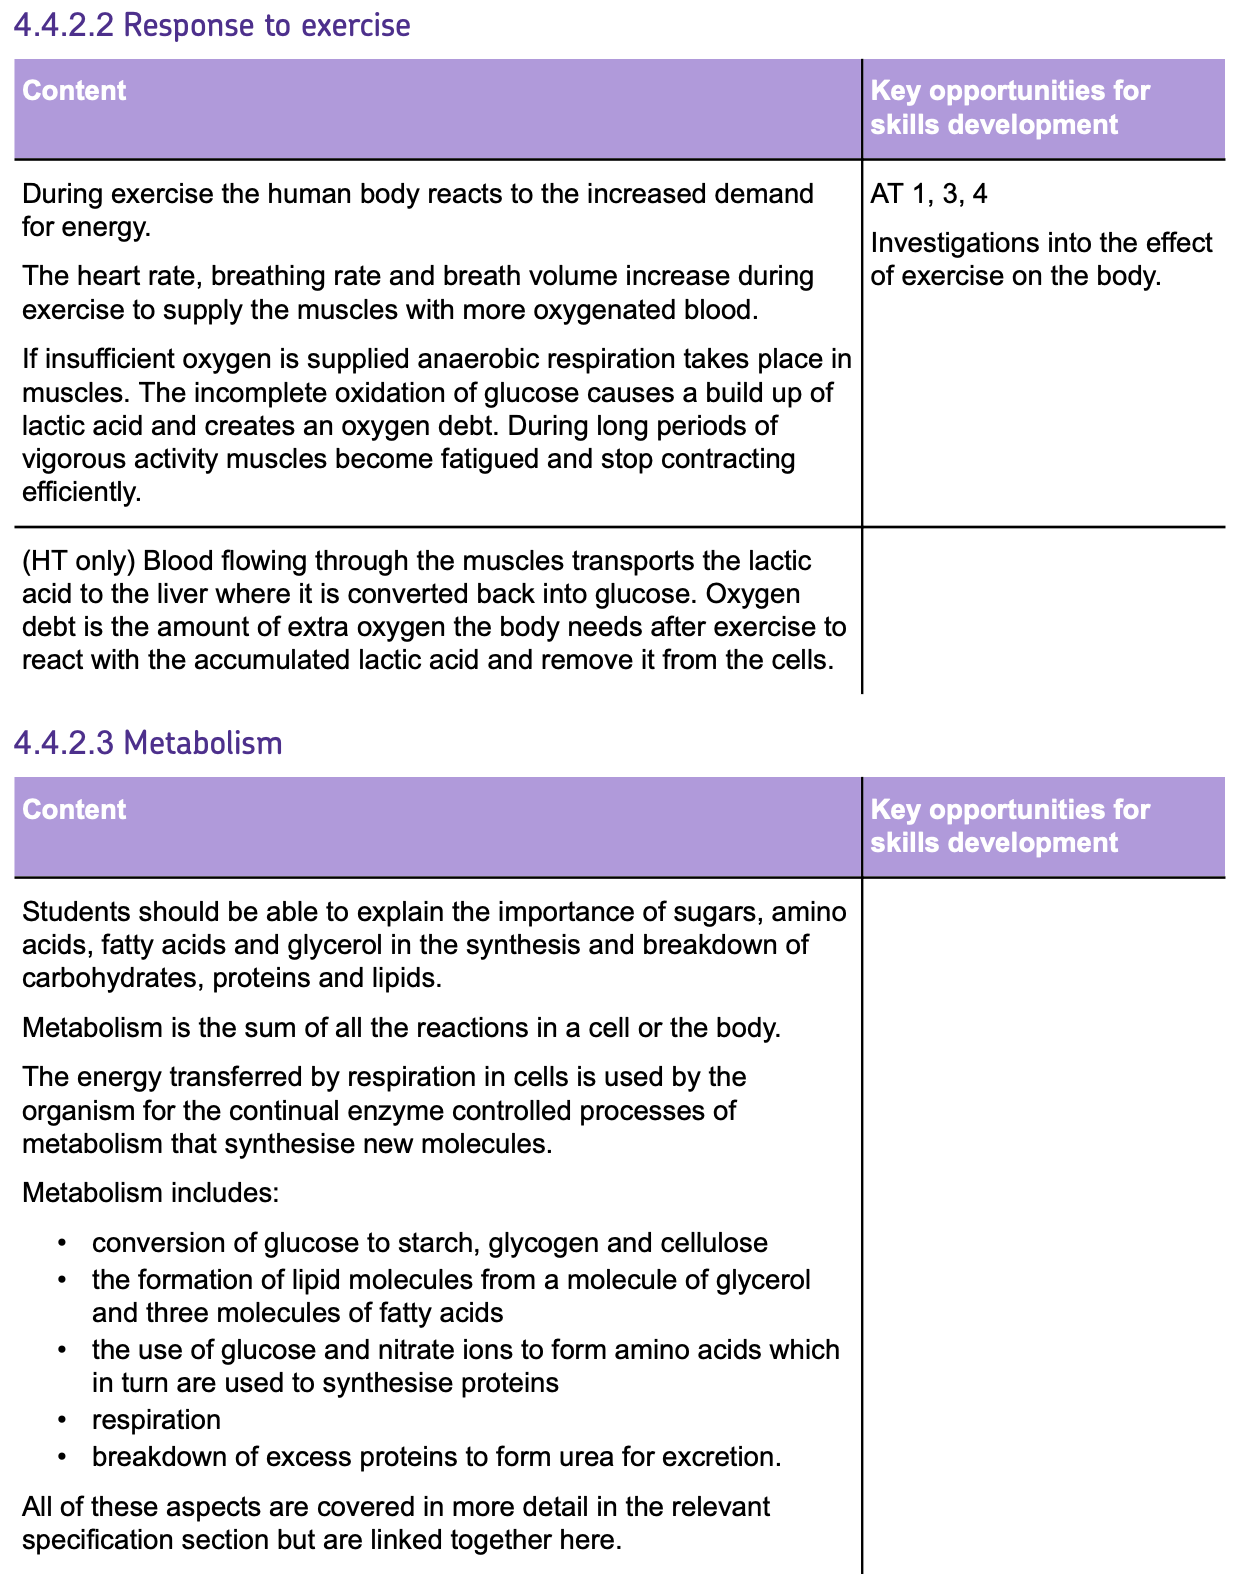
Metabolism
METABOLISM is defined as the SUM of all the CHEMICAL REACTIONS in an organism, which are regulated by ENZYMES.
The energy transferred by RESPIRATION in cells is used by the organism for the continual ENZYME CONTROLLED processes of metabolism that create new molecules.
ENZYMES are crucial as they control reactions, transforming SUBSTRATES into PRODUCTS.
Reactions for metabolism include:
1. Multiple GLUCOSE molecules joining to form STARCH and CELLULOSE in plants, and GLYCOGEN in animals.
2. Forming LIPIDS from ONE molecule of GLYCEROL and THREE molecules of FATTY ACIDS.
3. Forming AMINO ACIDS by combining GLUCOSE with NITRATE IONS to produce PROTEINS.
4. Breaking down GLUCOSE via RESPIRATION for TRANSFERRING ENERGY to power ALL reactions in the body.
5. Breaking down EXCESS PROTEIN into UREA for EXCRETION.
Exercise
When you EXERCISE, your body undergoes changes to ensure enough ENERGY is supplied to your CELLS.
Changes During Exercise:
- MUSCLES contract more during exercise, requiring more ENERGY from increased RESPIRATION.
- To supply OXYGEN for respiration, your BREATHING RATE, BREATH VOLUME and HEART RATE all increase.
- If the exercise is VIGOROUS like sprinting, the elevated breathing and heart rate does not provide ENOUGH oxygen for aerobic respiration so ANAEROBIC RESPIRATION takes place.
- This leads to MUSCLE FATIGUE and LACTIC ACID build up which causes the body pain and can lead to inefficiency in MUSCLE CONTRACTIONS due to fatigue.
Anaerobic Respiration and Oxygen Debt
- After the exercise is finished, your body has an OXYGEN DEBT that must be repaid to clear the LACTIC ACID that has built up.
- To repay the OXYGEN DEBT, breathing and heart rate remains HIGH even AFTER stopping the exercise.
- LACTIC ACID is transported to the LIVER to be converted back into GLUCOSE.
Homeostasis
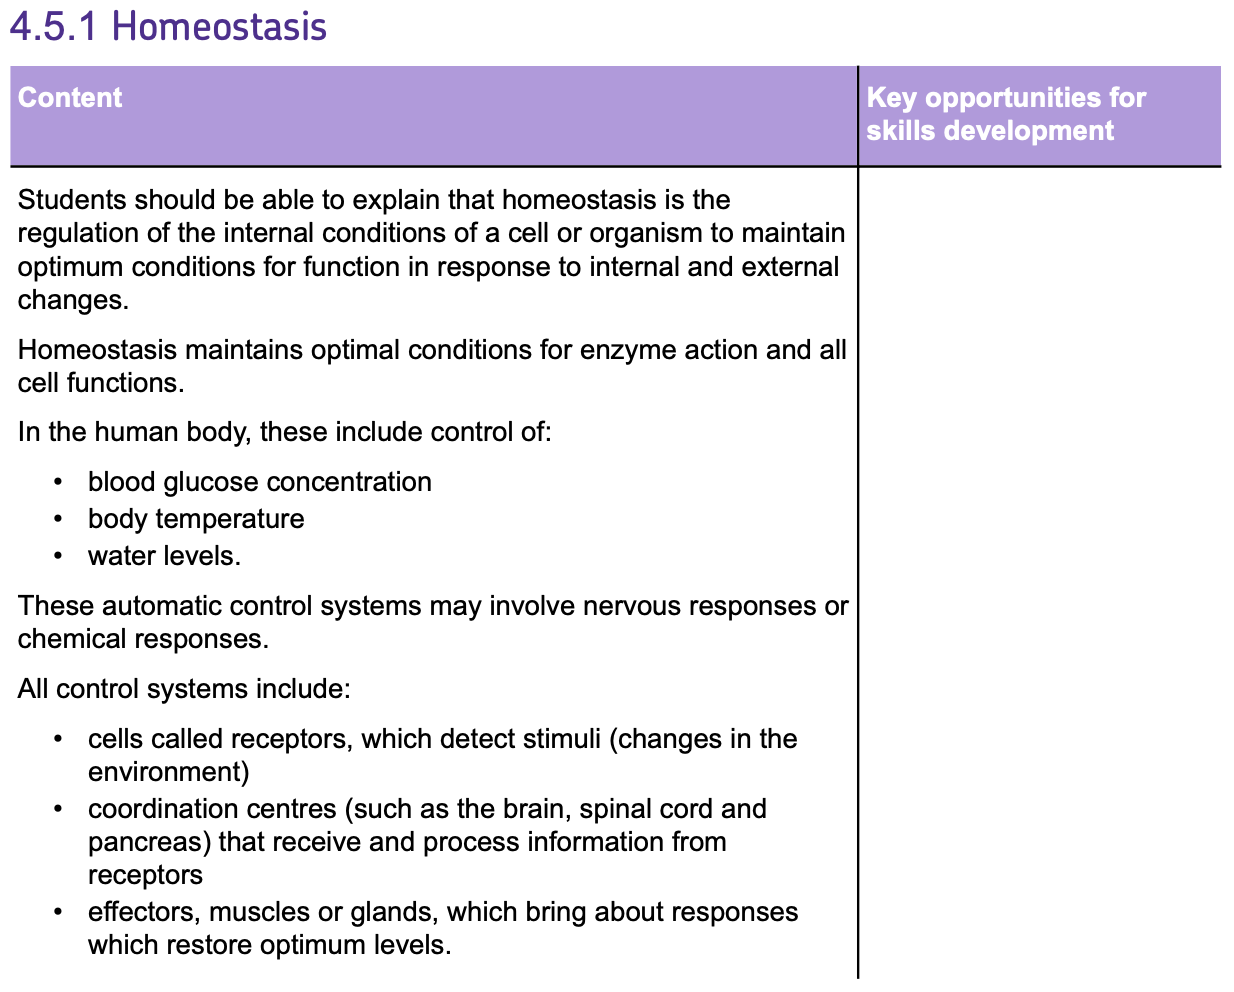
HOMEOSTASIS is the maintenance of a STABLE INTERNAL ENVIRONMENT in the body.
It's how your body keeps CONDITIONS just right for your cells to work at their best, despite what's happening outside or inside your body.
Examples of conditions that need to be kept constant are:
- BODY TEMPERATURE
- BLOOD GLUCOSE LEVELS
- WATER CONTENT
Your body needs to keep conditions STEADY for ENZYME ACTION and to keep cells functioning properly. These conditions are kept constant by using AUTOMATIC CONTROL SYSTEMS that require both NERVOUS and HORMONAL responses.
Components of Control Systems:
All of the automatic control systems in the body have the following features:
1. RECEPTORS:
They DETECT STIMULI (changes in the environment) and can be used to find out when levels (like glucose or temperature) are too high or too low.
2. COORDINATION CENTRES:
These RECEIVE INFORMATION from receptors and organise a RESPONSE.
Examples of these are the BRAIN, SPINAL CORD, and PANCREAS.
3. EFFECTORS:
These can either be a MUSCLE or a GLAND.
They carry out the RESPONSE to restore the optimum levels for the condition.
The Nervous System
The NERVOUS SYSTEM allows humans to REACT to their surroundings and COORDINATE their behaviour.
PARTS OF THE NERVOUS SYSTEM:
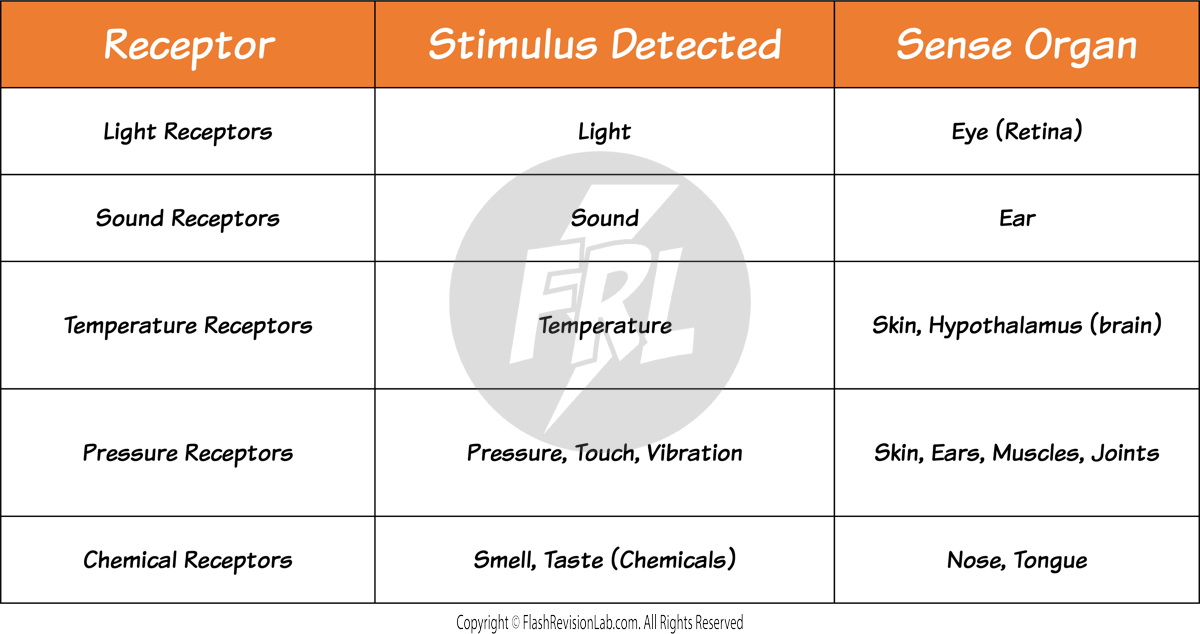
RECEPTORS:
Cells that DETECT STIMULI (A change in environment). They are found in SENSE ORGANS. Examples of these are:
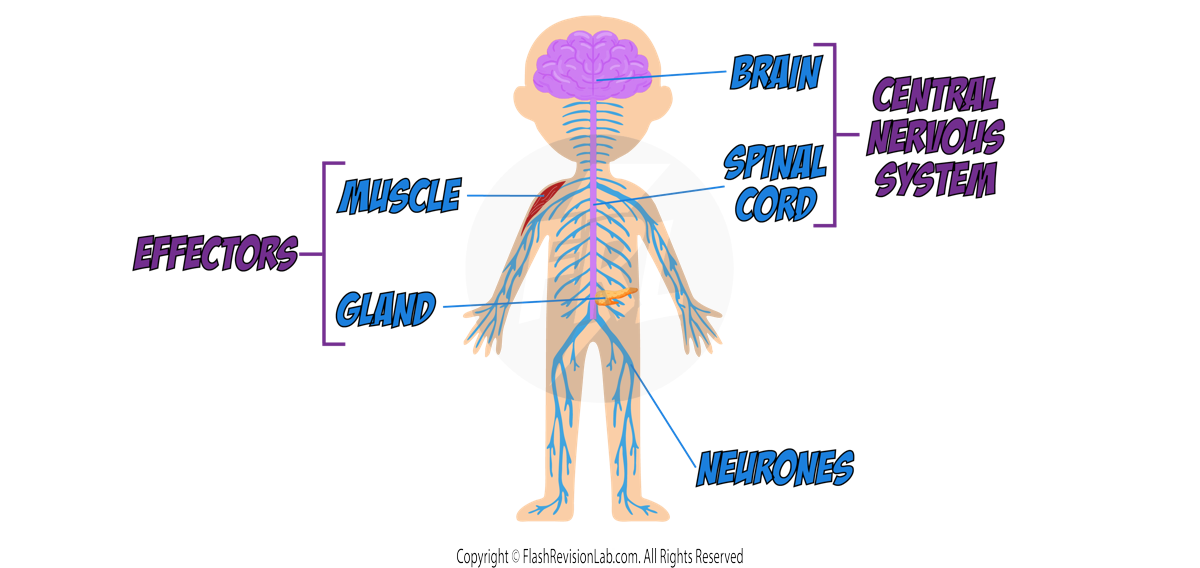
EFFECTORS:
Effectors provide a RESPONSE for actions.
They can either be a MUSCLE or GLAND.
A muscle CONTRACTS to respond and a gland SECRETES HORMONES.
CENTRAL NERVOUS SYSTEM (CNS):
- Consists of the BRAIN and SPINAL CORD.
- These act as the COORDINATION CENTRE for nervous responses where they PROCESS the information from RECEPTORS and send back a response to EFFECTORS.
NEURONES
All the structures in the nervous system are connected by NEURONES.
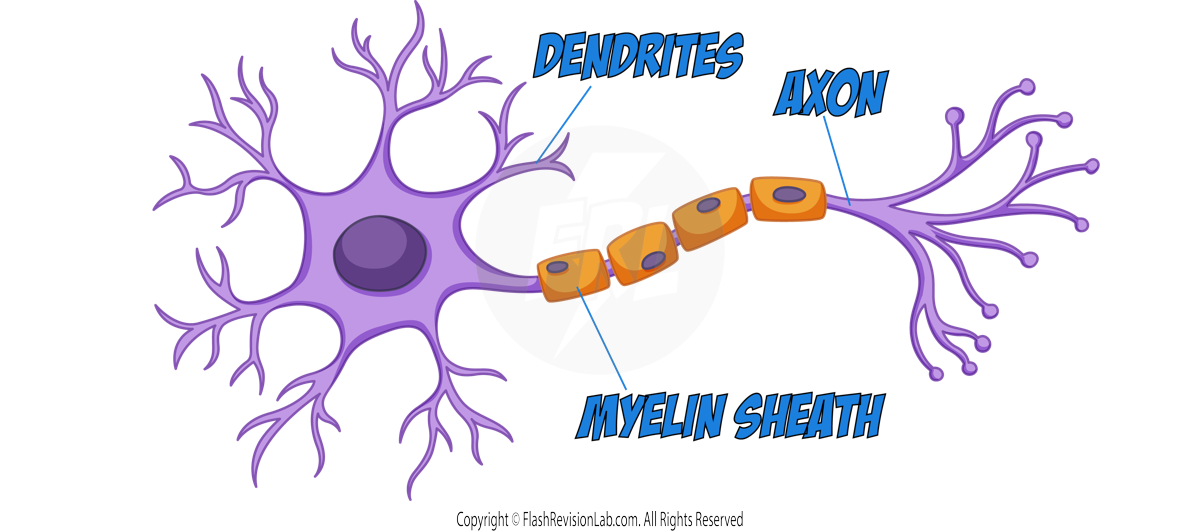
Theses are NERVE CELLS which are specialised to transmit information around the body in the form of ELECTRICAL IMPULSES.
There are THREE types of neurones:
1. SENSORY NEURONES:
They carry information from RECEPTORS to the CNS as electrical impulses.
2. MOTOR NEURONES:
They transmit electrical impulses from the CNS to EFFECTORS.
3. RELAY NEURONES:
These are only used in REFLEX RESPONSES (see later).
They are found in the SPINAL CORD.
They connect SENSORY NEURONES to MOTOR NEURONES directly.
How the Nervous System Works
There are TWO types of responses that the nervous system can make:
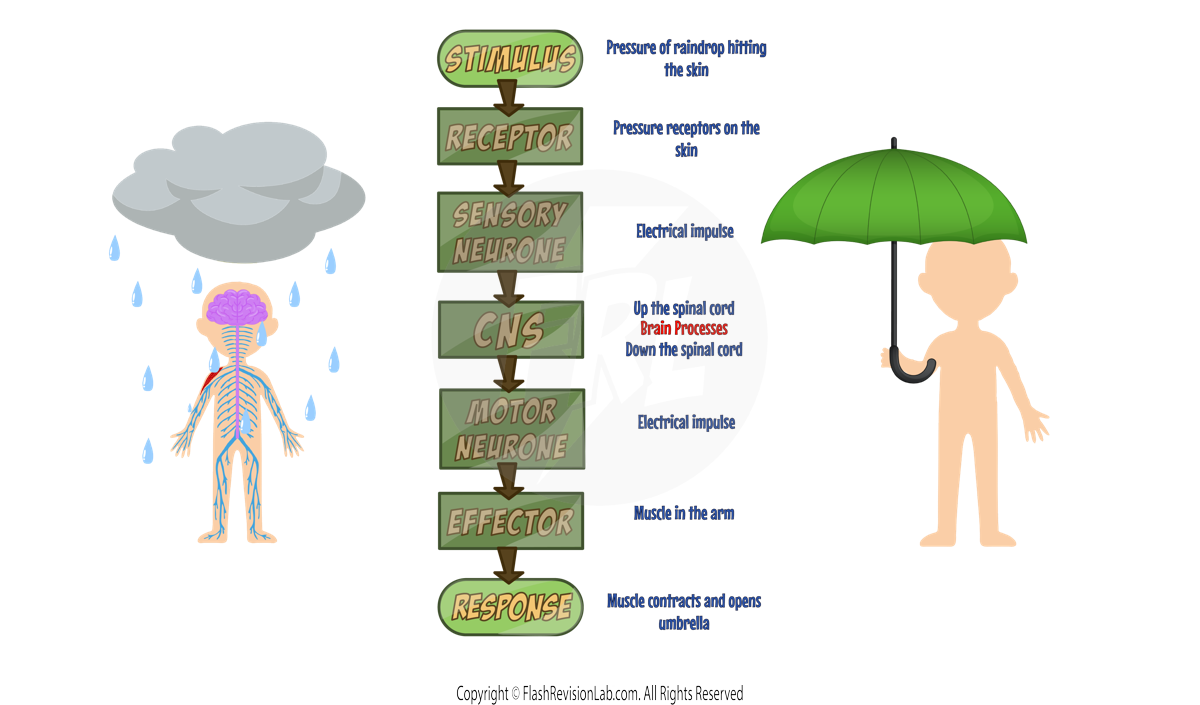
1. VOLUNTARY RESPONSES
These are CONSCIOUS responses that involve the BRAIN as the COORDINATION CENTRE.
The route that these responses take start with a STIMULUS that is detected by a RECEPTOR.
The receptor transmits electrical signals that travel through the SENSORY NEURONE to the CNS.
Within the CNS the message goes up the spinal cord to the BRAIN where the information is PROCESSED, and a response is sent back as another electrical impulse.
The response then travels through a MOTOR NEURONE and arrives at the EFFECTOR which provides a RESPONSE (contraction or secretion of hormones).
As an example, let’s consider a rain drop landing on a persons skin, resulting in them opening an umbrella:
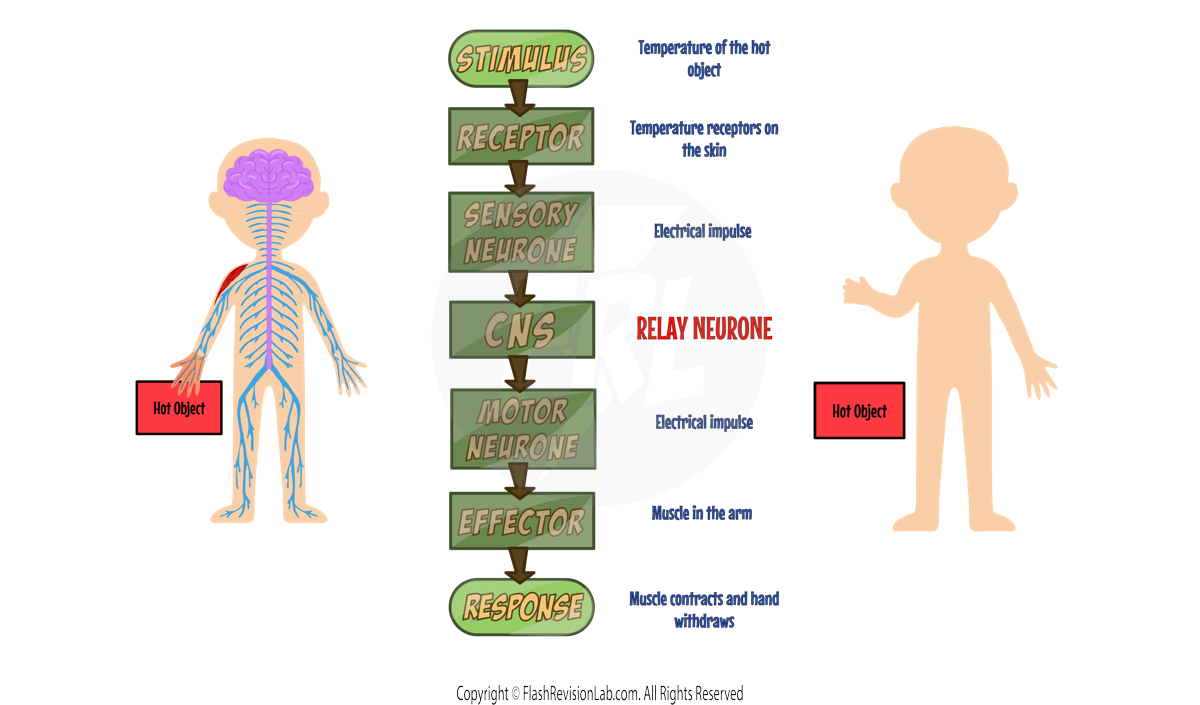
2. REFLEX RESPONSES
These are AUTOMATIC responses that involve RELAY NEURONES as the COORDINATION CENTRE.
As they do NOT send messages to the brain for processing, they are RAPID and AUTOMATIC, which is useful as their quick nature can protect the body from INJURY.
As and example, let’s consider a person touching a very hot object, resulting in a reflex response where they WITHDRAW their hand.
The ROUTE that the electrical signals take during a reflex response is known as the REFLEX ARC.
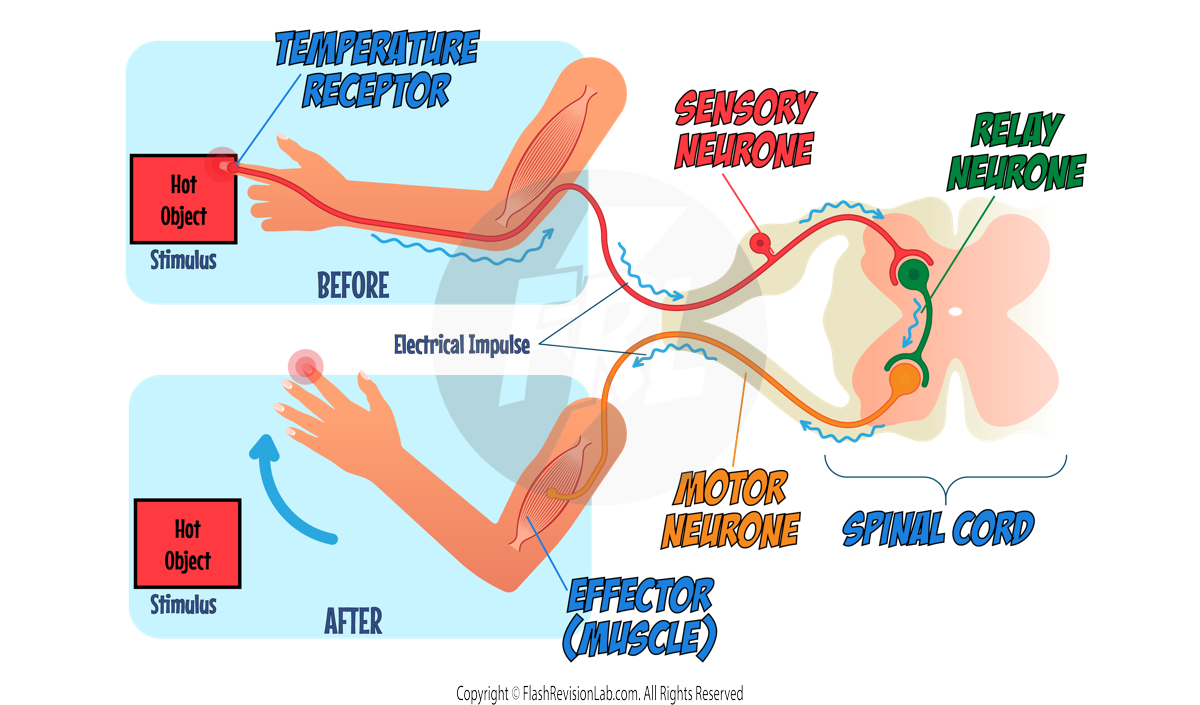
As this is a REFLEX RESPONSE, the person would have withdrawn their hand more RAPIDLY than a voluntary response.
This quick response means the person’s hand spends LESS TIME touching the hot object and therefore REDUCES the burning of the skin.
SYNAPSES
The diagram below shows a more detailed diagram of the REFLEX ARC.
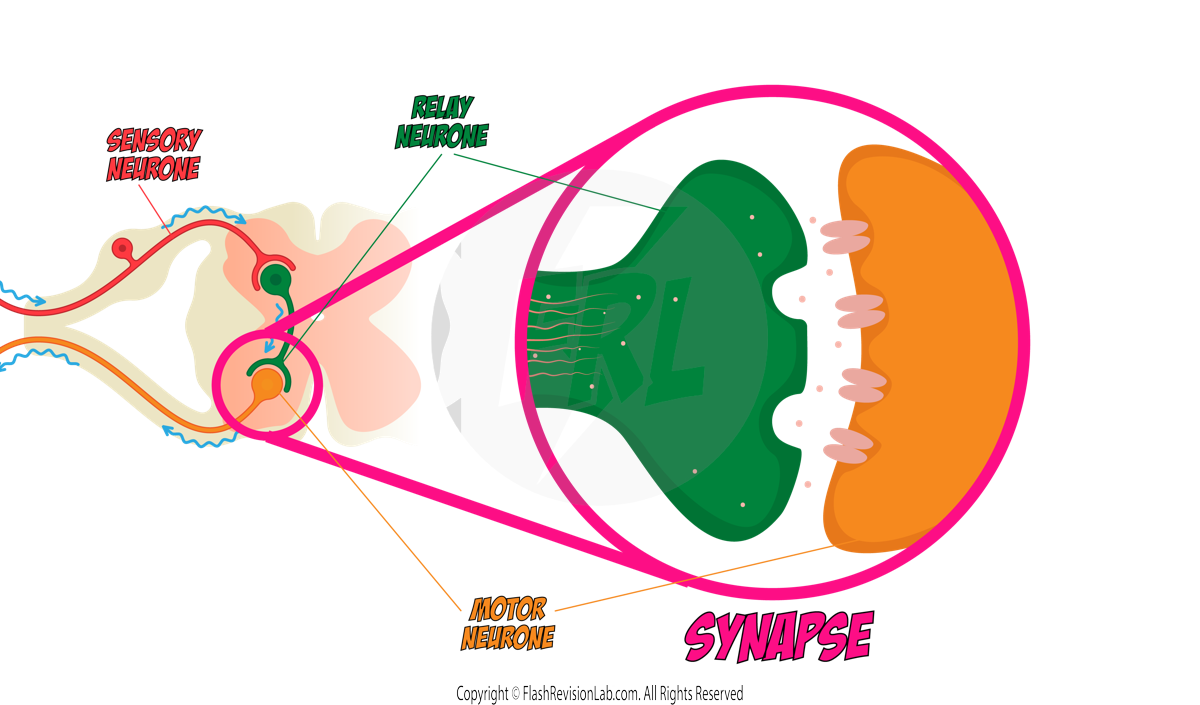
SYNAPSES are connections between neurones which consist of a GAP.
Electrical impulses can NOT pass through the gap, so when an impulse reaches a synapse, it CONVERTS it into a CHEMICAL known as NEUROTRANSMITTER.
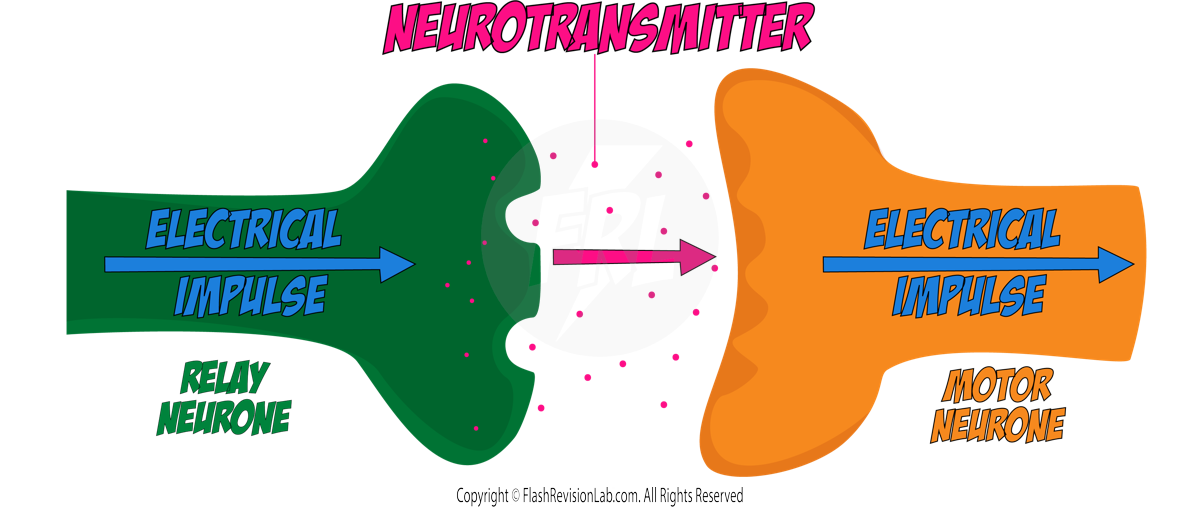
The neurotransmitter DIFFUSES across the gap of the synapses where it picked up by receptors and converted back into an electrical impulse in the next neurone.
Required Practical: Human Reaction Times
REACTION TIME is measures how quickly an individual can RESPOND to a STIMULUS. Factors affecting a person’s reaction time include AGE, GENDER, and SUBSTANCE INTAKE (such as caffeine or medication).
1. Ruler Drop Experiment
To measure REACTION TIME without complex equipment, you can use the simple RULER DROP TEST. Here's a detailed guide on how to conduct it:
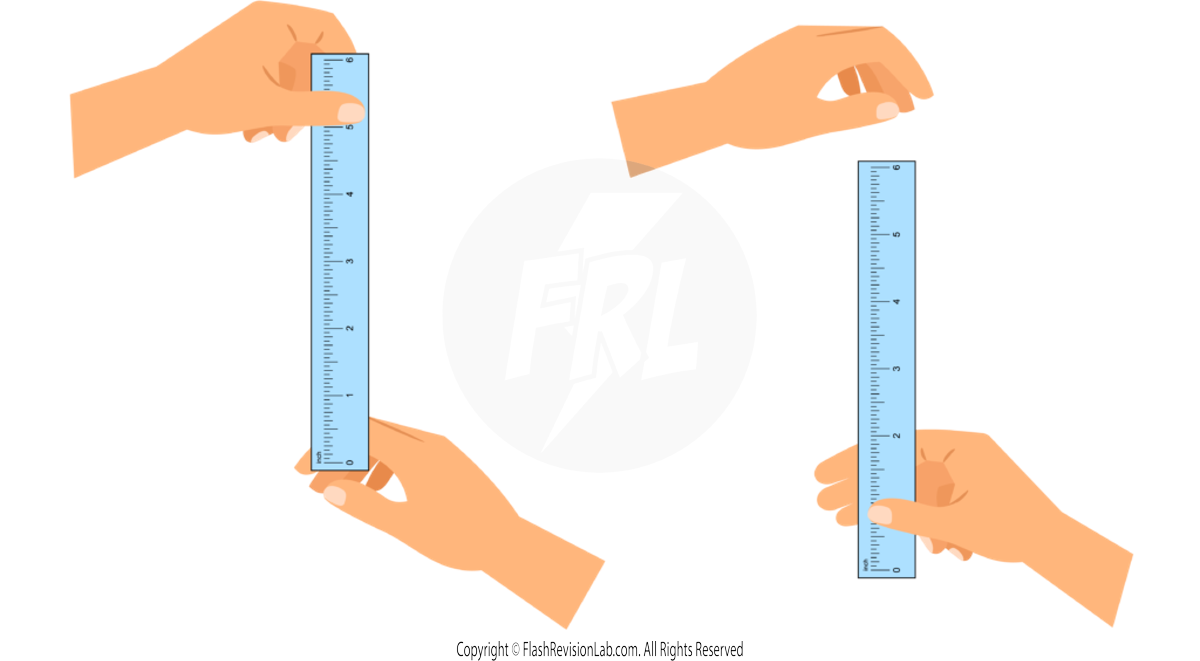
- The person being tested should sit comfortably with their forearm resting on the table's edge, ensuring their hand is over the edge to catch the ruler.
- Position a ruler so that the ZERO MARK is between the subject's thumb and forefinger, which should be at the same height each time to avoid variability.
- The experimenter holds the ruler above the zero mark and RELEASES it without any cues to initiate the test subject's reaction.
- The participant CATCHES the ruler as swiftly as possible upon its release.
- Note the reading on the ruler where it was caught—this number correlates with the REACTION TIME. The further down the ruler is caught, the slower the reaction.
- Repeat this process several times to establish an average, which is the MEAN REACTION TIME.
- To assess the impact of stimulants like CAFFEINE, you can have the participant drink a caffeinated beverage and perform the test again after a set period.
- Ensure that CONTROL VARIABLES are consistent in each trial. This includes the arm used, the height of the drop, and the participant's prior intake of substances like caffeine which could affect their reaction time.
2. COMPUTER-BASED MEASUREMENTS
For a more accurate assessment, computer programs can be used:
- These tests often involve responding to a visual change, like a colour shift on the screen, by pressing a key or clicking the mouse.

- Computer tests remove inconsistencies such as anticipation or guessing when the ruler will fall, which can affect manual test results.
- The precision of computers allows for reaction times to be recorded down to the millisecond, providing a much MORE DETAILED view of the person's responsiveness.
- Computer tests also eliminate the potential for HUMAN ERROR in measurement and are MORE RELIABLE for repeated testing and tracking changes over time.

The Endocrine System
This system uses HORMONES as CHEMICAL MESSENGERS to communicate within the body.
- HORMONES are chemical molecules which are produced by ENDOCRINE GLANDS and released into the BLOODSTREAM.
- The blood CARRIES the hormone to TARGET ORGANS where it produces an EFFECT.
- HORMONAL responses are generally SLOWER but have LONGER LASTING effects when compared to NERVOUS responses (by the nervous system).
ENDOCRINE GLANDS AND THEIR FUNCTIONS:
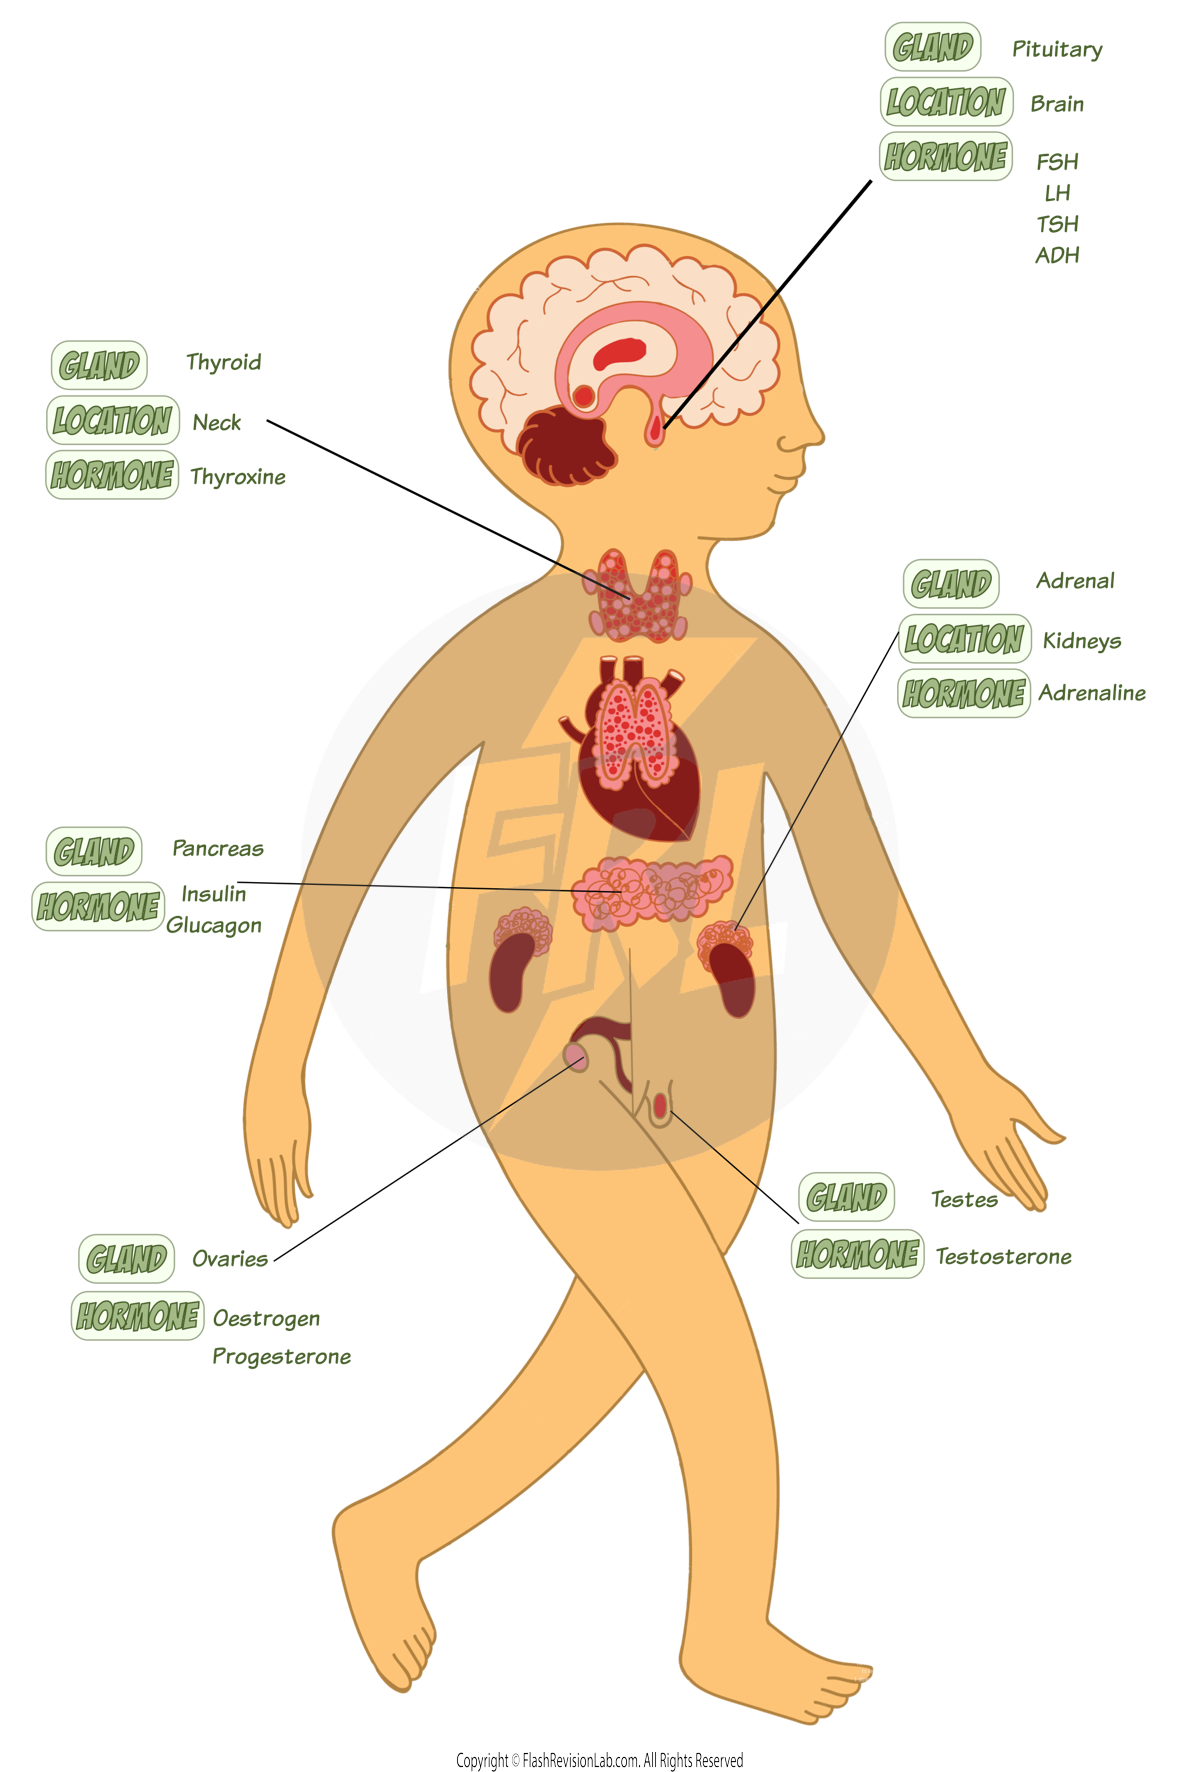
- PITUITARY GLAND: Known as the 'MASTER GLAND,' it produces SEVERAL hormones that regulate body conditions. These hormones influences OTHER GLANDS to stimulate OTHER HORMONES to be released to bring about effects.
- THYROID: Produces THYROXINE, which is crucial for regulating metabolism, heart rate, and temperature.
- ADRENAL GLAND: Produces ADRENALINE, for the 'fight or flight' response in times of danger or stress.
- PANCREAS: Produces INSULIN and GLUCAGON which regulate blood glucose levels.
- OVARIES (Females only): Produce OESTROGEN, important for the menstrual cycle.
- TESTES (Males only): Produce TESTOSTERONE, which controls puberty and sperm production.
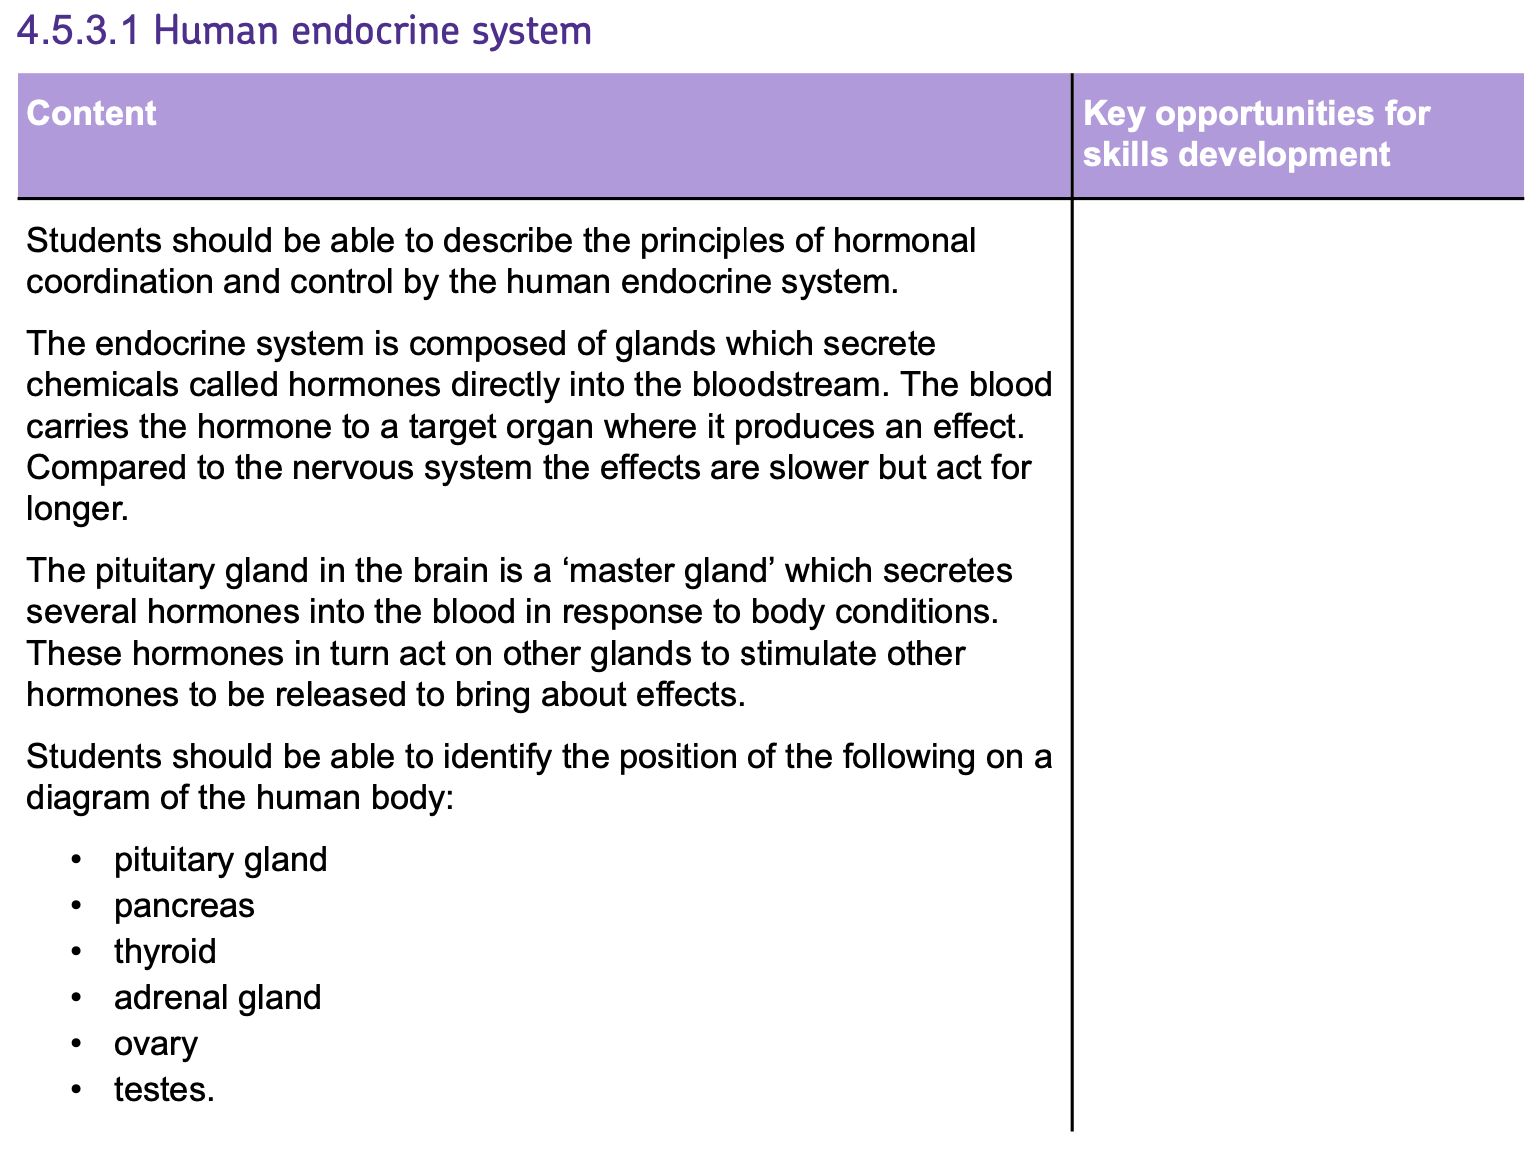
Adrenaline and Thyroxine
ADRENALINE:
ADRENALINE is a hormone released by the ADRENAL GLANDS, which sit on top the KIDNEYS.
Triggered by stress, fear, or a threat, ADRENALINE gets the body ready for quick action by using the 'FIGHT OR FLIGHT' response.
ADRENALINE causes:
- INCREASES HEART RATE: To supply muscles and organs with more OXYGEN.
- BOOSTS ENERGY SUPPLY: By increasing GLUCOSE LEVELS in the blood, providing immediate energy for the BRAIN and MUSCLES.
THYROXINE:
THYROXINE, secreted by the THYROID GLAND located in the NECK, is essential for normal growth, development, and metabolism.
It specifically influences:
- BASAL METABOLIC RATE (BMR): Determines how fast the body uses energy at rest.
It is regulated by THYROID-STIMULATING HORMONE (TSH) which is released by the PITUITARY GLAND.
- When TSH is RELEASED, the thyroid gland RELEASES thyroxine.
- When TSH is INHIBITED (stopped), the thyroid gland STOPS RELEASING thyroxine.
Negative Feedback
- TSH itself is regulated by a NEGATIVE FEEDBACK mechanism, ensuring thyroxine levels remain balanced.
- The NEGATIVE FEEDBACK system in the body works similarly to a thermostat, adjusting hormone levels to keep them within a healthy range.
- This system prevents the overproduction or underproduction of hormones, maintaining HOMEOSTASIS.
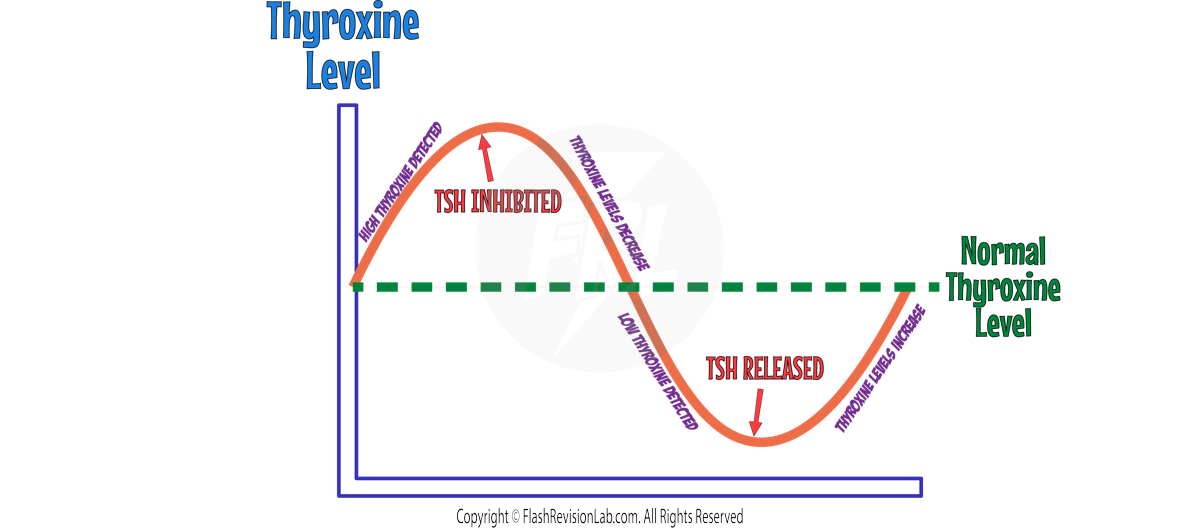
- When THYROXINE levels are too HIGH, TSH release is REDUCED to lower production.
- Conversely, if THYROXINE levels are too LOW, TSH production is INCREASED to stimulate more thyroxine release.
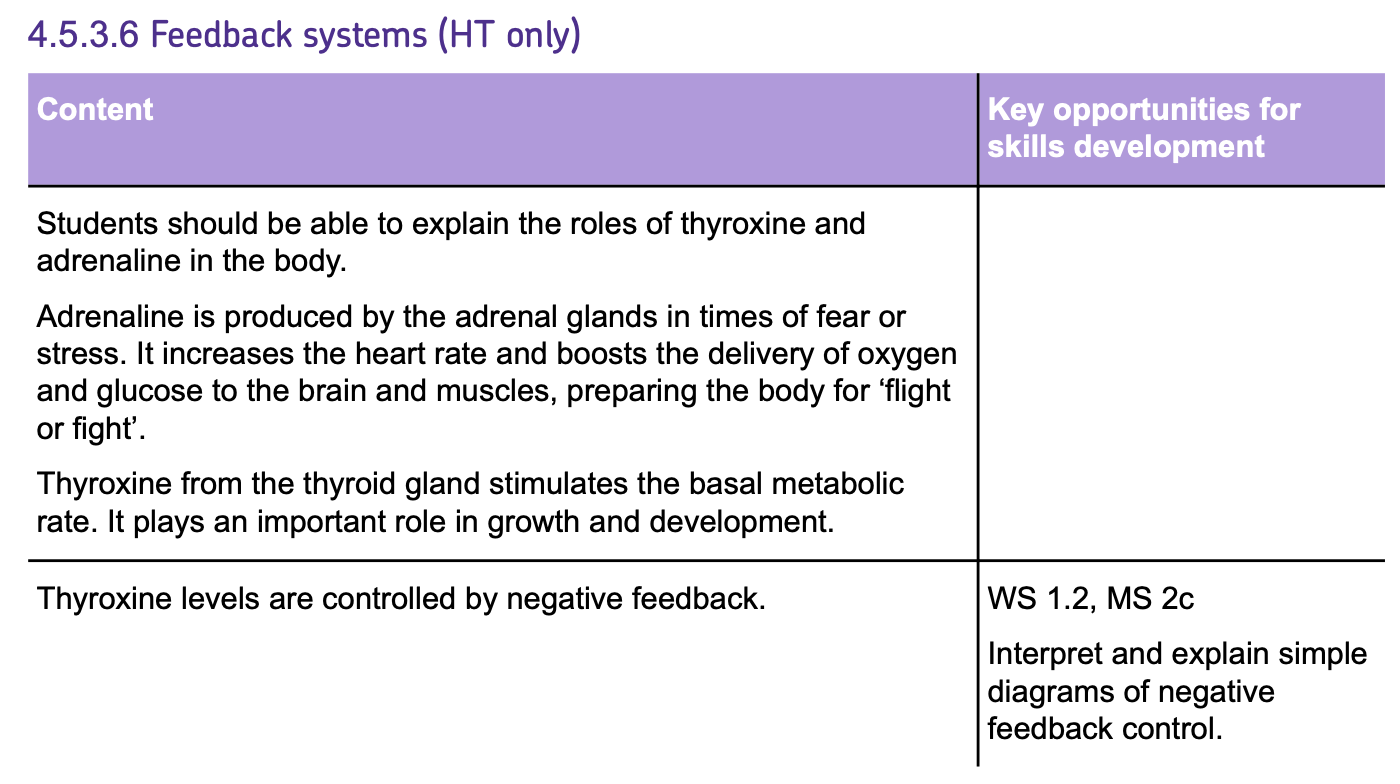
Controlling Blood Glucose
- After eating CARBOHYDRATES, the digestive system converts them into glucose, which enters the bloodstream.
- Normal metabolism reactions in cells then USE this glucose, which REDUCES blood glucose levels.
- Any excess glucose that is not immediately used, is stored as GLYCOGEN in the LIVER and MUSCLE.
- These glycogen stores can then be converted BACK into glucose when ever the body requires extra energy.
- The COORDINATION CENTRE for blood glucose concentration is the PANCREAS as it MONITORS and CONTROLS its levels.
There are TWO HORMONES responsible for controlling blood glucose concentration:
1. INSULIN
Insulin causes blood glucose level to DECREASE.
It causes GLUCOSE in the blood to convert into GLYCOGEN which is stored in the LIVER and MUSCLES.
2. GLUCAGON
Glucagon causes blood glucose levels to INCREASE.
Does the opposite; It causes GLYCOGEN in the LIVER and MUSCLES to be converted back into GLUCOSE and releases it into the blood stream.
INSULIN and GLUCAGON are both used in the body's energy management system. They maintain STABLE levels of GLUCOSE in the BLOODSTREAM, to achieve HOMEOSTASIS.
MAINTAINING BLOOD GLUCOSE LEVELS
- The body's ability to keep blood glucose levels in check involves a NEGATIVE FEEDBACK mechanism:
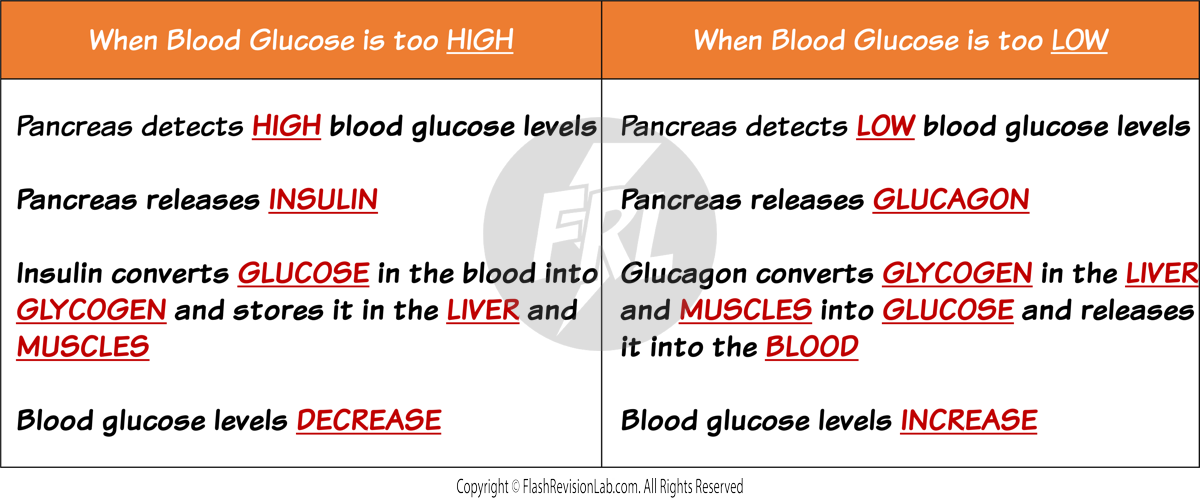
- If glucose levels rise too high, more INSULIN is produced.
- If levels fall too low, more GLUCAGON is released.
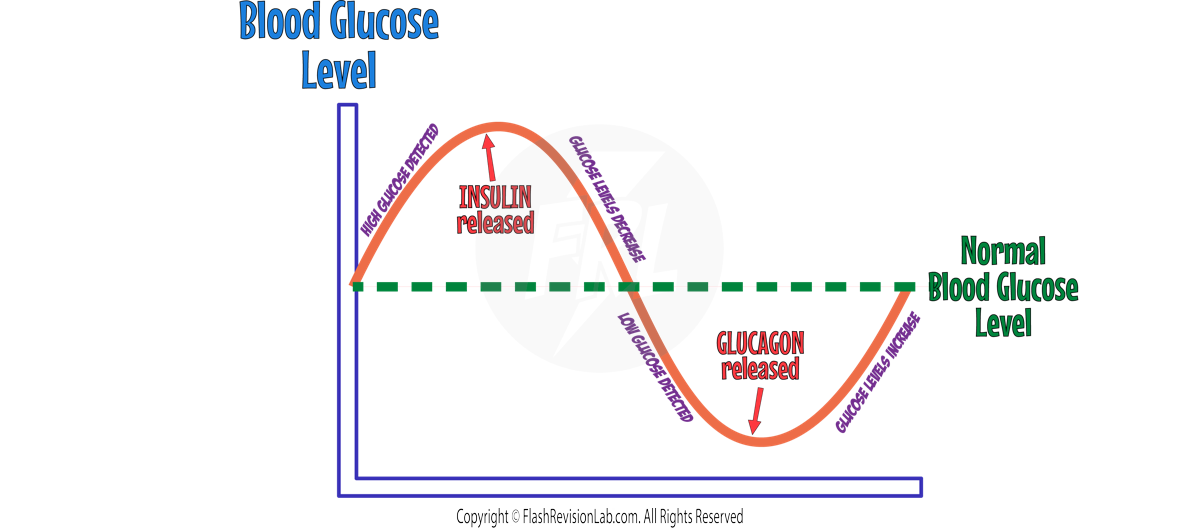
- AFTER EATING, blood glucose levels rise, causing the PANCREAS to secrete INSULIN, prompting cells in the liver and muscles, to absorb glucose and store it as glycogen.
- During periods of FASTING or HEAVY EXERCISE, when glucose levels start to drop, the pancreas releases GLUCAGON. This hormone signals the liver to convert glycogen back into glucose and release it into the bloodstream.
DIABETES
DIABETES is a condition that disrupts normal blood glucose regulation.
TYPE 1 DIABETES
- This occurs when the pancrease produces LITTLE or NO INSULIN.
- It is INHERITED which means it gets passed down from your parents.
- A person with Type 1 diabetes can manage it with regular INSULIN INJECTIONS, specifically around meal times.
- They can reduce the amount of insulin they need to inject by having a CARBOHYDRATE-CONTROLLED DIET and engaging in regular EXERCISE.
TYPE 2 DIABETES
- This arises from the body's cells becoming RESISTANT to INSULIN.
- Insulin still gets released by the pancreas, but it does NOT lower blood glucose as much as it should, resulting in high levels.
- Obesity is a RISK FACTOR for type 2 diabetes, meaning it can increase your chances of getting it.
- Type 2 diabetes can often be managed through lifestyle changes such as adopting a CARBOHYDRATE-CONTROLLED DIET and engaging in regular EXERCISE.
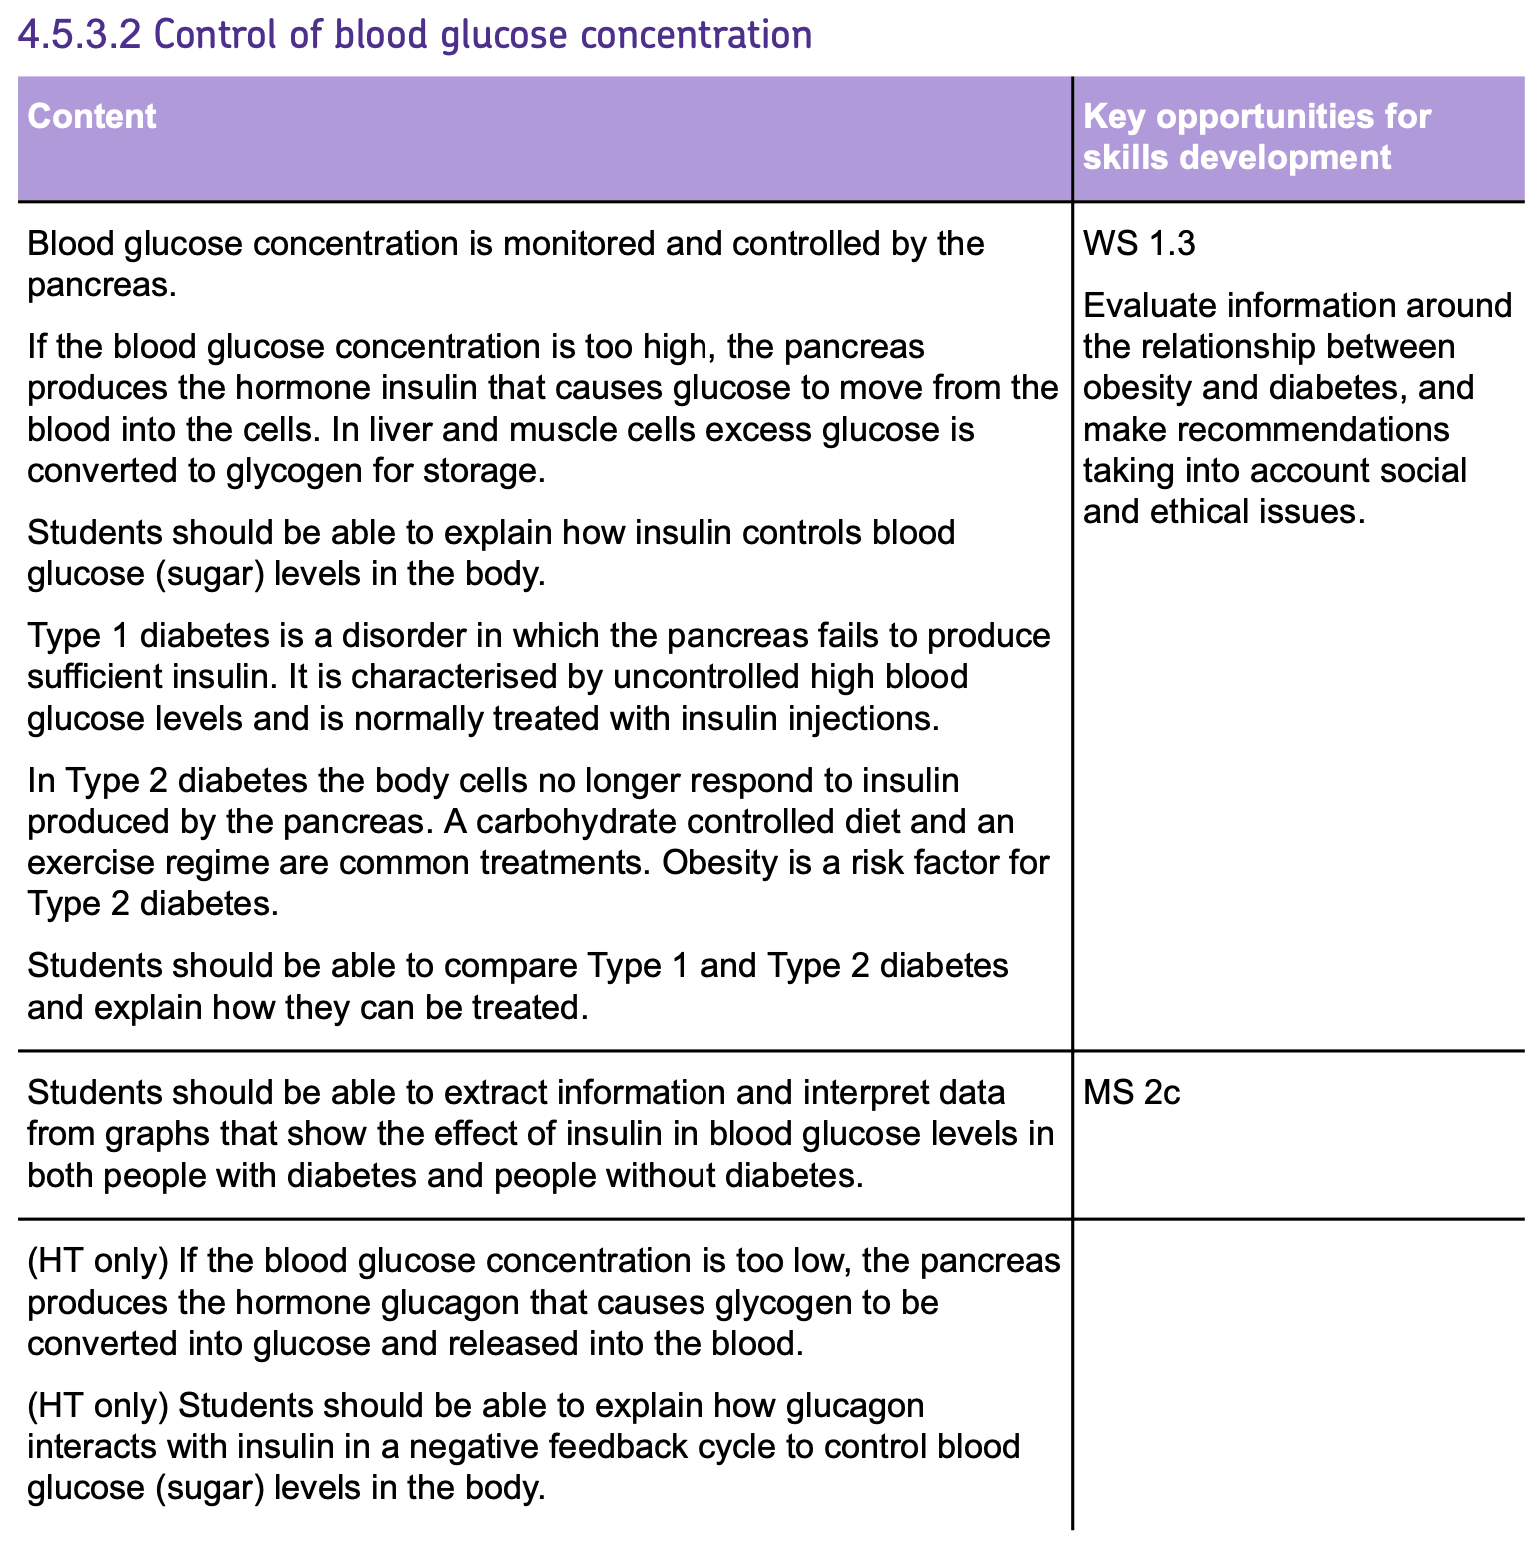
The Menstrual Cycle
HORMONES AND PUBERTY
- During PUBERTY, the body begins to release SEX HORMONES which lead to secondary sexual characteristics.
- In MEN, TESTOSTERONE is the key hormone, produced by the TESTES. It stimulates SPERM PRODUCTION and causes physical changes like facial hair growth.
- In WOMEN, OESTROGEN is produced by the OVARIES and is responsible for eggs maturing and changes like breast development. It also plays a significant role in the MENSTRUAL CYCLE.
THE MENSTRUAL CYCLE
Hormones
There are FOUR hormones involved in the menstrual cycle:
1. OESTROGEN
- Produced in the OVARIES.
- Causes the uterus lining to GROW.
- Stimulates LH RELEASE and INHIBITS FSH.
2. PROGESTERONE
- Produced after ovulation by the OVARIES.
- MAINTAINS the uterus lining.
- INHIBITS FSH and LH.
3. FSH (Follicle-Stimulating Hormone)
- Produced by the PITUITARY GLAND.
- Causes eggs to MATURE in the ovaries.
- STIMULATES oestrogen production.
4. LH (Luteinising Hormone)
- Also produced by the PITUITARY GLAND.
- Triggers OVULATION (the release of an egg).
Stages
The menstrual cycle consists of FOUR stages:
STAGE 1: Days 1-4
MENSTRUATION begins, and the lining of the uterus breaks down for about four days.
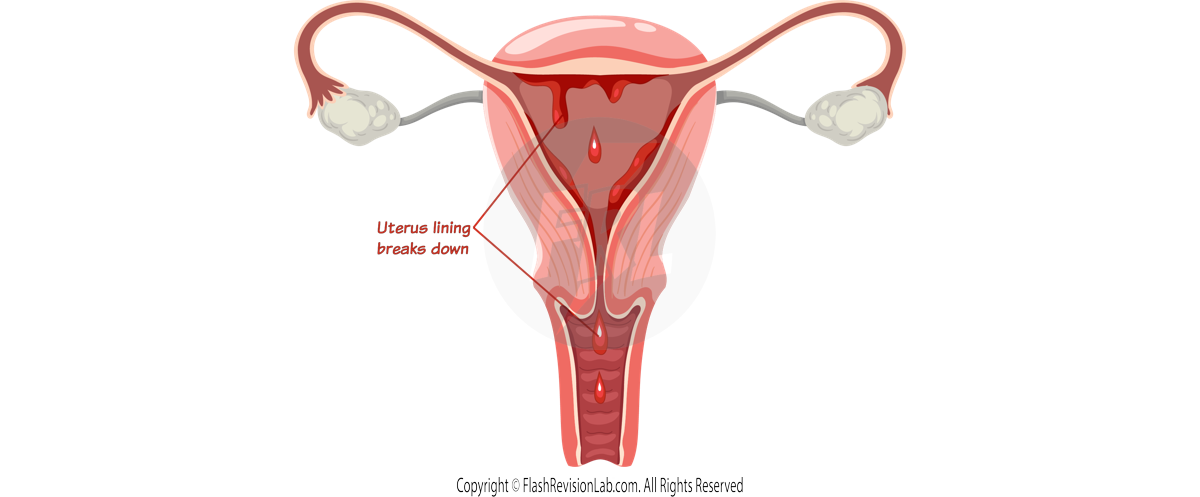
STAGE 2: Days 4-14
The uterus lining REBUILDS itself, forming a thick layer ready for potential fertilisation.
The egg DEVELOPS in preparation to be released.
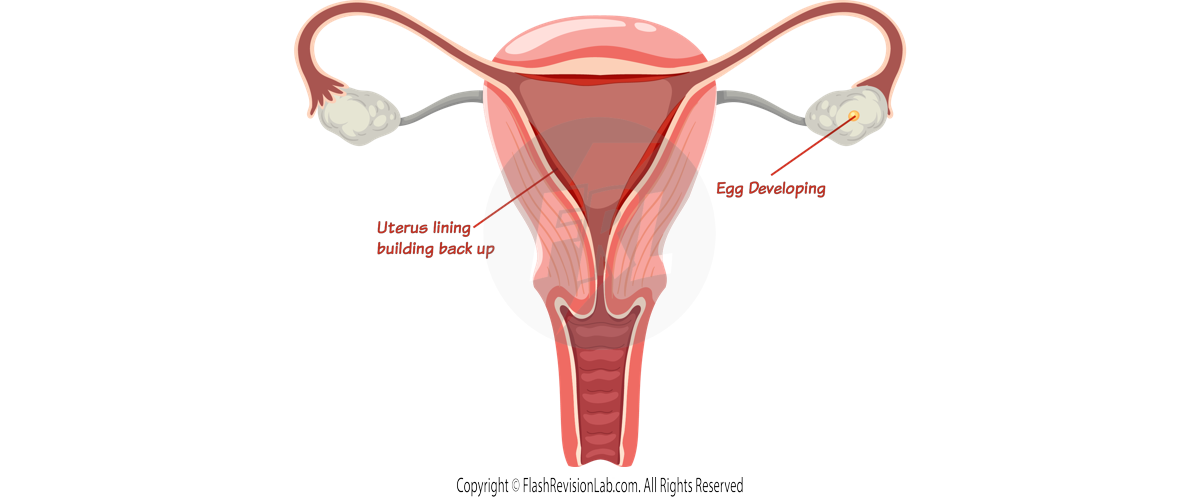
STAGE 3: Day 14
OVULATION occurs where an egg is released from an OVARY.
The uterus lining has fully REBUILT by this point
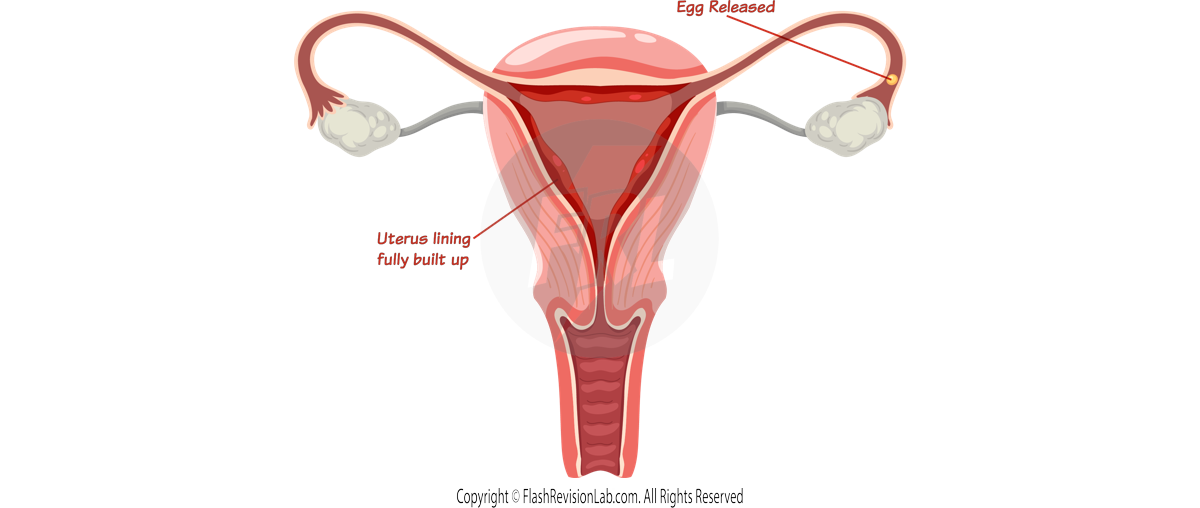
STAGE 4: Day 28
The uterus lining is MAINTAINED for about 14 days until day 28. If no fertilisation occurs, the cycle restarts.
If the egg gets fertilised by a sperm, the lining remains maintained in preparation to develop the embryo.
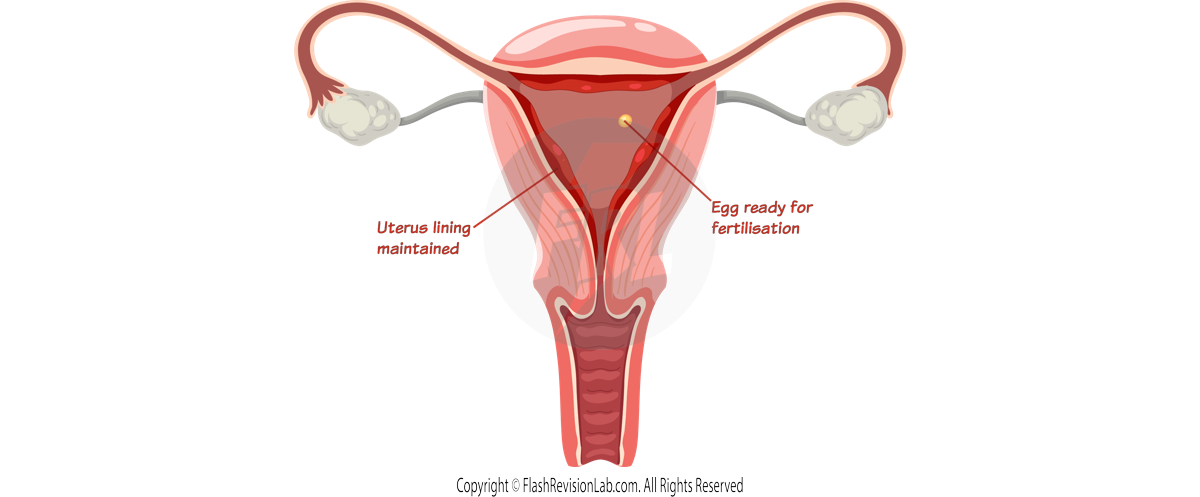
Here is how the levels of each of the hormones vary throughout one full cycle:
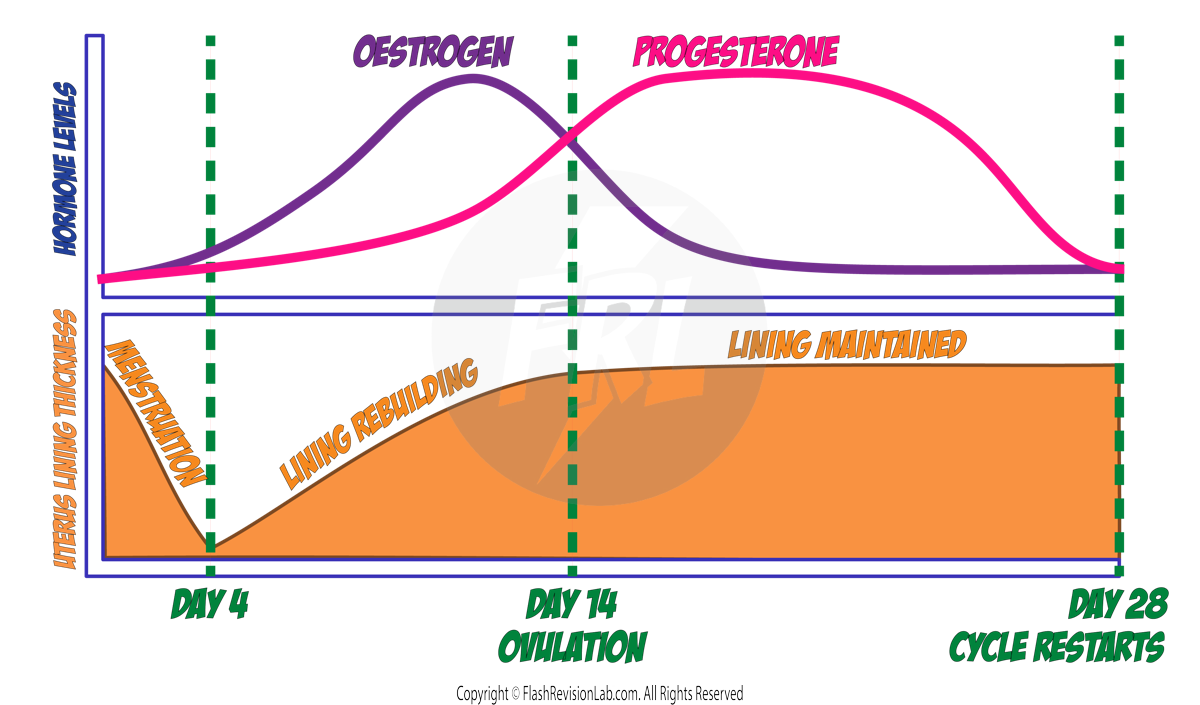
OESTROGEN levels are the HIGHEST from days 4-14 to make the uterus lining REBUILD.
PROGESTERONE levels are the HIGHEST from days 14-28, to keep the uterus lining MAINTAINED in preparation for fertilisation.
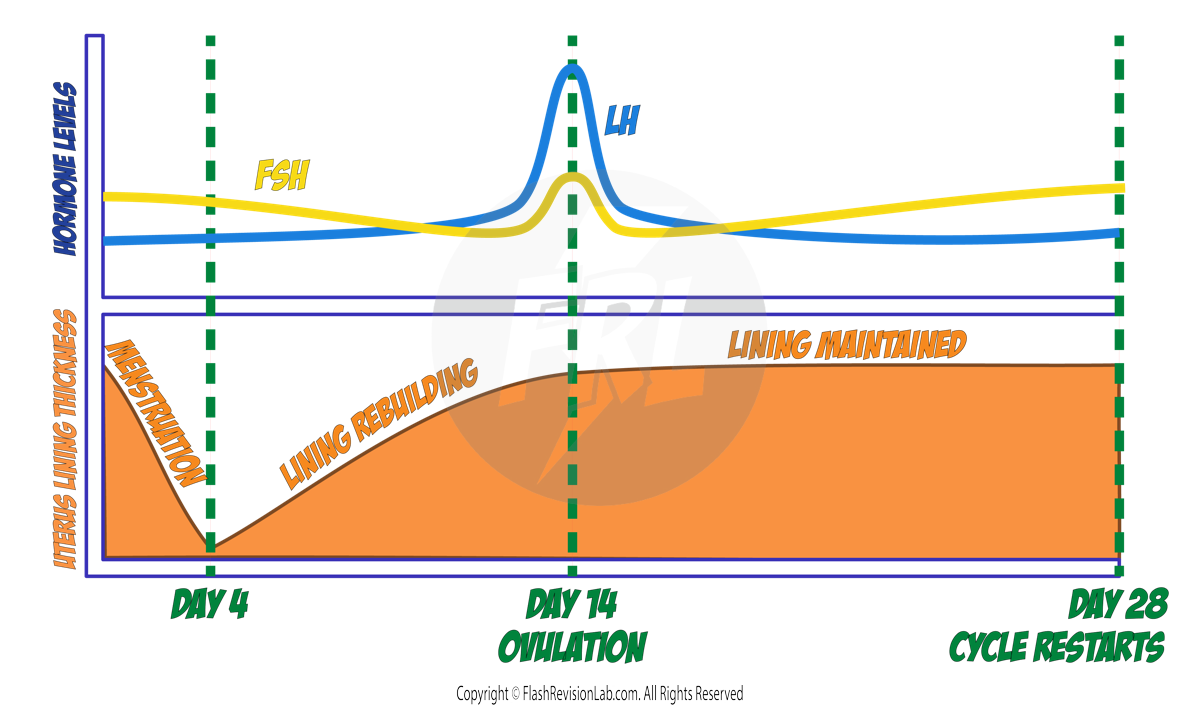
LH levels are the HIGHEST on day 14 to RELEASE the egg (OVULATION).
FSH levels remain high on day 14 and during MOST of the cycle to allow the egg to DEVELOP.
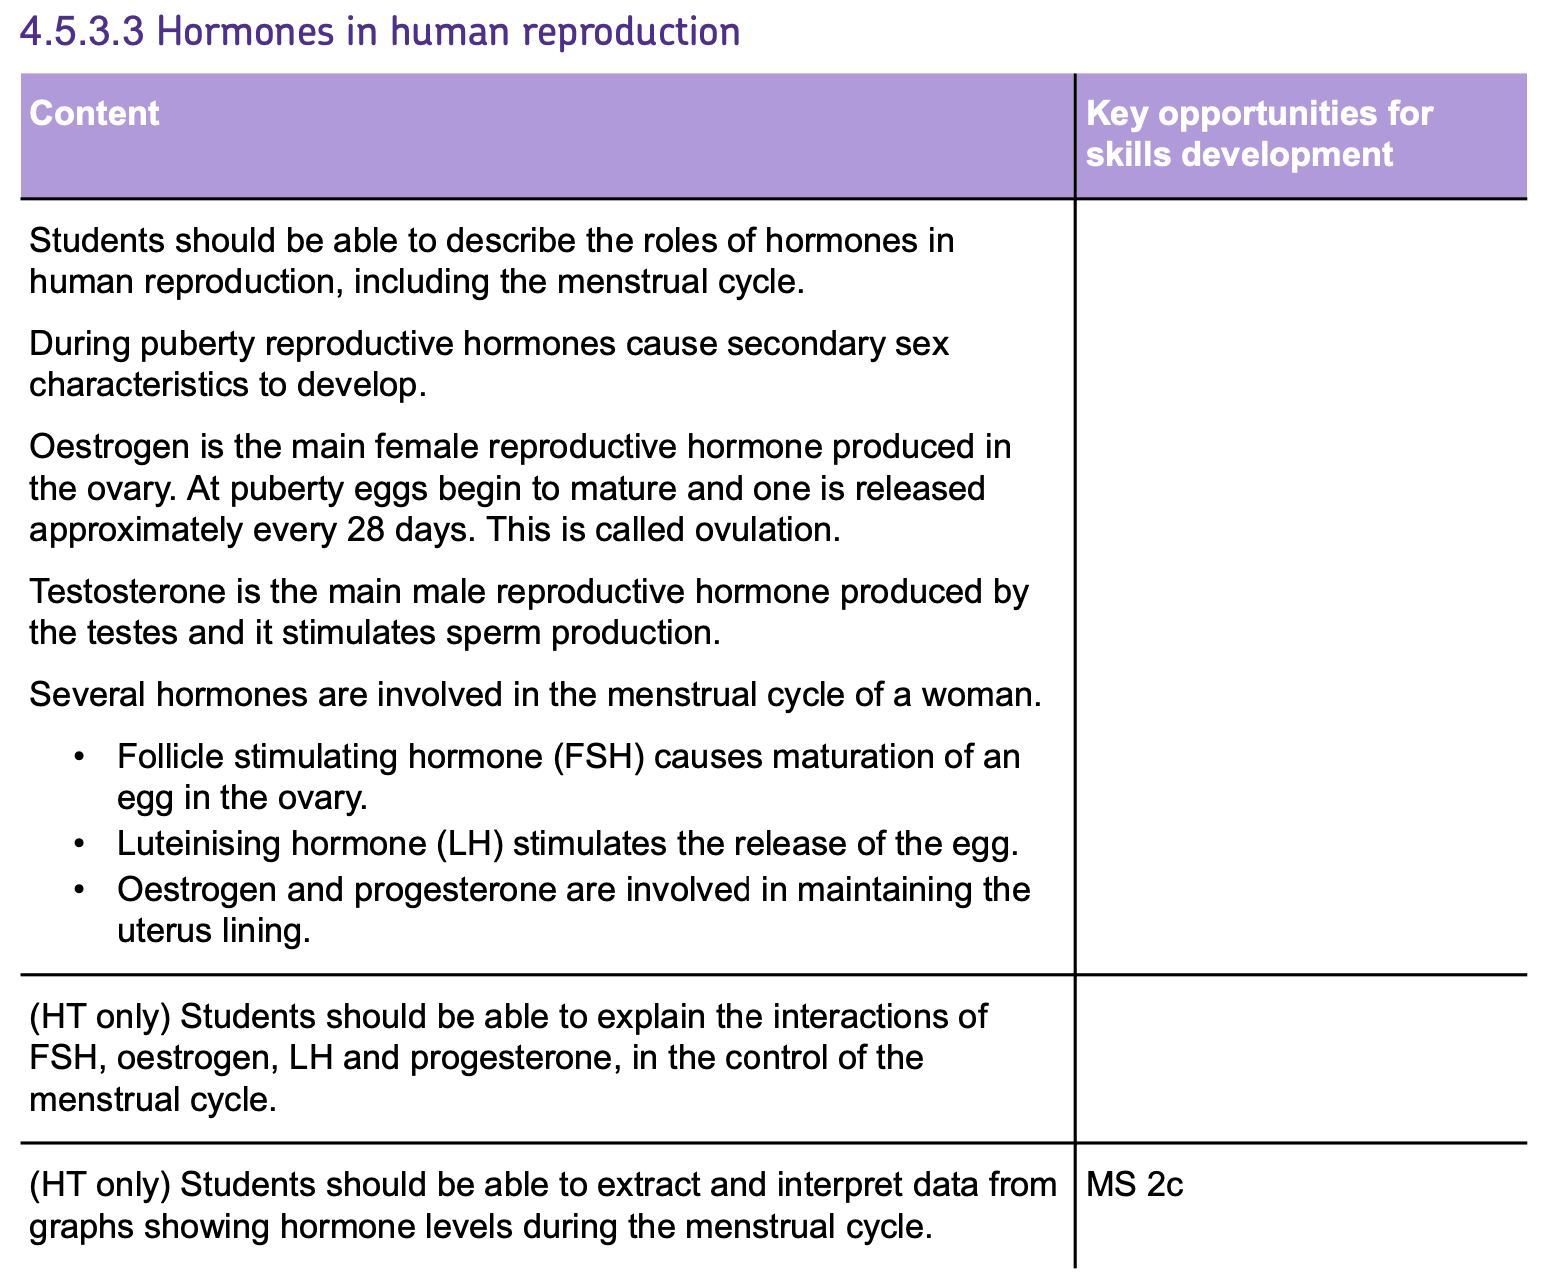
Contraception and Treating Infertility
Contraception
Contraception methods are ways to reduce fertility and PREVENT PREGNANCY.

1. HORMONAL METHODS TO REDUCE FERTILITY
These methods use the hormones OESTROGEN AND PROGESTERONE to REDUCE fertility.
If OESTROGEN levels REMAIN HIGH in a woman all the time, it INHIBITS the release of FSH, which will stop the egg from developing and releasing.
If PROGESTERONE levels stay HIGH, it causes the cervix (the opening of the uterus) to produce THICK MUCUS, which stops any sperm from passing through into the uterus.
Here are examples of HORMONAL contraception methods:
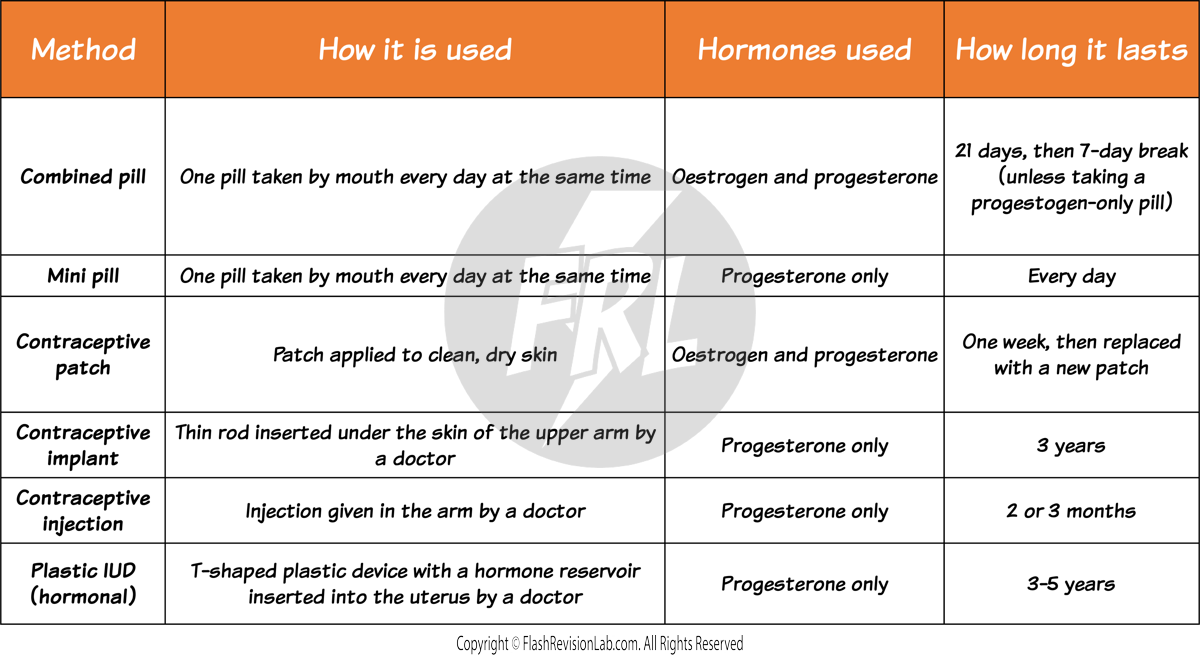
2. NON-HORMONAL METHODS TO PREVENT PREGNANCY
These work by preventing the sperm from reaching the egg and avoiding fertilisation.
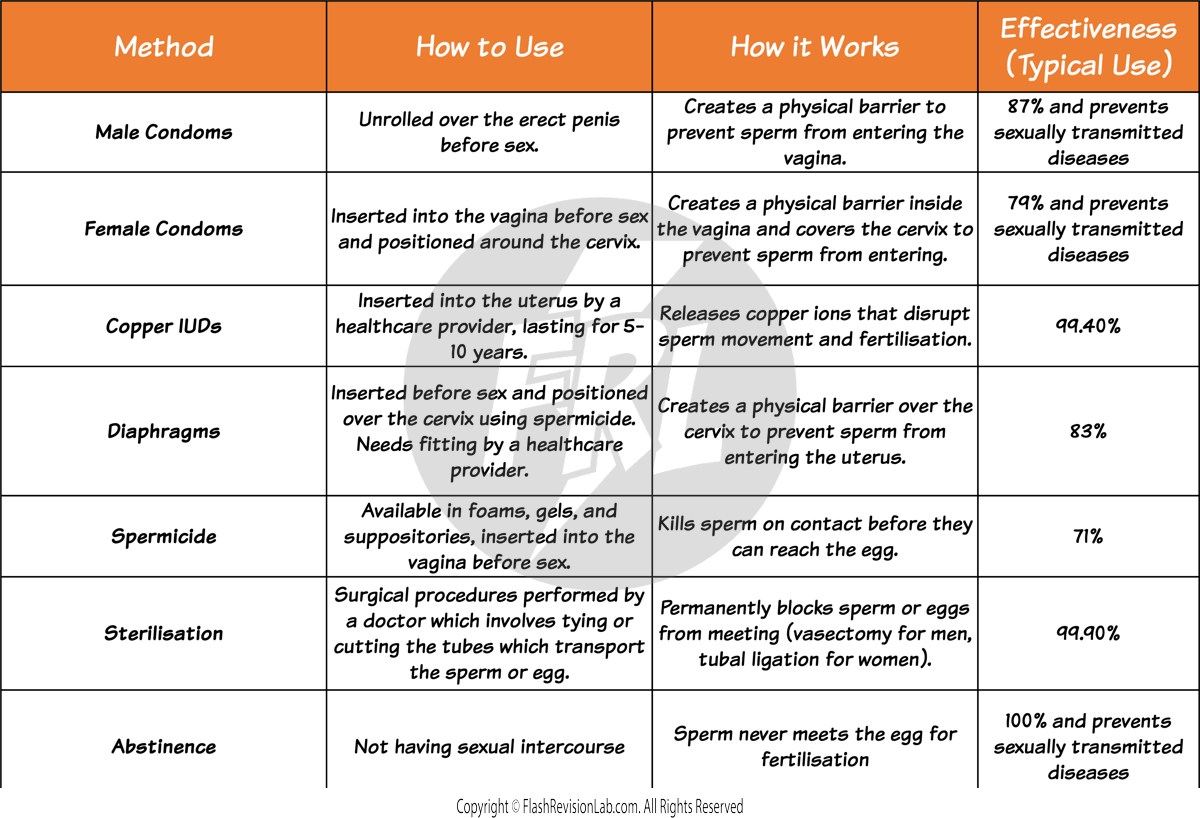
** You don’t need to memorise these percentages, they are there to give a comparison of the effectiveness of each.
INCREASING FERTILITY
These are methods used to increase the chances of women with fertility issues to have babies.
1. FERTILITY DRUG
Some women may find it difficult to get pregnant due to having LOW levels of FSH which means that eggs do NOT get released from the ovaries.
This can be treated with a FERTILITY DRUG, containing the hormones FSH and LH which can help to STIMULATE OVULATION.
This helps women to become pregnant in the normal way, however it can require multiple attempts to become successful. This can become expensive.
It can also result in unexpected MULTIPLE PREGNANCIES (twins and triplets) due to too many eggs being stimulated.
2. IN VITRO FERTILISATION (IVF):
A process where eggs are collected from a woman's ovaries and fertilised with sperm in a LAB.
The process starts with HORMONE TREATMENT where drugs containing FSH and LH are given to the woman to stimulate the maturation of SEVERAL EGGS.
The eggs are COLLECTED from the mother and a single sperm is injected directly into an egg using an INTRACYTOPLASMIC SPERM INJECTION (ICSI) in a lab.
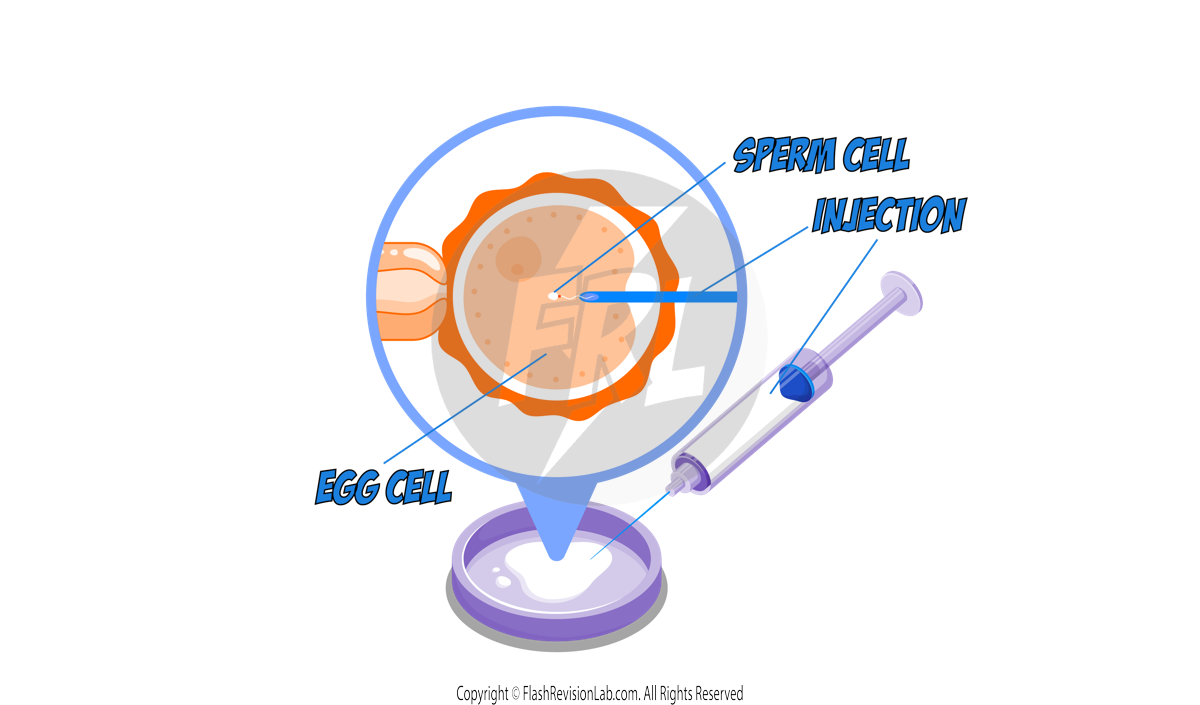
The fertilised eggs then DEVELOP into EMBRYOS and when they are tiny balls of cells, one or two embryos are inserted into the mother’s uterus to increase the chances of pregnancy.

CONSIDERATIONS for IVF
Although fertility treatment gives a woman the chance to have a baby of her own, it can come with some disadvantages:
- The process is very EMOTIONALLY and PHYSICALLY STRESSFUL.
- These are complex procedures with LOW SUCCESS RATES.
- There is a potential for MULTIPLE BIRTHS, which have their own risks to both the mother and the babies (such as miscarriage).
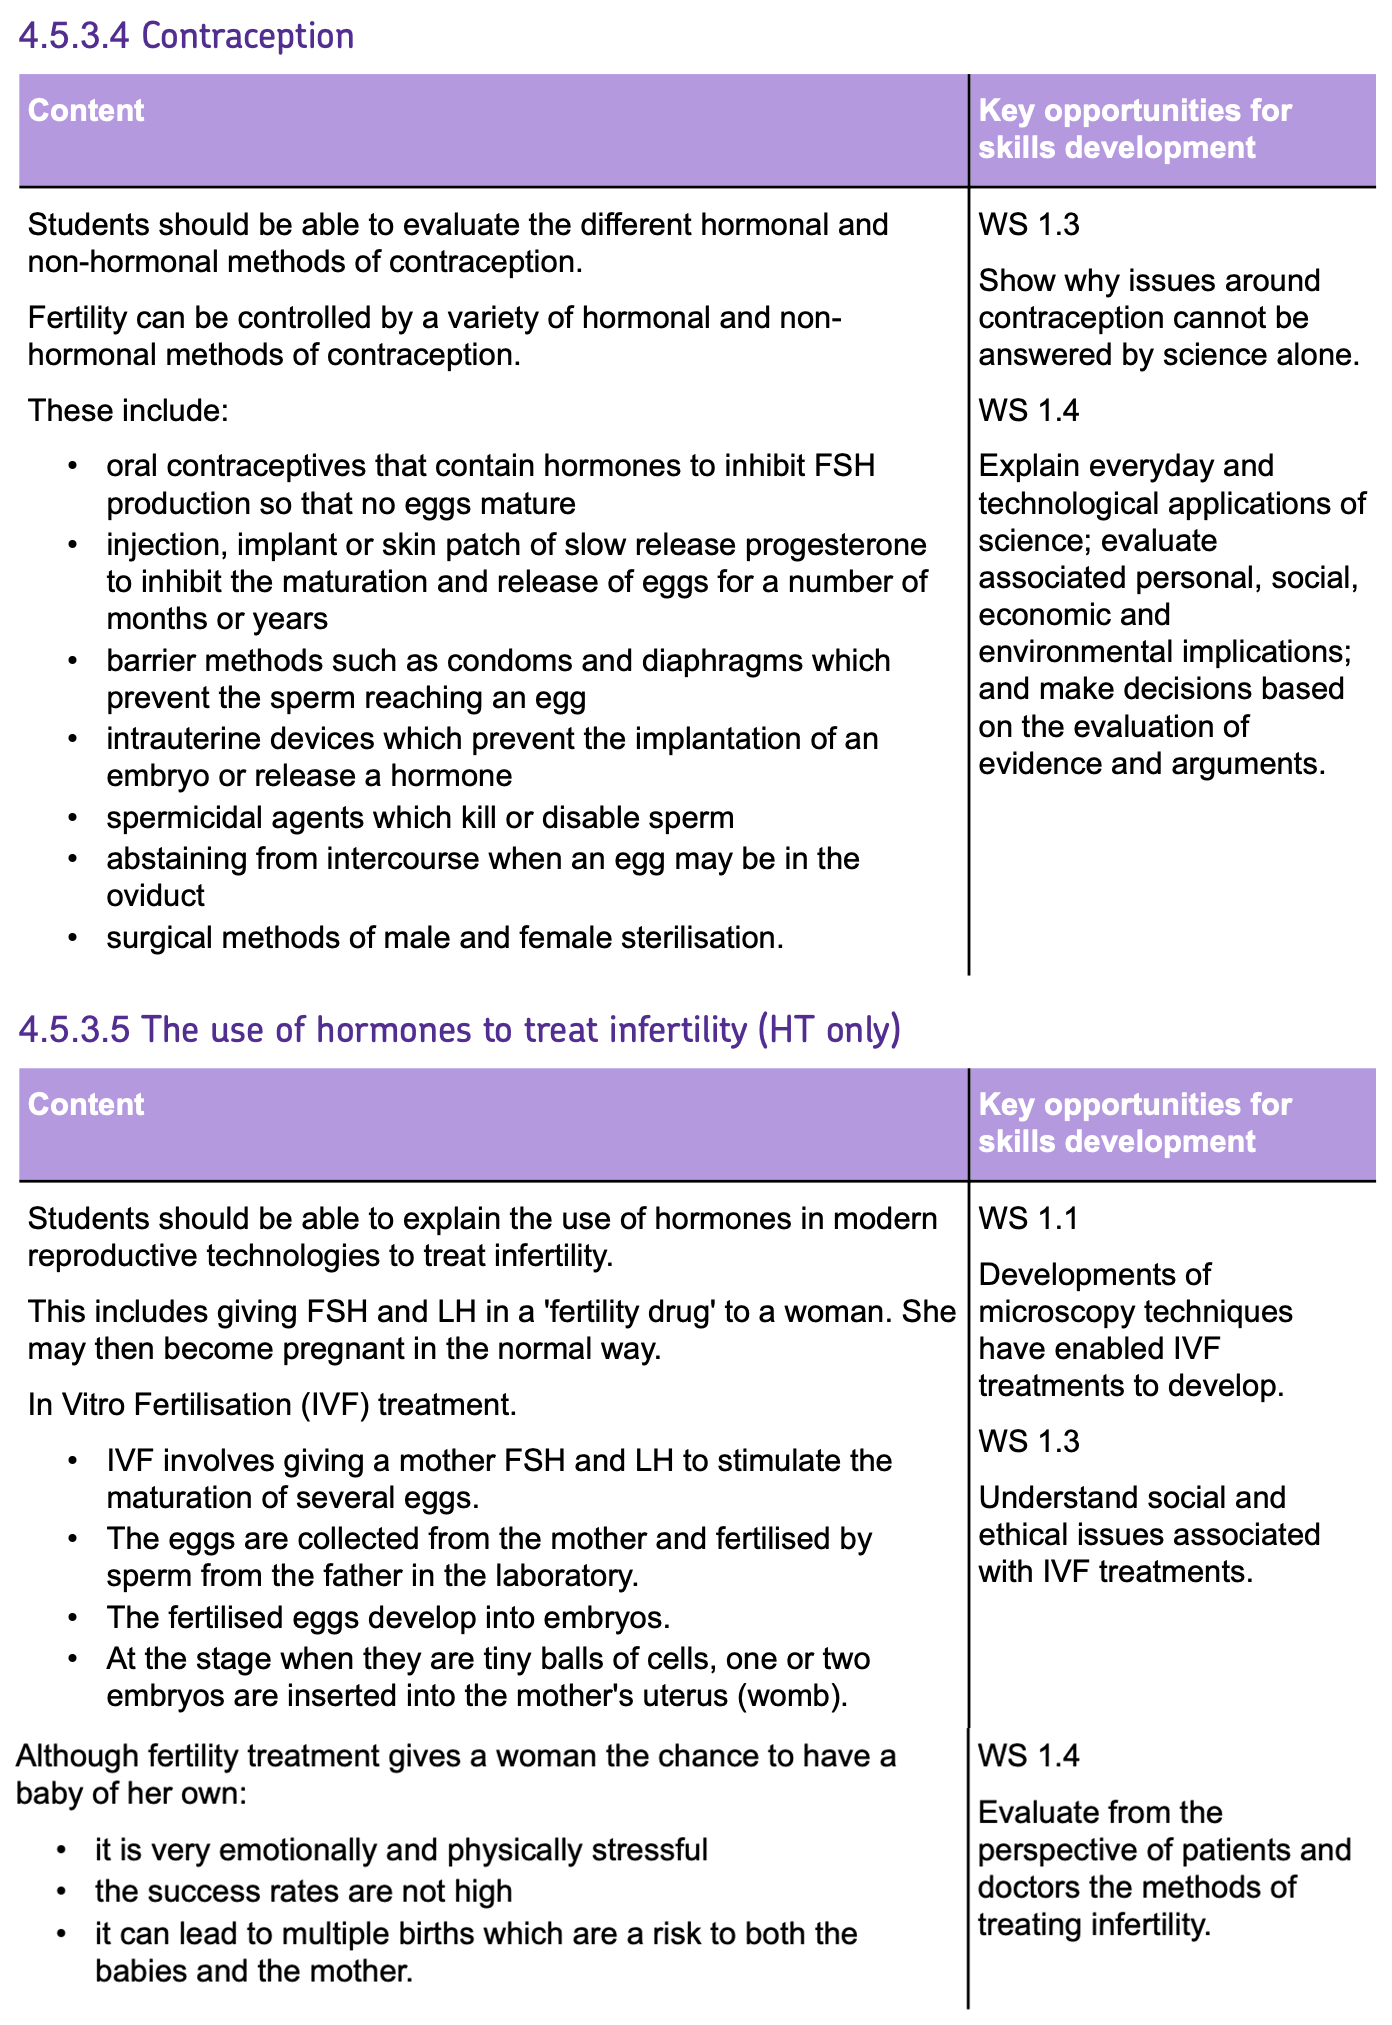
Sexual and Asexual Reproduction
SEXUAL REPRODUCTION
- SEXUAL REPRODUCTION involves TWO parents (a FATHER and a MOTHER) combining their genetic material to produce offspring with GENETICALLY DIFFERENT cells from themselves.
- Each parent contributes GAMETES (Sex Cells) .
- ANIMAL gametes are SPERM and EGG cells.
- Gametes in FLOWERING PLANTS are POLLEN and EGG cells.
- Gametes are FORMED through a process called MEIOSIS.
- Human gametes carry 23 CHROMOSOMES each, HALF the number found in normal body cells.
- When an egg and a sperm combine during FERTILISATION, the resulting fertilised egg (called a zygote), has the FULL set of chromosomes: half from each parent.
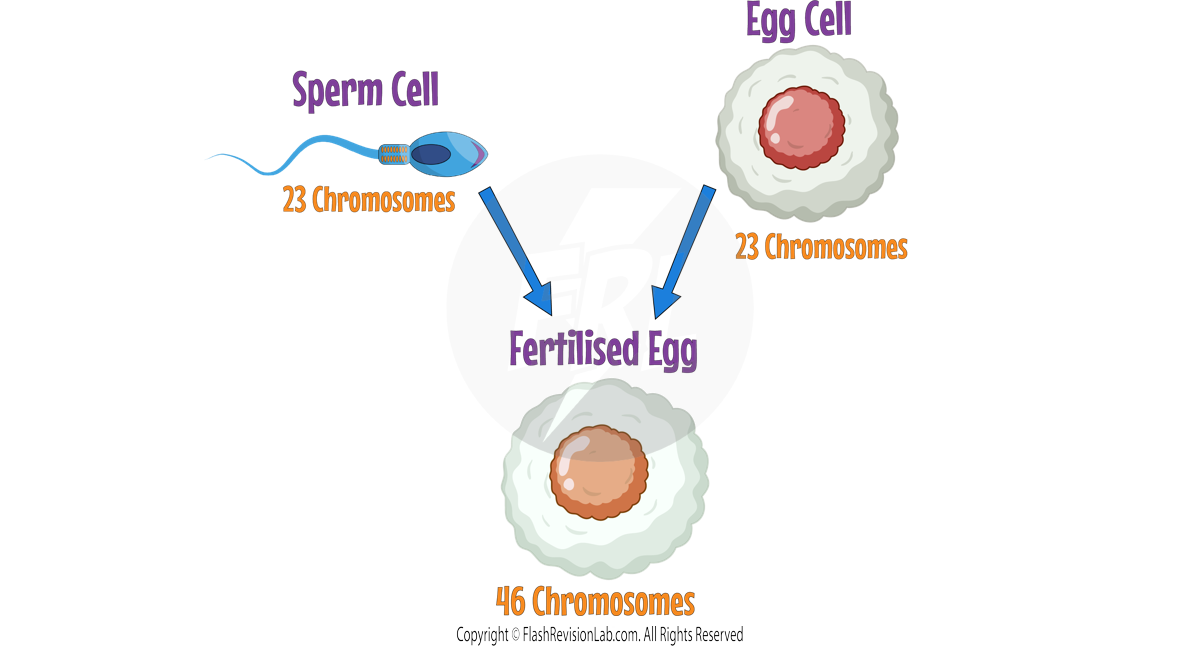
- This process results in offspring inheriting a MIXTURE OF CHROMOSOMES and therefore a mix of features from both parents, introducing GENETIC VARIATION.
ASEXUAL REPRODUCTION
- ASEXUAL REPRODUCTION involves only ONE parent, leading to offspring that are GENETICALLY IDENTICAL to that parent, known as CLONES.
- It occurs through MITOSIS, where an ordinary cell divides to form two new cells with the same genetic makeup.
- In asexual reproduction, there is NO FUSION OF GAMETES and NO MIXING OF CHROMOSOMES which means there is NO GENETIC VARIATION between the parent and offspring.
COMPARISON BETWEEN SEXUAL AND ASEXUAL REPRODUCTION
- SEXUAL REPRODUCTION introduces VARIATION and can occur in many organisms, including animals and flowering plants, which use pollen as a form of sperm.
- ASEXUAL REPRODUCTION can be seen in bacteria and some plants, where it serves as a RAPID and EFFICIENT means of increasing population numbers.
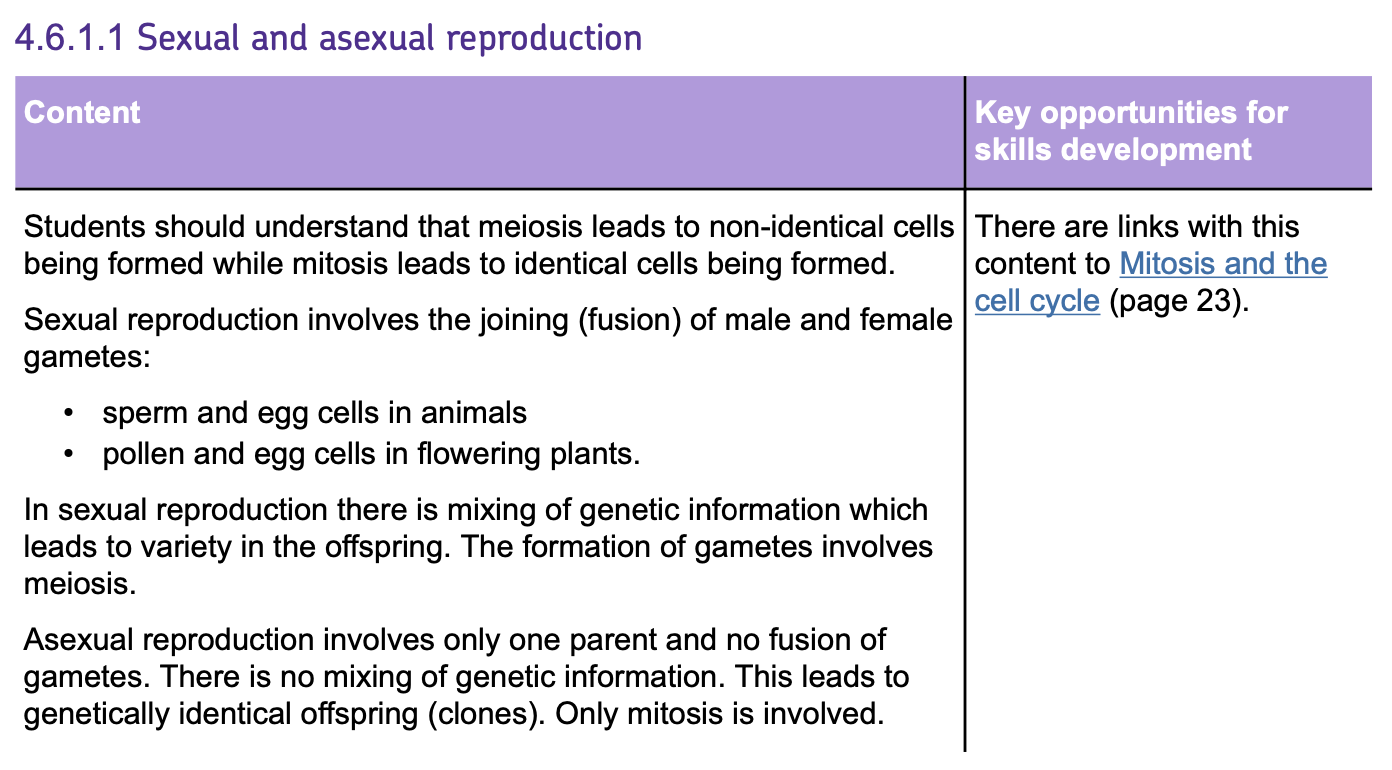
Meiosis
- MEIOSIS is a type of cell division that reduces the chromosome number by HALF
- It is used for the PRODUCTION of GAMETES—sperm in males and eggs in females.
- It consists of TWO CELL DIVISIONS and results in FOUR GENETICALLY DIFFERENT GAMETES.
- Each gamete produced (daughter cells) contain HALF the usual number found in body cells.
STEPS OF MEIOSIS
1. Duplication of Chromosomes:

Each cell prepares for meiosis by duplicating its genetic material to form 92 CHROMOSOMES.
2. First Division:
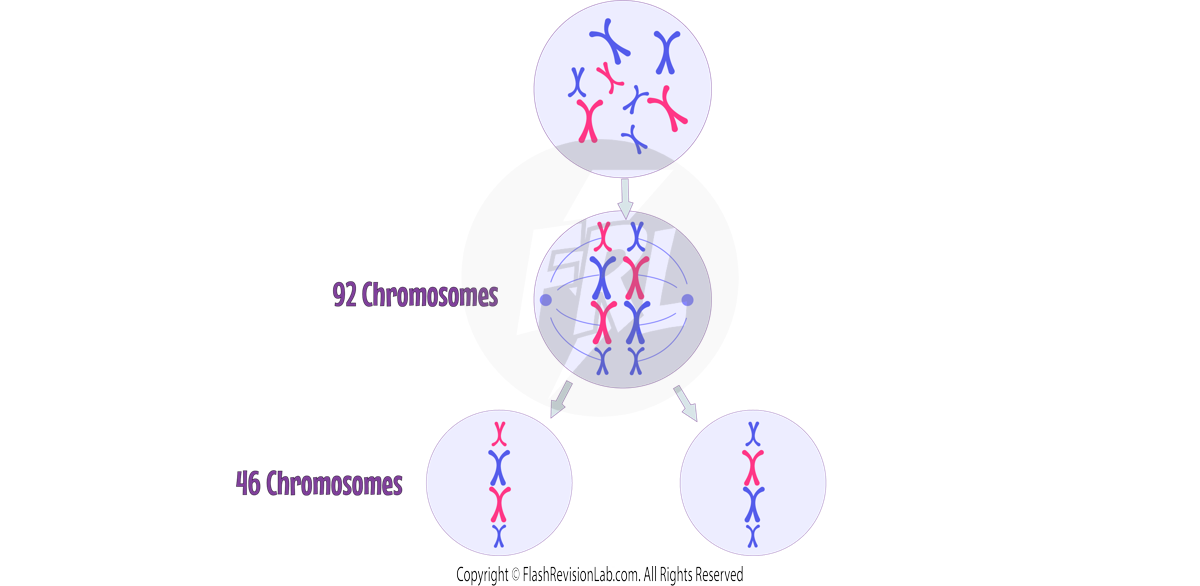
- The 92 chromosomes pair up in the MIDDLE of the cell.
- The paired chromosomes are separated and PULLED APART to opposite poles of the cell by cell fibres.
- The cell SPLITS in two, reducing the chromosome number by HALF to 46.
3. Second Division:
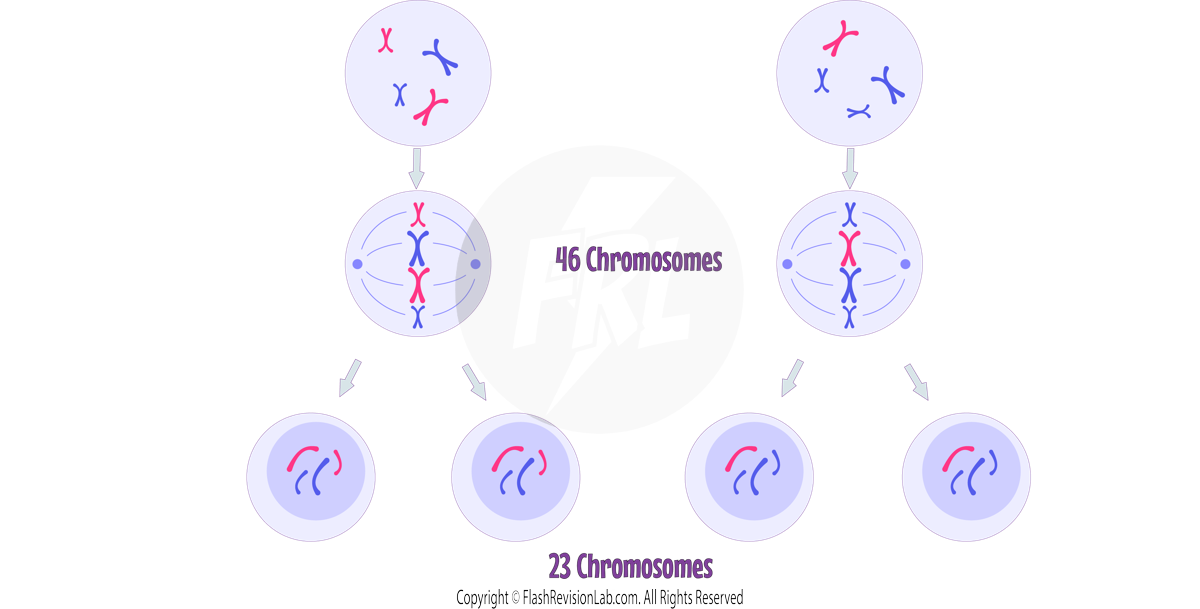
- The chromosomes of each of the new cells then line up in the middle of the cell again.
- Cell fibres pull each half of the X-SHAPED CHROMOSOMES to opposite poles of the cells.
- Both cells SPLIT again to form a total of 4 DAUGHTER CELLS which are GENETICALLY DIFFERENT and contain HALF the number of chromosomes (23).
SIGNIFICANCE OF MEIOSIS IN GENETIC DIVERSITY
- Meiosis creates GENETIC VARIATION in organisms.
- This is because the CHROMSOMES from the mother are father are distributed RANDOMLY before the divisions, which results in all four daughter cell being different to each other.
- This in turn means that the SPERM CELLS and EGG CELLS in a human all have DIFFERENT genetic material, so when the sperm and egg fuse to make an offspring, it will also be genetically different to its parents.
- After FERTILISATION, when two gametes fuse, the NORMAL number of 46 CHROMOSOMES is restored in the resulting fertilised egg.
- After this stage, the new cell then undergoes numerous rounds of MITOSIS to form an EMBRYO.
- These divisions by MITOSIS allow the embryo to grow and cells to DIFFERENTIATE into various specialised cells, forming the complete organism.
Here is a comparison of MITOSIS (division of body cells) and MEISOS (division of gametes):
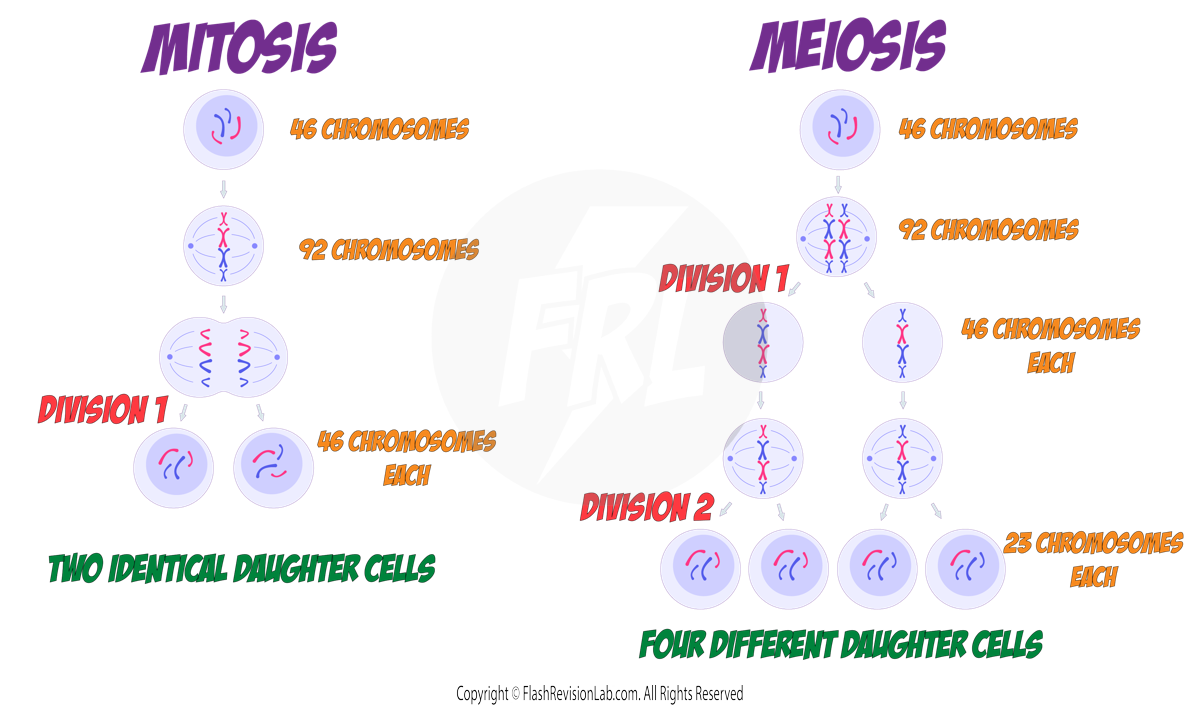
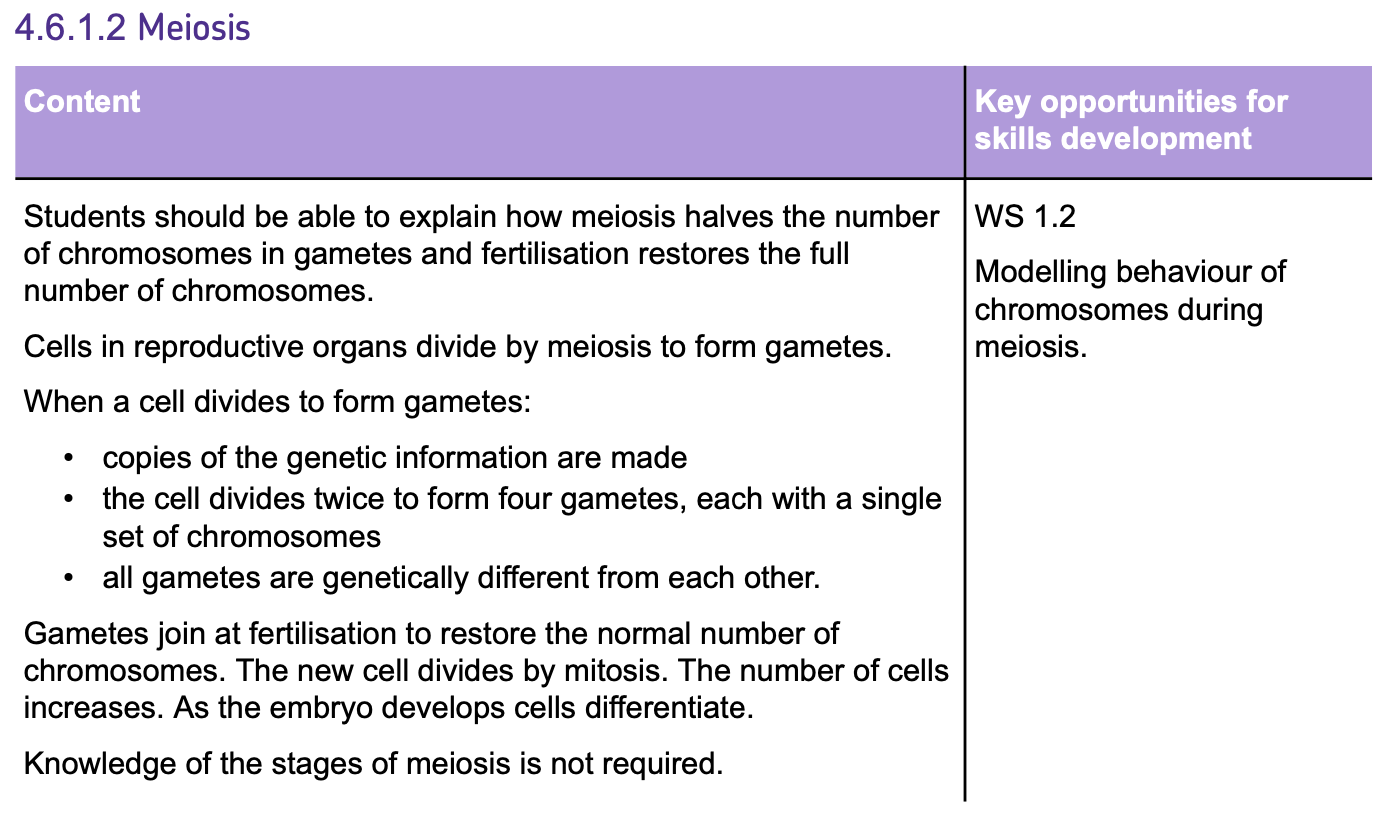
DNA and the Genome
DNA
- DNA stands for DEOXYRIBONUCLEIC ACID, and it carries all the GENETIC MATERIAL of an organism.
- It's made up of CODED INFORMATION that acts as instructions for building and maintaining an organism.
All the genetic material of an animal is found in the NUCLEUS and is organised into structures called CHROMOSOMES.
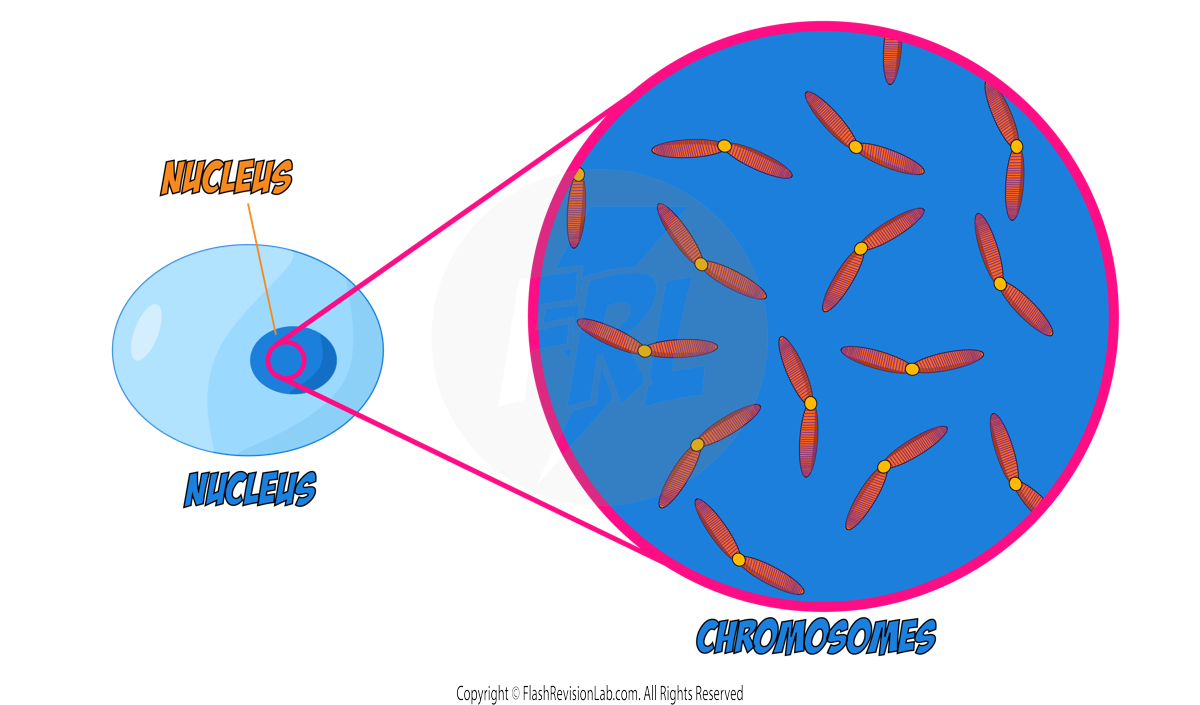
The chromosomes are made up of strands of DNA which are COILED UP when they prepare to divide.
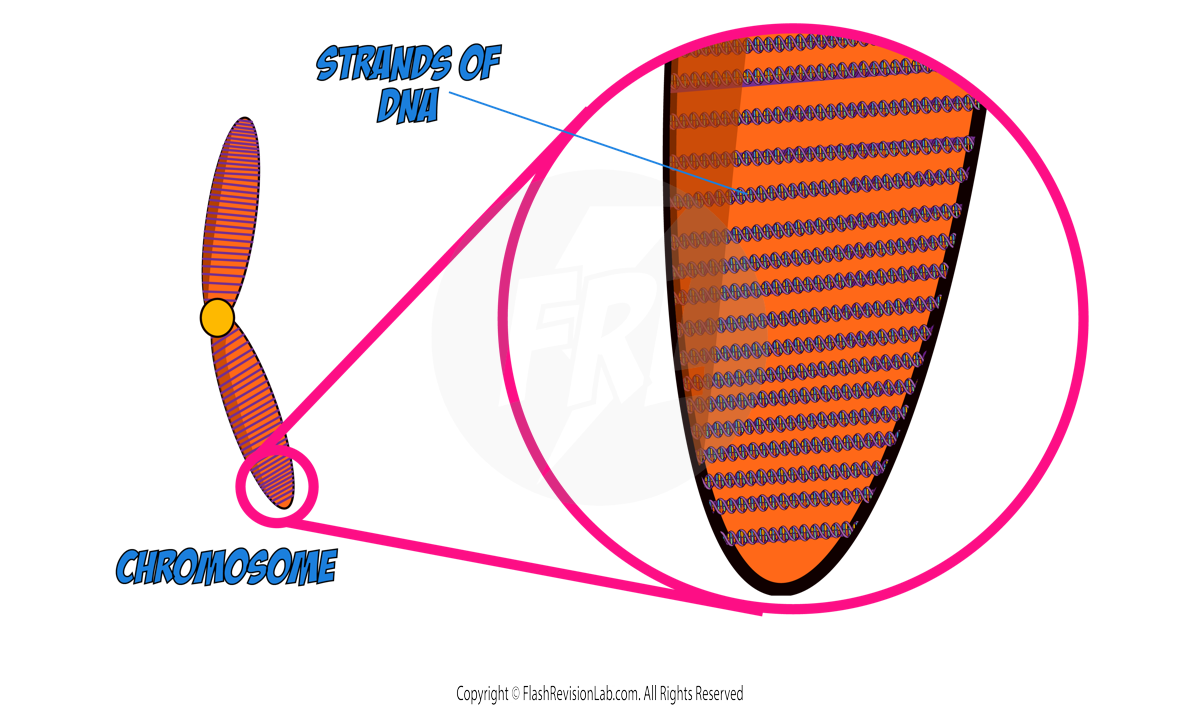
The DNA is made of two strands that coil into a shape known as a DOUBLE HELIX.
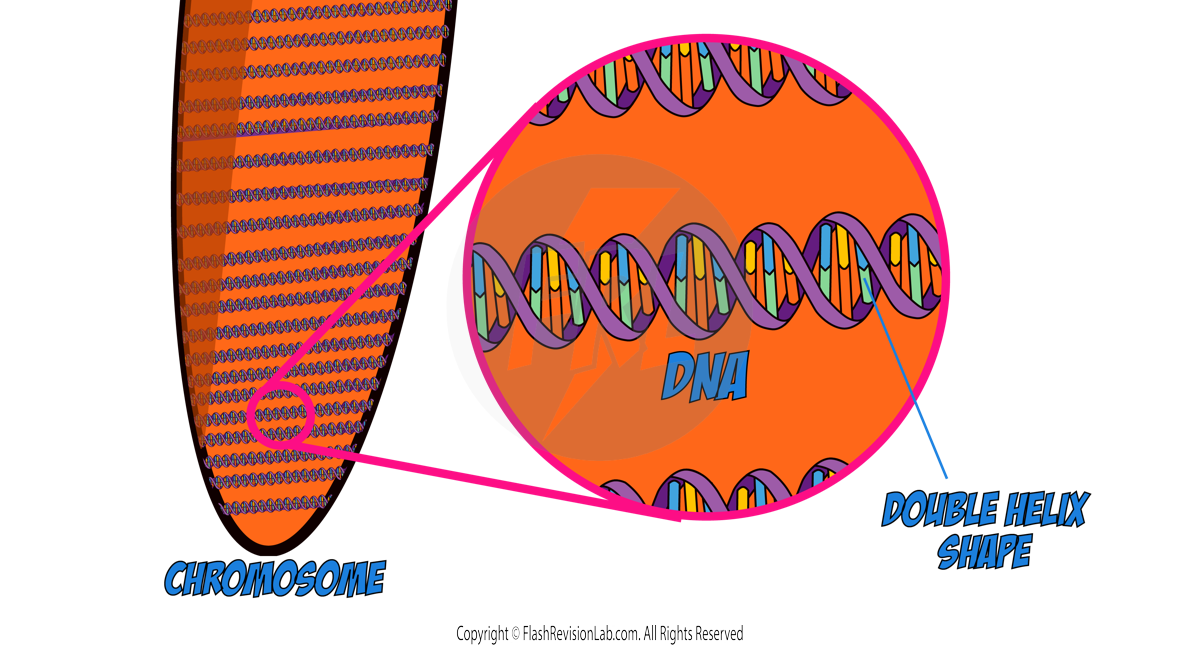
DNA is a POLYMER which means it is a LONG CHAIN made up of many REPEATING UNITS known a MONOMERS.
The CODED INFORMATION in DNA is used in MAKING PROTEINS (protein synthesis) by joining AMINO ACIDS together.
To make different proteins, the amino acids need to join in a PARTICULAR ORDER – the information in the DNA instructs the cell to join the amino acids together in the CORRECT ORDER to make the CORRECT PROTEIN.
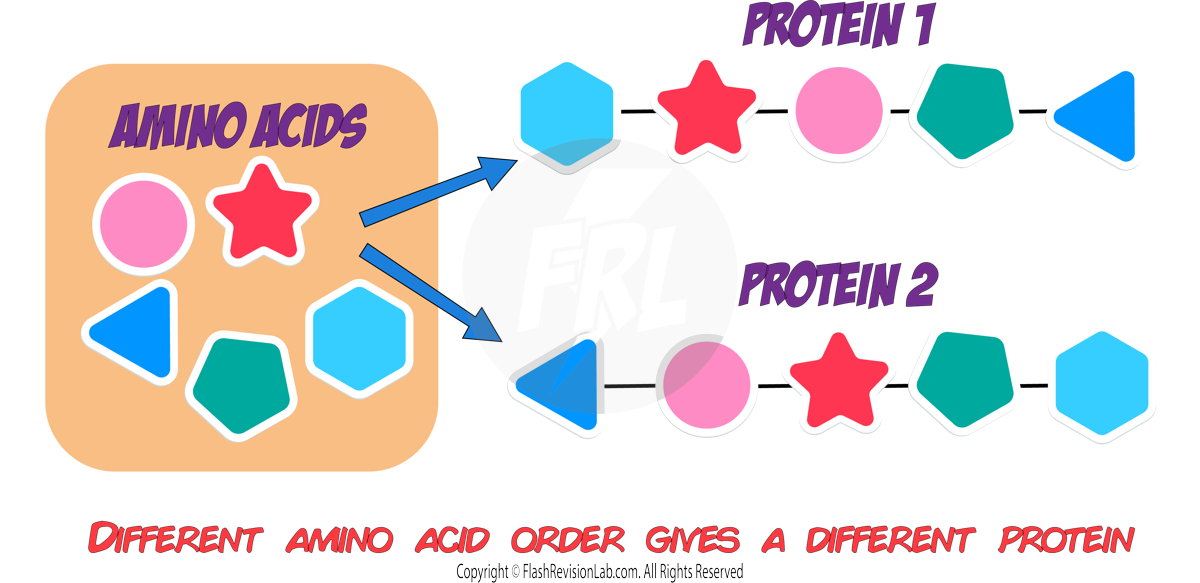
GENES:
- A GENE is a small section of DNA found on a chromosome and is responsible for coding a specific PROTEIN.
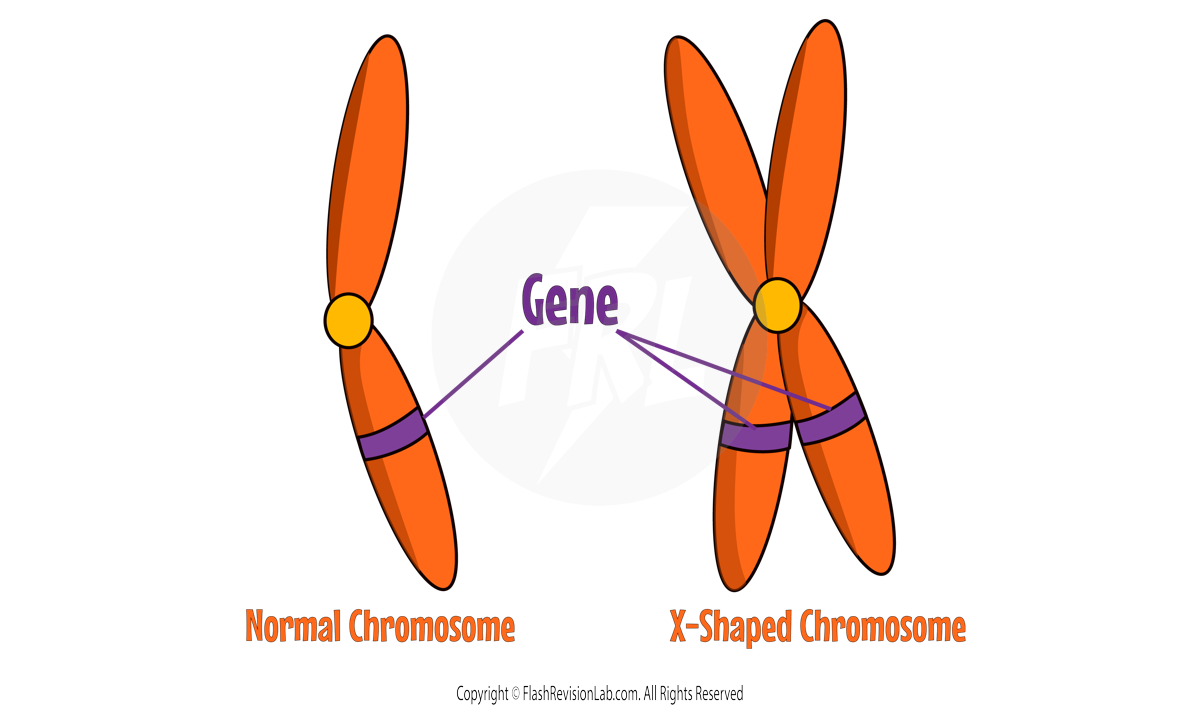
- Each gene codes for a particular SEQUENCE OF AMINO ACIDS to create SPECIFIC proteins.
- These proteins perform various functions in the body, and give each person their CHARACTERISTICS.
- The proteins produced, determine the TYPE OF CELL.
GENOMES
The GENOME is the ENTIRE GENETIC MATERIAL of an organism.
The HUMAN GENOME has now been fully studied which will have great importance for science and medicine in the future.
For example:
1. Finding Genes for DISEASES
- Some diseases are caused by particular genes.
- By understanding the human genome, scientists have been able to identify which genes are responsible different diseases.
2. Understanding and Treating INHERITED DISEASES
- Inherited diseases are diseases that are PASSED DOWN from parents through GENES.
- By knowing how different genes are linked to different inherited diseases, scientists can come up with effective treatments for the diseases.
3. Tracing human MIGRATION PATTERNS
- GENOMES provide a historical record that allows scientists to trace the MIGRATION of human populations across the globe.
- All modern humans have a COMMON ANCESTOR from Africa, which is where the species originated.
- As humans spread ALL OVER THE PLANET, the human genome remained mostly IDENTICAL across individuals.
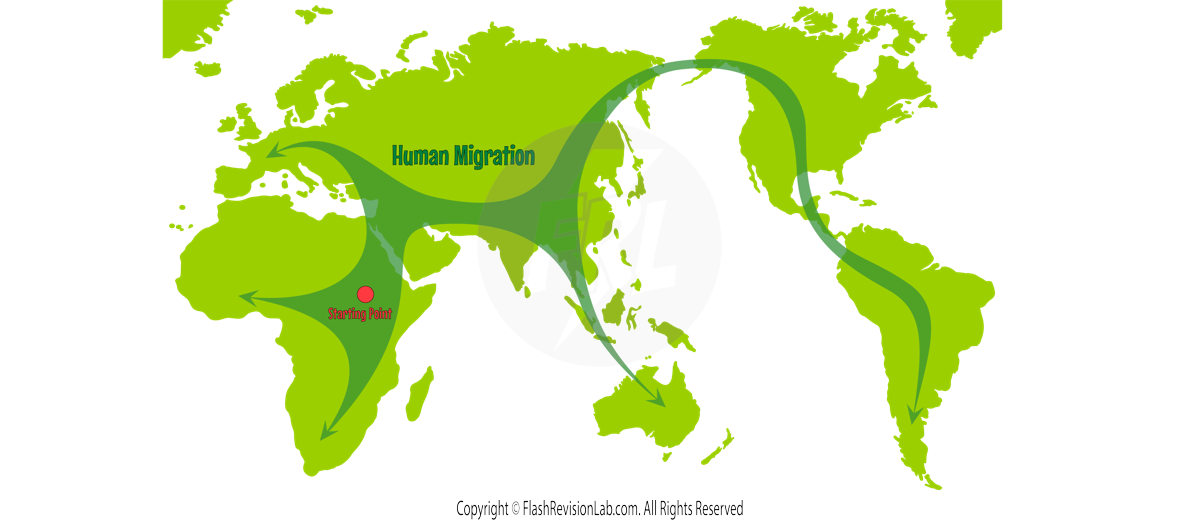
- However, as different populations migrated from Africa, they developed TINY DIFFERENCES in their genomes.
- By INVESTIGATING these genomic differences, scientists can determine when new populations branched off and the ROUTES they took around the world during migration.
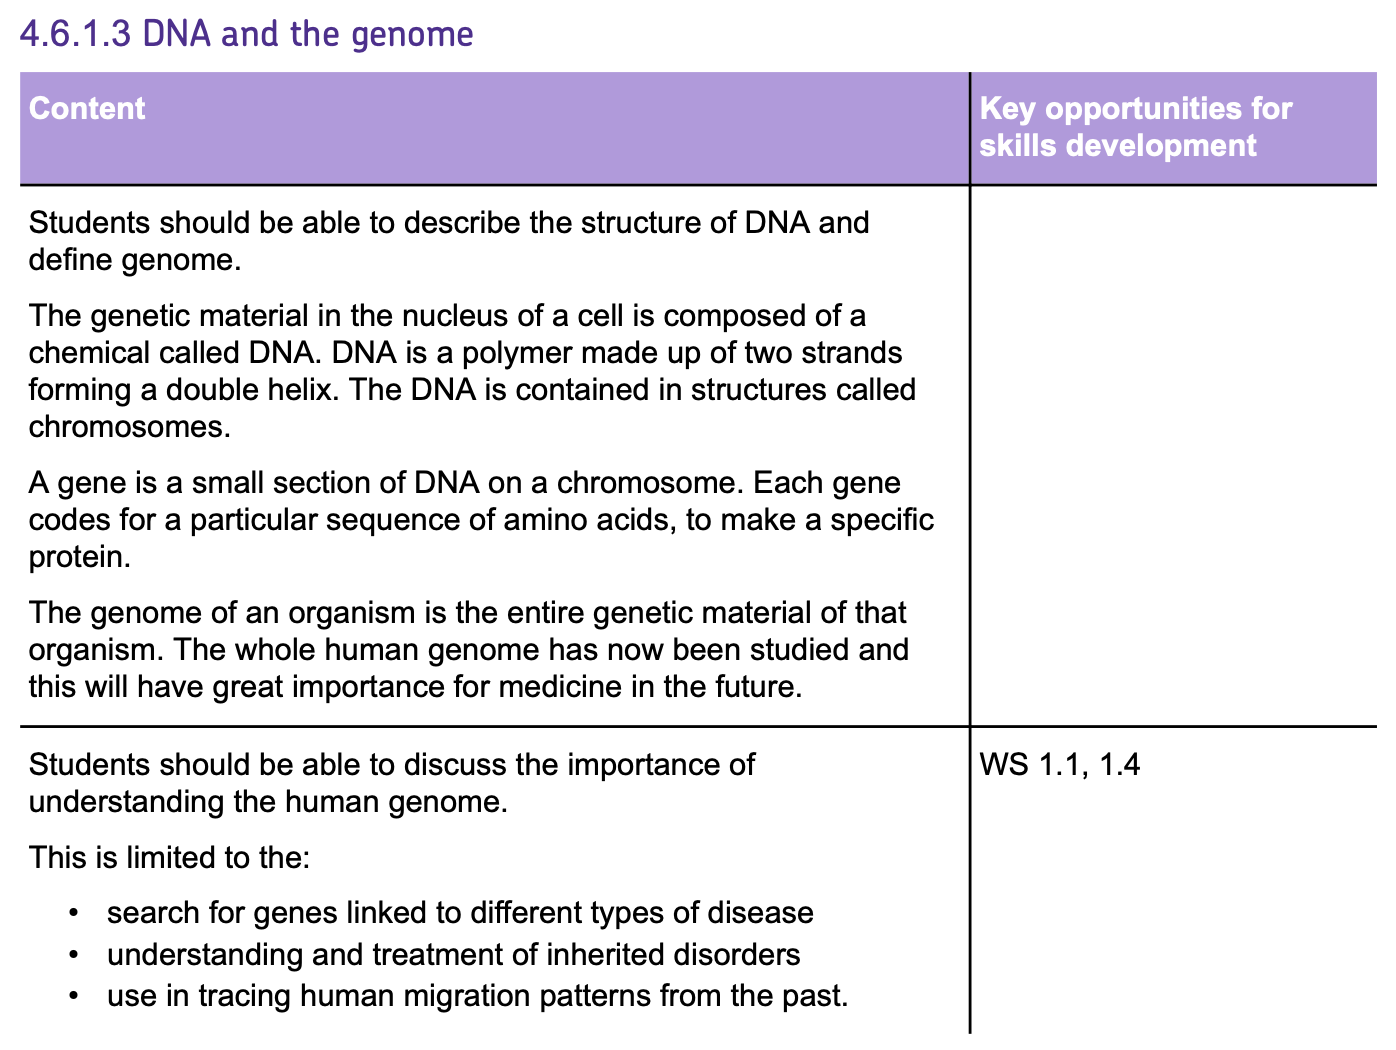
Genetic Inheritance
KEY CONCEPTS IN GENETIC DIAGRAMS
GAMETES:
These are SEX CELLS, and in humans can be a SPERM or EGG cell

CHROMOSOMES:
Chromosome are COILED UP structures of DNA strands and humans have 46 in total (23 Pairs)
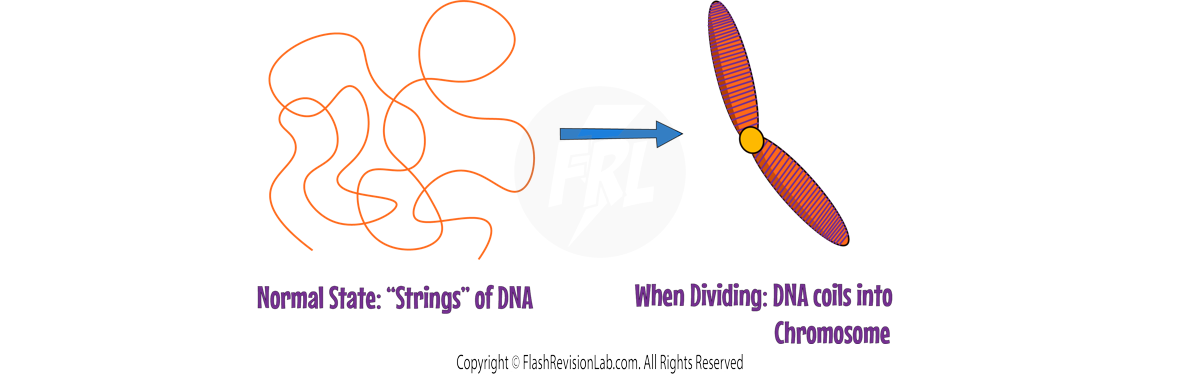
GENES:
- A GENE is a small section of DNA which codes for a SPECIFIC PROTEIN and is responsible for different traits.
- Some characteristics are controlled by a SINGLE gene, such as: fur colour in mice; and red-green colour blindness in humans. However MOST characteristics are a result of MULTIPLE genes interacting, rather than a single gene.
ALLELES:
- Alleles are DIFFERENT forms of a particular gene. E.g. The “eye colour” gene can have two alleles – the brown eyed allele and the blue eye allele.
- Alleles exist as PAIRS where each individual inherits one allele from EACH PARENT.
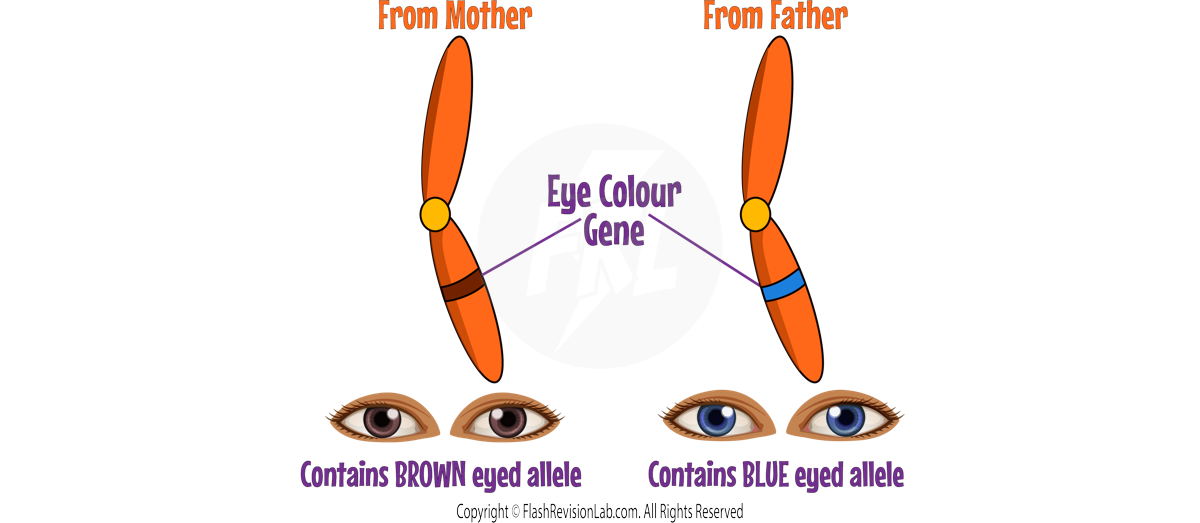
However, the alleles in a pair can’t both express their traits in an individual (e.g. A person either has brown eyes OR blue eyes- NOT both)
This means that some alleles are “more dominant” than others and are more likely to express themselves over others.
E.g. The brown eyed gene is MORE DOMINANT than the blue eyed gene, so if a person had both alleles present in their DNA, they would end up with BROWN EYES.
DOMINANT ALLELE:
A DOMINANT ALLELE is an allele that ALWAYS expresses itself even if only one is present
These are denoted with CAPITAL LETTERS.
E.g. B could represent BROWN EYES as it is DOMINANT.
RECESSIVE ALLELE:
These are only expressed when BOTH ALLELES in the pair are RECESSIVE. That’s because they are “less dominant”
These are denoted with SMALL LOWERCASE LETTERS.
E.g. b could represent BLUE EYES as it is reccessive.
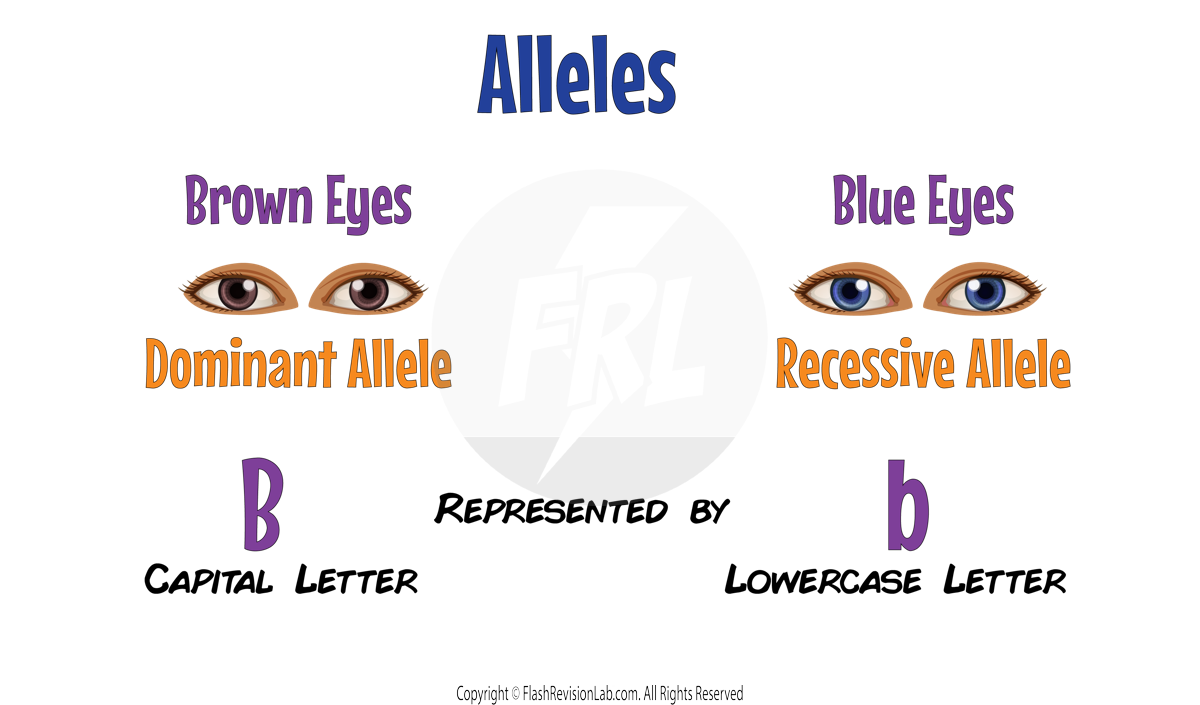
HOMOZYGOUS:
When both alleles in the pair are the SAME.
E.g. BB or bb

HETEROZYGOUS:
When both alleles in the pair are DIFFERENT.
Eg. Bb or bB
They always result in the DOMINANT gene being expressed

GENOTYPE:
These are the COMBINATION of alleles present in an organism.
PHENOTYPE:
These are the PHYSICAL CHARACTERISTICS expressed by an individual due to their genes.
The genotypes, operate at a molecular level to develop these characteristics.
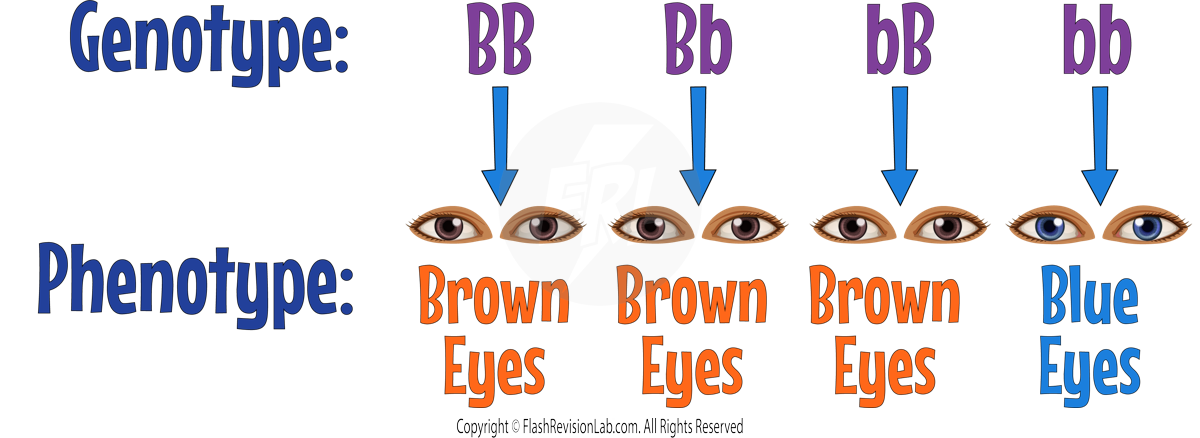
PUNNETT SQUARES AND GENETIC CROSS
GENETIC CROSSES involve finding out the genotypes and phenotype probabilities of OFFSPRING by knowing the parents’ genotypes.
PUNNETT SQUARES are tools used to predict the outcome of genetic crosses.
As an example, let’s use the brown and blue eyed alleles from before.
Let's say we have 2 HETEROZYGOUS PARENTS (Bb).
What is the probability that these parents will have a BLUE-EYED child?
We can start off by labelling the PARENTS’ phenotypes on the SIDES of a Punnett square.
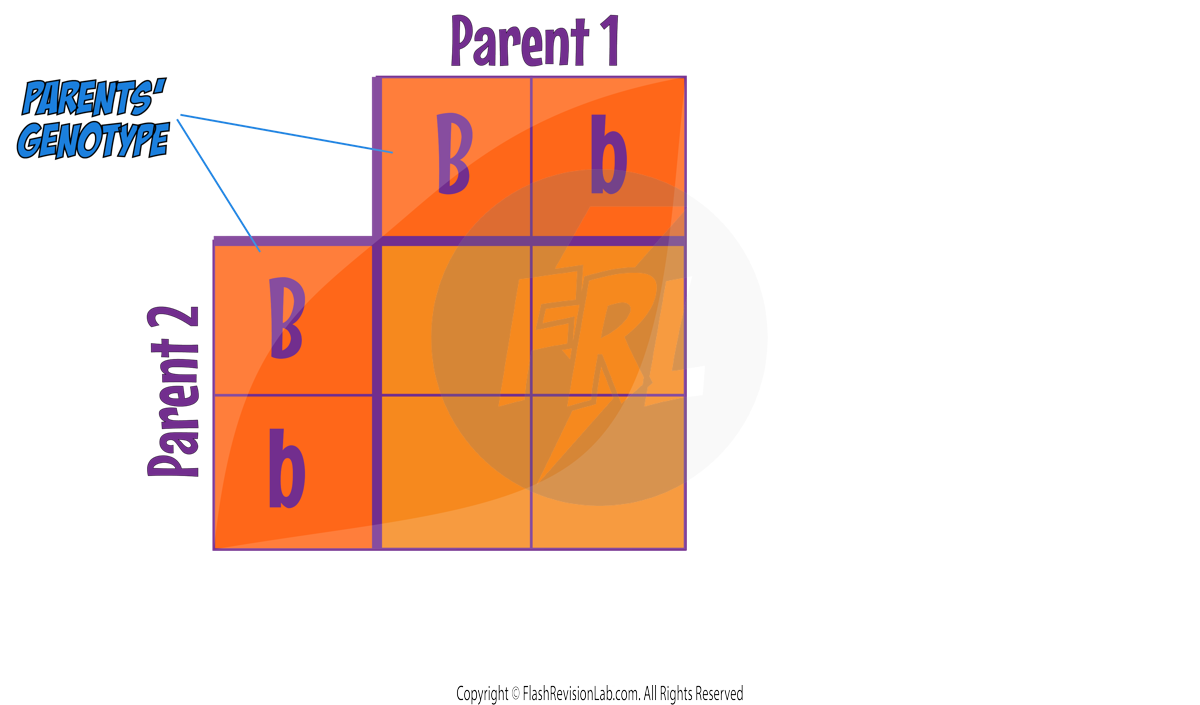
Both parents are HETEROZYGOUS, so we can label these as Bb.
Now we can label the 4 squares in the middle for the OFFSPRING. Just combine the alleles from the parents to get the GENOTYPE for each offspring.
You can now work out the probability by looking at the PHENOTYPES of each offspring.
The genotypes BB and Bb both show BROWN EYES as a dominant allele is present in both, and bb shows BLUE EYES as BOTH alleles are recessive.
You have ONE blue-eyed offspring and THREE brown-eyed offspring which gives a ratio of 1:3.
This also equates to a percentage of 25%.
This means that if the parents have a child, there is a 25% that the child will have BLUE EYES and a 75% that they will have BROWN EYES.
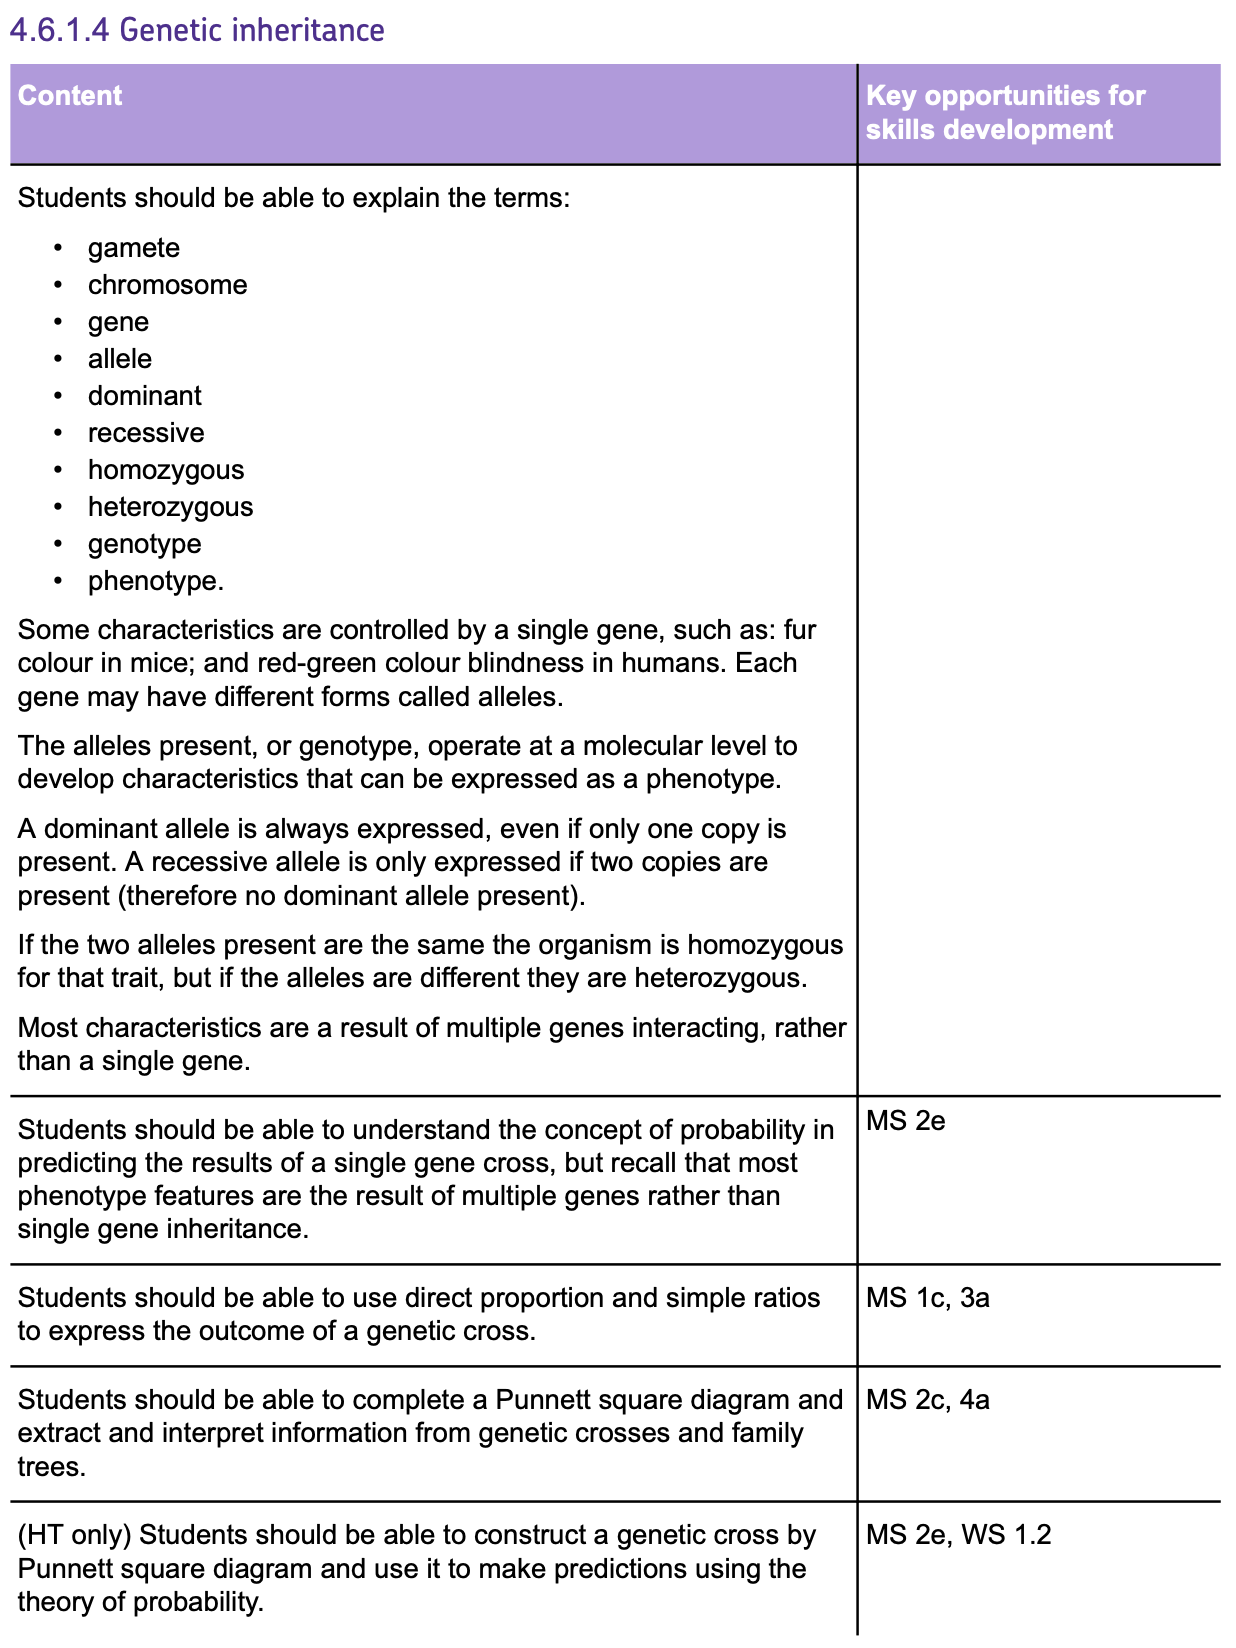
Inherited Disorders
INHERITED DISORDERS are diseases that are passed down from PARENTS through their GENES.
You can use PUNNETT SQUARES to predict the probabilities that an OFFSPRING will get an inherited disease, just like with other traits.
Here are two examples of INHERITED DISEASES:
1. CYSTIC FIBROSIS
- CYSTIC FIBROSIS is a genetic condition affecting the cell membranes, leading to the production of THICK AND STICKY MUCUS in the airways and pancreas.
- CYSTIC FIBROSIS is caused by a RECESSIVE ALLELE (f). This means the allele for NOT having cystic fibrosis is DOMINANT.
- CARRIERS: Individuals carrying ONE copy of a recessive allele of a DISEASES ('Ff') are known as CARRIERS.
- Because the disease is recessive, if a child only has ONE copy of the gene, they will NOT have cystic fibrosis. The DOMINANT gene will express itself instead.
- For a child to be affected by cystic fibrosis, they must inherit TWO recessive alleles ('ff'), making it necessary for both parents to be carriers or affected themselves.
Eg. One HOMOZYGOUS DOMINANT parent and one that HAS cystic fibrosis.
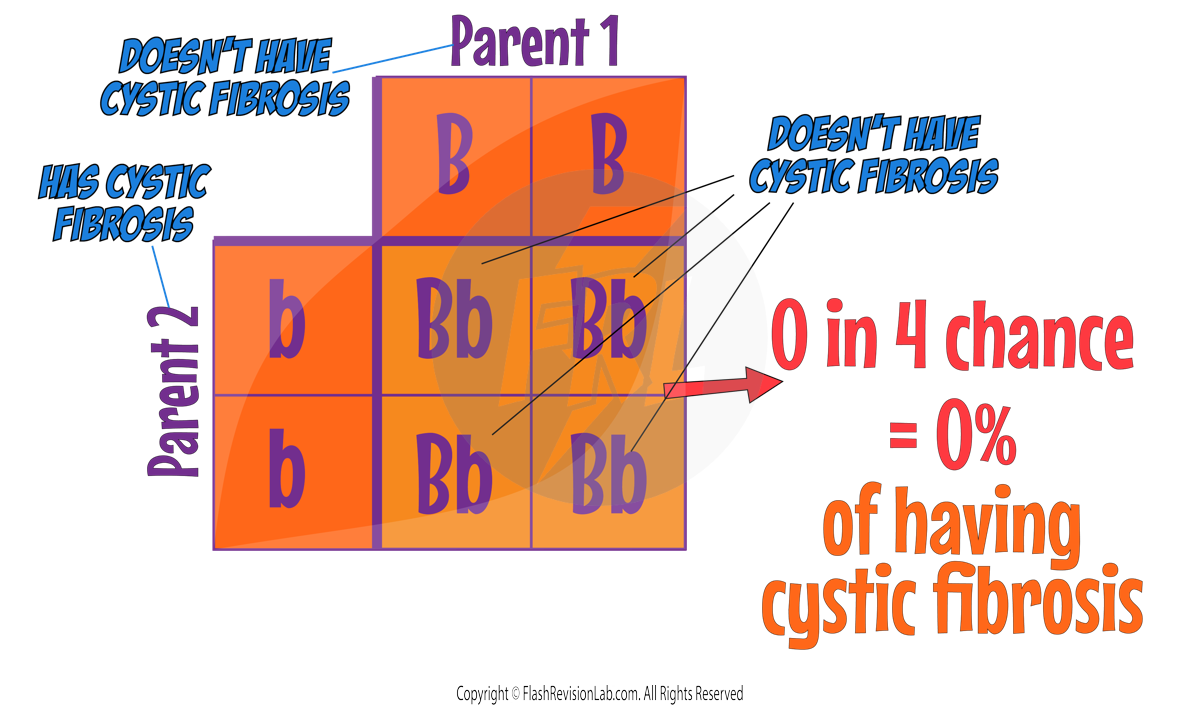
2. POLYDACTYLY
- POLYDACTYLY is a genetic condition where a child is born with EXTRA FINGERS OR TOES.
- POLYDACTYLY is caused by a DOMINANT ALLELE (D).
- Unlike recessive disorders, just one copy of the dominant allele ('Dd' or 'DD') will result in the phenotype being expressed.
- This means that it is NOT possible to be a CARRIER of a disease caused by a DOMINANT allele.
Eg. One HETEROZYGOUS parent WITH polydactyly and one WITHOUT POLYDACTYLY.
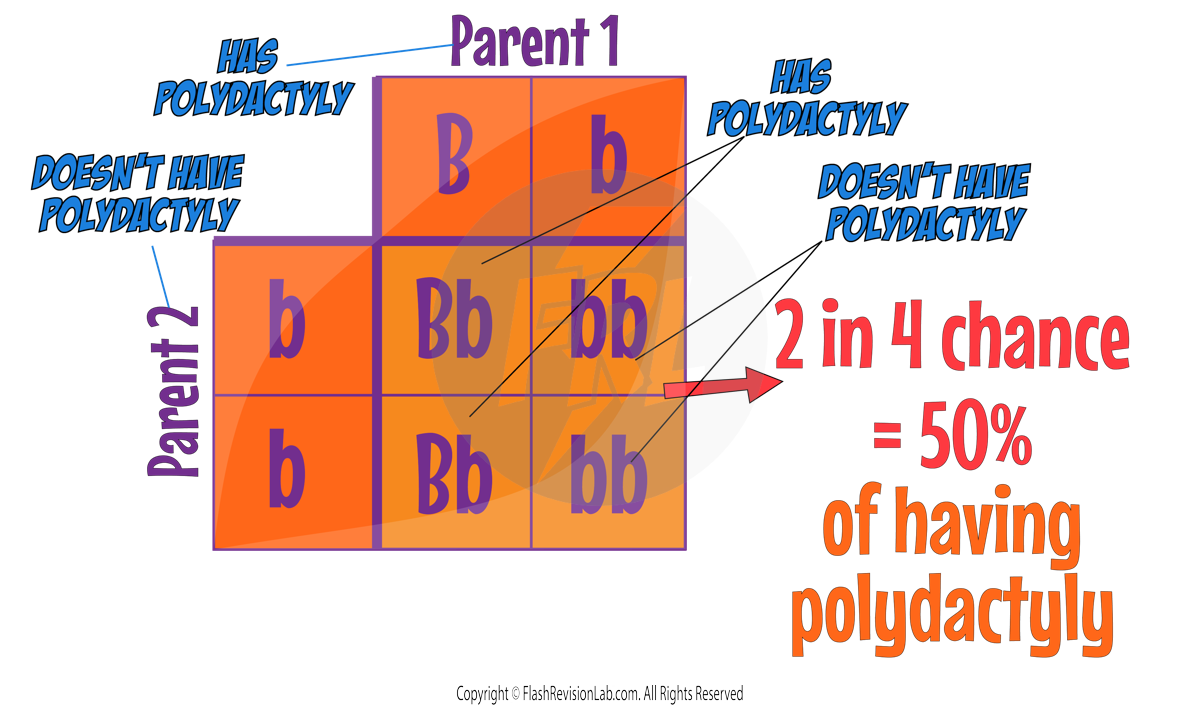
FAMILY TREES
Family trees can help TRACE inherited traits and diseases through generations and predict the likelihood of different family members inheriting certain alleles.
Different shapes and shading patterns are used to represent the gender and phenotypes of individuals.
Two lines JOINING together represent parents producing an offspring together.
Here is an example of a family tree showing cystic fibrosis (a RECESSIVE ALLELE):
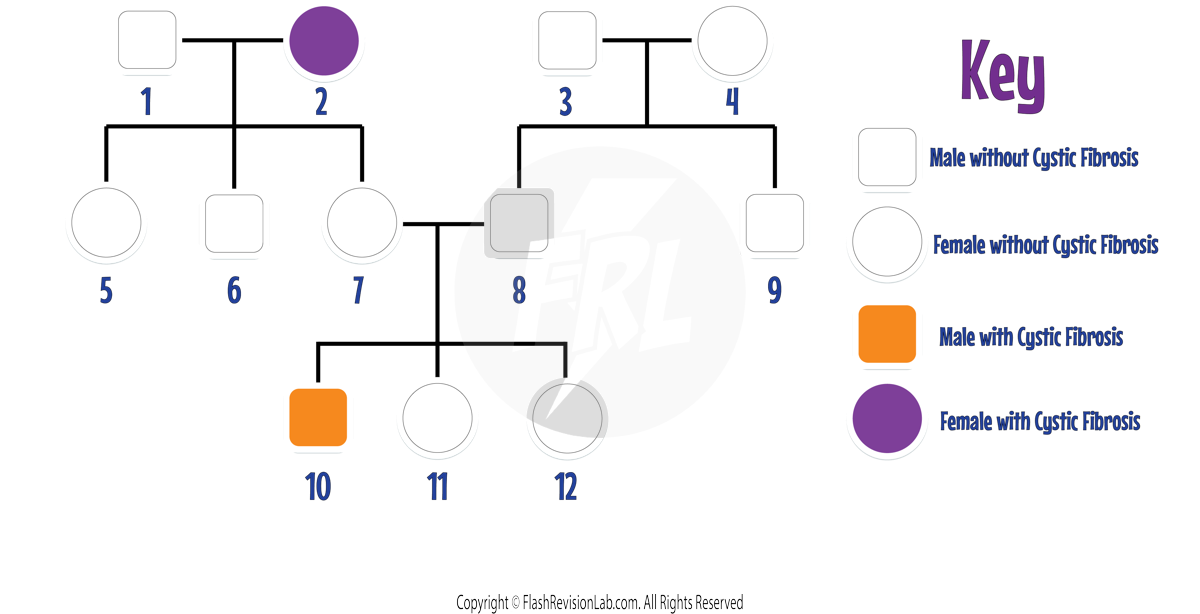
You can use this diagram to work out the GENOTYPES of person 7 and 8.
Both 7 and 8 do NOT have cystic fibrosis however one of their children (person 10) has it.
This means that person 10 has the genotype ‘ff’ as that is the only way to get the recessive disease.
This means that both ‘f’ genes must have come from EACH parent.
Therefore each parent must have an ‘f’ in their genotype.
As both mother and father do NOT have the disease, they must both be heterozygous.
A Punnett square to show person 7 and 8 can be drawn as follows:
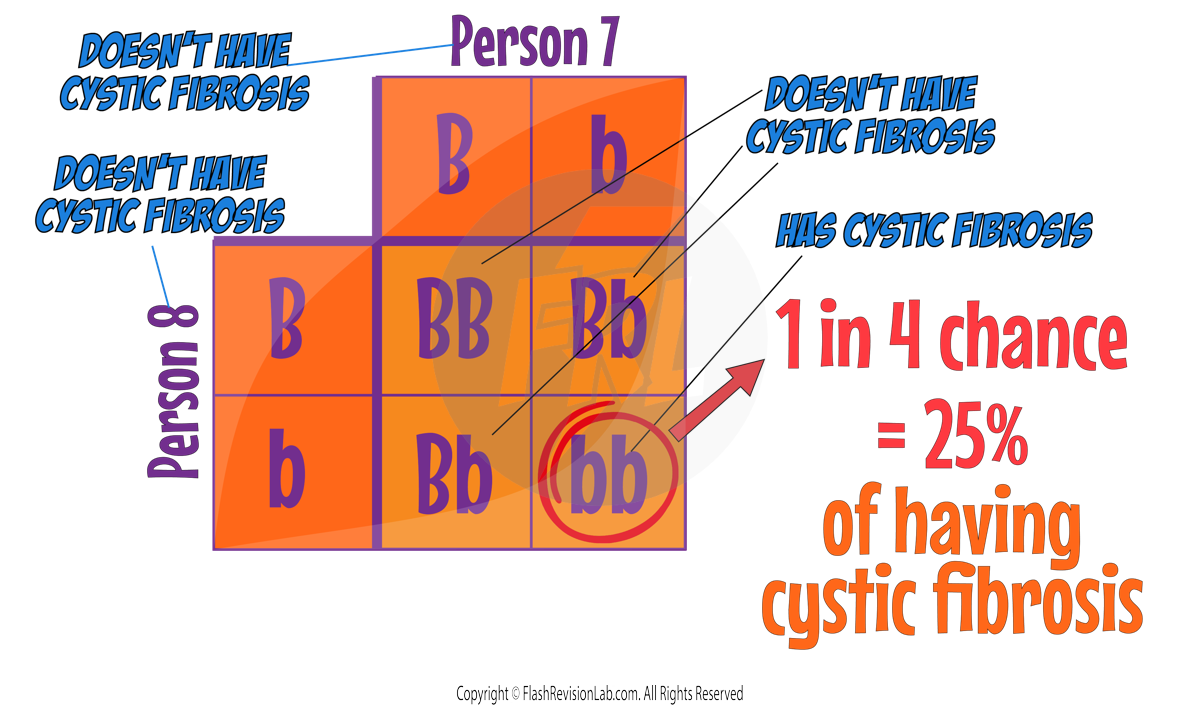
GENETIC SCREENING PROCESSES AND DEBATES
- When parents have a baby with IVF, they have the chance of carrying out GENETIC SCREENING on their embryos before they are implanted into the uterus.
- This provides them an early opportunity to DETECT GENETIC DISORDERS such as cystic fibrosis.
- This screening has come with ethical concerns on people having the decision to terminate embryos based on genetic findings.
- Here are the arguments people may have FOR and AGAINST embryo screening.
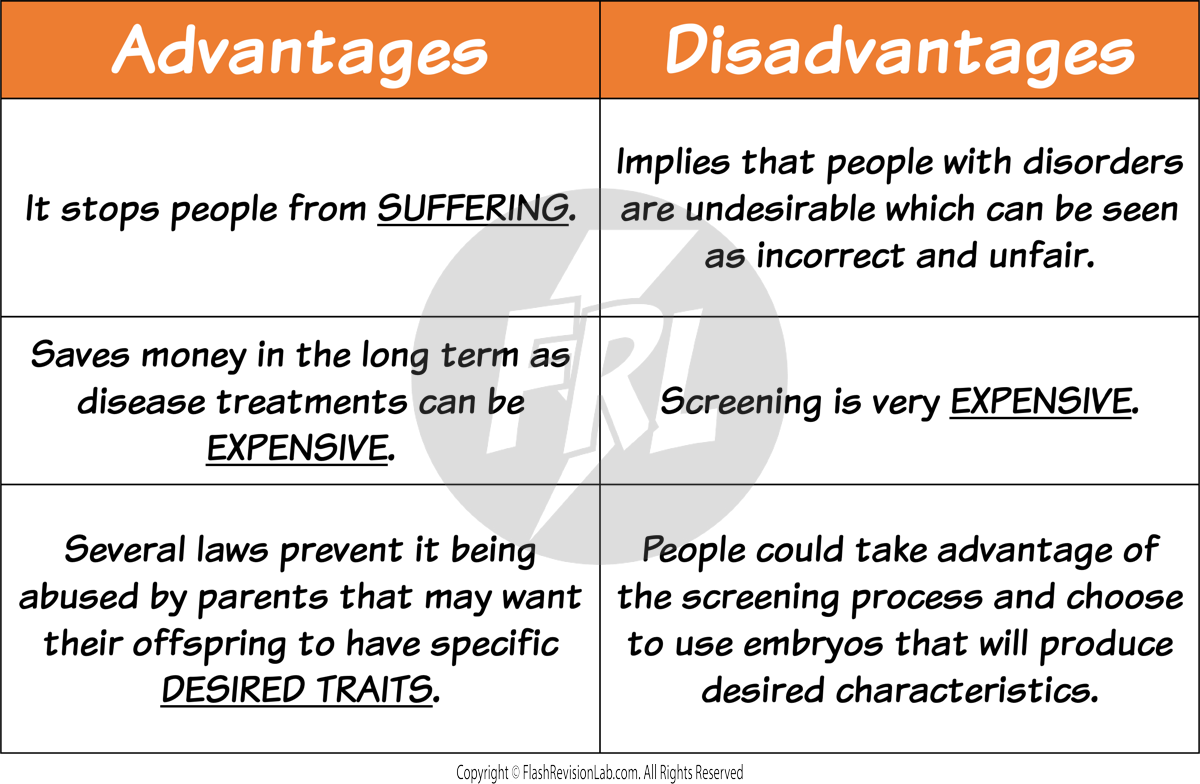
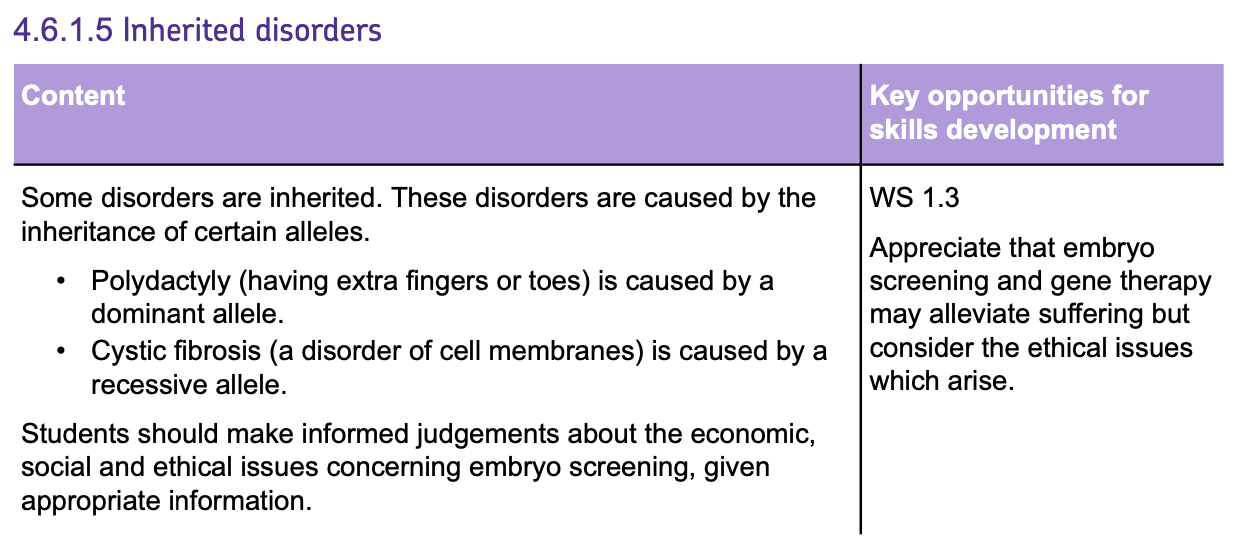
Sex Determination
- Humans have 23 PAIRS OF CHROMOSOMES, and 22 of the pairs determine a persons characteristics.
- The 23RD PAIR, known as the SEX CHROMOSOMES, determine an individual's sex.
- MALES have one X and one Y chromosome (XY), and the Y chromosome triggers the development of male characteristics.
- FEMALES have two X chromosomes (XX), and this combination allows for the development of female characteristics.
GENETIC DIAGRAMS AND SEX DETERMINATION
- Genetic diagrams, such as PUNNETT SQUARES, illustrate how chromosomes from each parent combine to determine the sex of the offspring.
- In these diagrams, the male's gametes (sperm) can carry either an X or a Y chromosome, while the female's gametes (eggs) always carry an X chromosome.
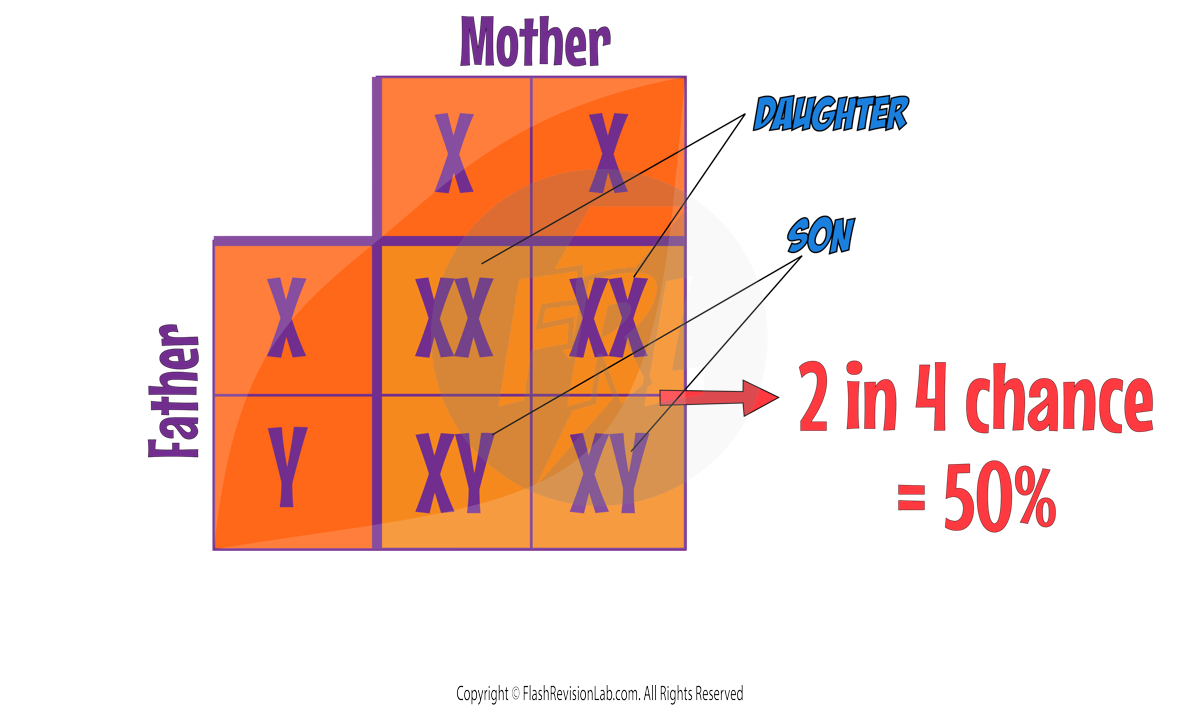
- This results in a 50:50 RATIO of potentially having a male (XY) or female (XX) offspring.
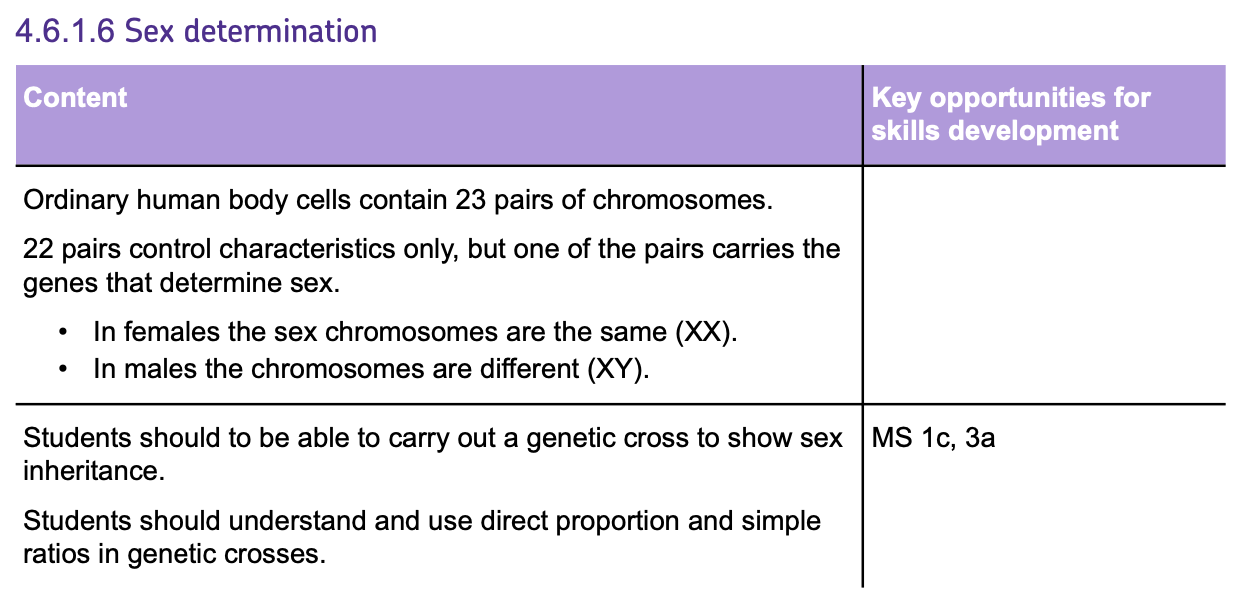
Variation
Every organism in most species are DIFFERENT to each other and have DIFFERENT characteristics. (eg. No two humans on the world has exactly the same genes).
These differences are known as VARIATION in the species and they could be down to:
1. GENETIC VARIATION
The genes all individuals INHERIT from their parents are all different due to the random mixing of DNA in the gametes.
The only exception to this rule are IDENTICAL TWINS.
This leads to different GENOTYPES which can also give different PHENOTYPES.
2. ENVIRONMENTAL VARIATION
An organism’s genome (all its DNA) can interact with the ENVIRONMENT in which it lives and develops in. This can influence the development of the phenotype of the organism.
E.g. Human’s living closer to the equator where their ENVIRONMENT exposes them to MORE SUNLIGHT tend to have a phenotype of DARKER SKIN to help protect them against ultraviolet radiation damage.
3. A COMBINATION OF GENETIC AND ENVIRONMENTAL VARIATION
Most variation in phenotype is determined by a MIXTURE of genetic and environmental factors.
E.g. A persons weight can be influenced by the genes they inherit AND the amount of food they eat.
MUTATIONS:
- MUTATIONS are changes to the sequence of DNA that can occur randomly or due to environmental factors. They can be inherited if they occur in gametes.
- A mutation can alter a GENE, leading to a different sequence of AMINO ACIDS in a protein, which can change the protein's function.
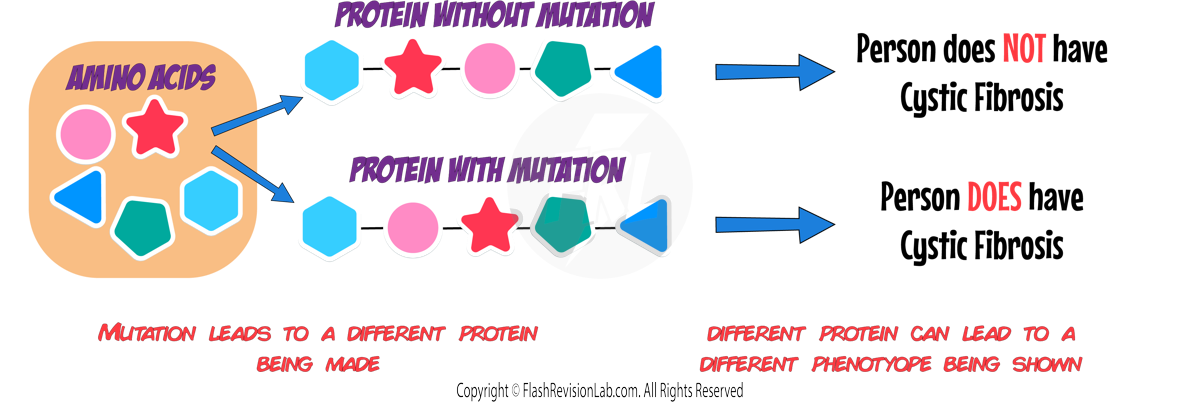
- The effects of mutations on an organism's PHENOTYPE can vary. Many mutations have minor or no visible effects, while others can significantly impact the phenotype, sometimes leading to disorders like cystic fibrosis.
- Dramatic Mutations can be particularly influential, causing significant changes in the phenotype and potentially affecting an individual's ability to survive and reproduce.
- If a mutation results in a trait that provides an ADVANTAGE in a specific environment, it may become MORE COMMON in the population through NATURAL SELECTION.
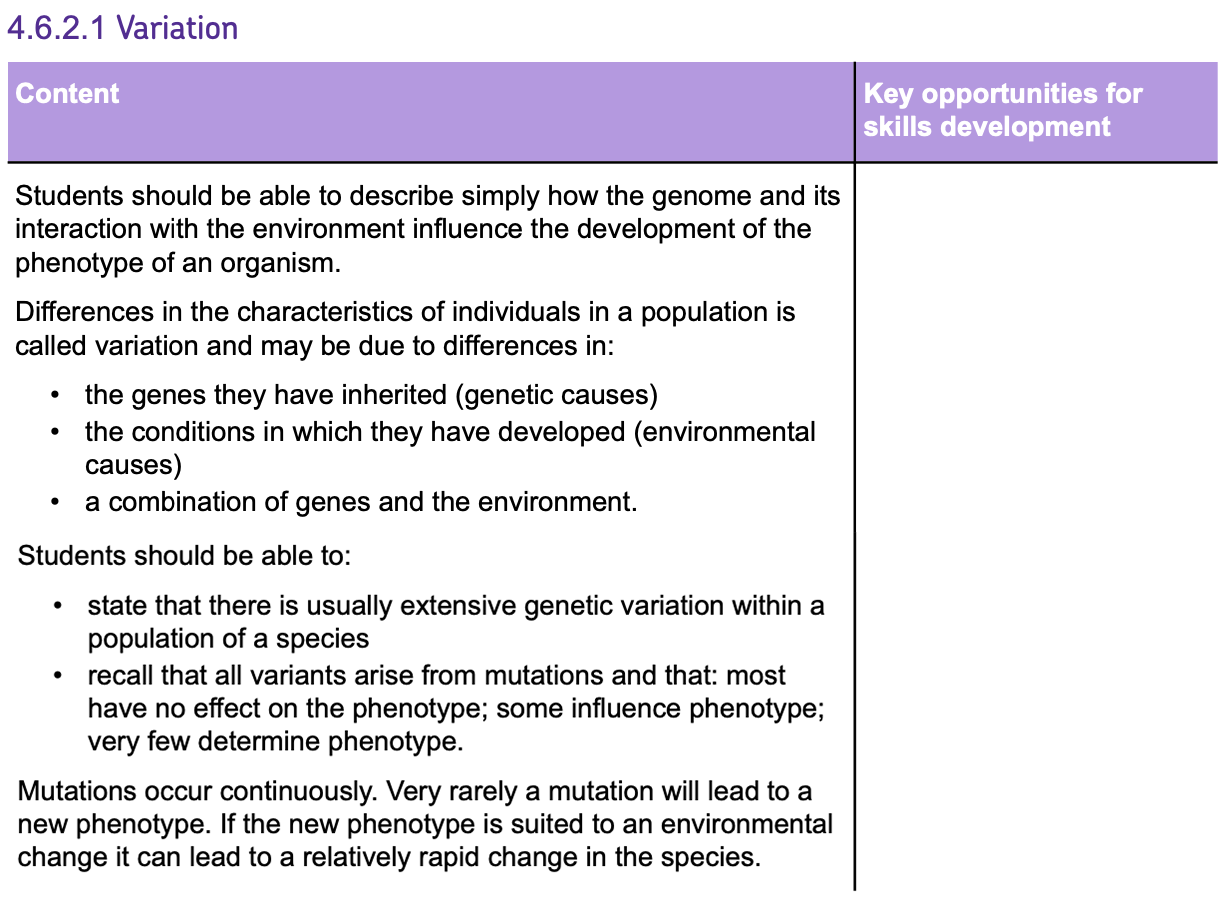
Evolution
- EVOLUTION is the gradual development of the inherited characteristic of a population over time through a process known as NATURAL SELECTION.
- This THEORY explains that all species of living things on Earth have gradually evolved from SIMPLE LIFE FORMS that first developed more that THREE BILLION YEARS AGO.
NATURAL SELECTION
- All organisms of a species show a large amount of variation in their PHENOTYPES (physical characteristics).
- Organisms within a species all COMPETE with EACHOTHER for RESOURCES such a food and shelter.
- The organisms which have BENEFICIAL phenotypes, are BETTER suited to their environment.
- This makes them MORE LIKELY TO SURVIVE and REPRODUCE.
- This makes them more likely to PASS ON THE BENEFICIAL GENES to their offspring.
- Over many generations, the beneficial characteristics become MORE COMMON in the species which results in the species EVOLVING.
An example of natural selection is with PEPPERED MOTHS:
- Light-coloured peppered moths were common in Britain, resting on light-coloured trees.
- Their colouration provided CAMOUFLAGE from predators like birds.
- Dark-coloured moths (a result of a genetic mutation) were easier to spot and more likely to be eaten.
- During the Industrial Revolution, factories emitted soot and pollution, which DARKENED the tree bark.
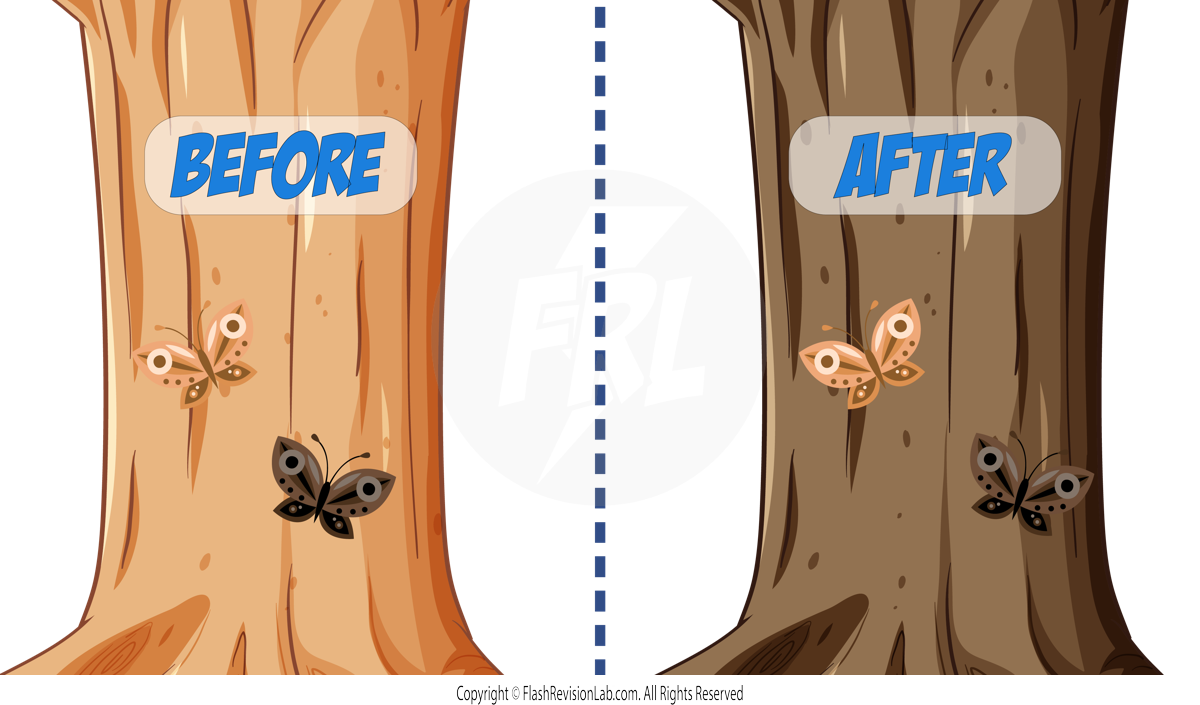
- The ENVIRONMENT CHANGED, and now the light-coloured moths stood out against the dark trees, making them MORE VISIBLE to predators.
- The dark-coloured moths blended in better with the sooty bark and were LESS LIKELY to be eaten.
- Since dark moths were less likely to be eaten, they SURVIVED longer and had more chances to REPRODUCE.
- They PASSED ON THE GENES for dark colouration to their offspring.
- Over time, the number of dark moths increased because they had a higher survival rate.
Species
A species is a group of organisms capable of INTERBREEDING and producing FERTILE OFFSPRING.
When natural selection occurs, it is possible for two populations of ONE SPECIES to become so different in phenotype that they turn into TWO SPECIES.
This occurs when the two populations can no longer INTERBREED to form FERTILE OFFSPRING.
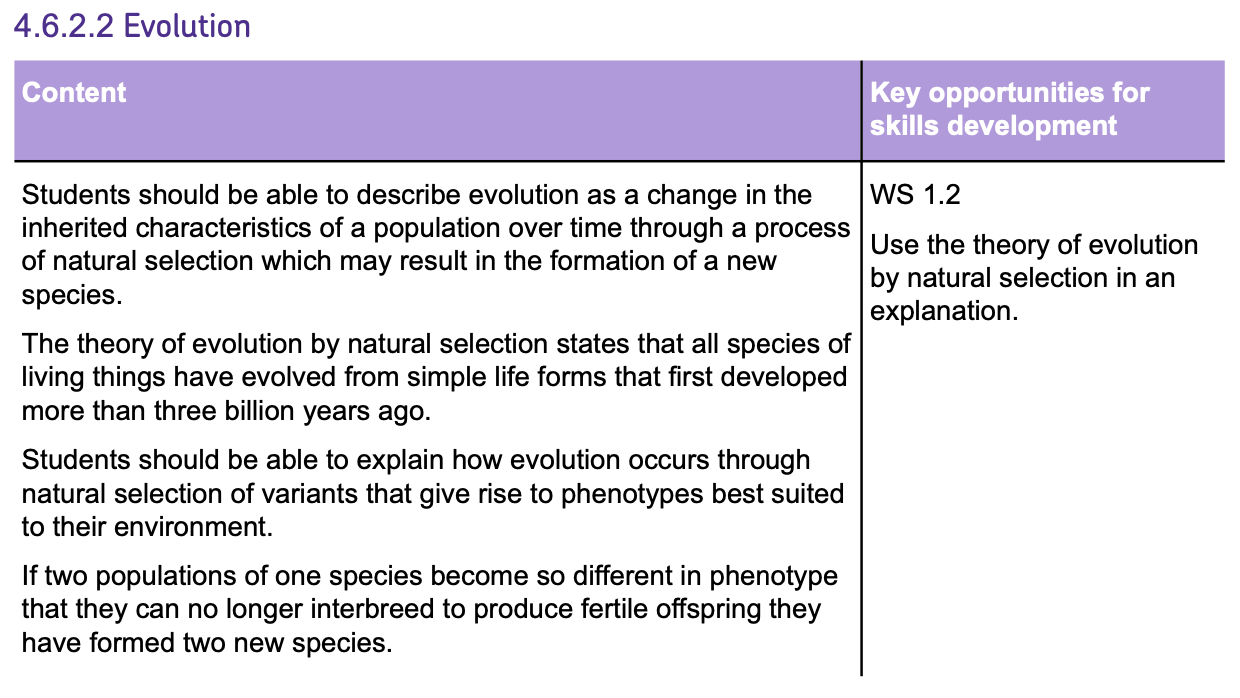
Selective Breeding
- SELECTIVE BREEDING or (ARTIFICIAL SELECTION) is a process where humans choose specific plants or animals with DESIRABLE TRAITS to BREED, in order to pass down the desirable characteristics to the offspring.
- The goal is to ensure that genes for particular traits stay in the population.
- This is something humans have been doing for thousands of years since they first bred FOOD CROPS from wild plants and DOMESTICATED ANIMALS (pets).
Examples of characteristics that humans choose for selective breeding include:
- DISEASE RESISTANT food crops.
- Animals which produce MORE MEAT or MILK.
- Domestic dogs (pets) with a GENTLE NATURE.
- LARGE or UNUSUAL decorative flowers.
STEPS IN SELECTIVE BREEDING
1) Start with the EXISTING STOCK and identify individuals with the DESIRED TRAITS.
2) These chosen individuals are then BRED to produce offspring.
3) From the OFFSPRING, select those that best show the desired traits and BREED them in the next generation.
4) Repeat this process across SEVERAL GENERATIONS, each time enhancing the trait in the population.
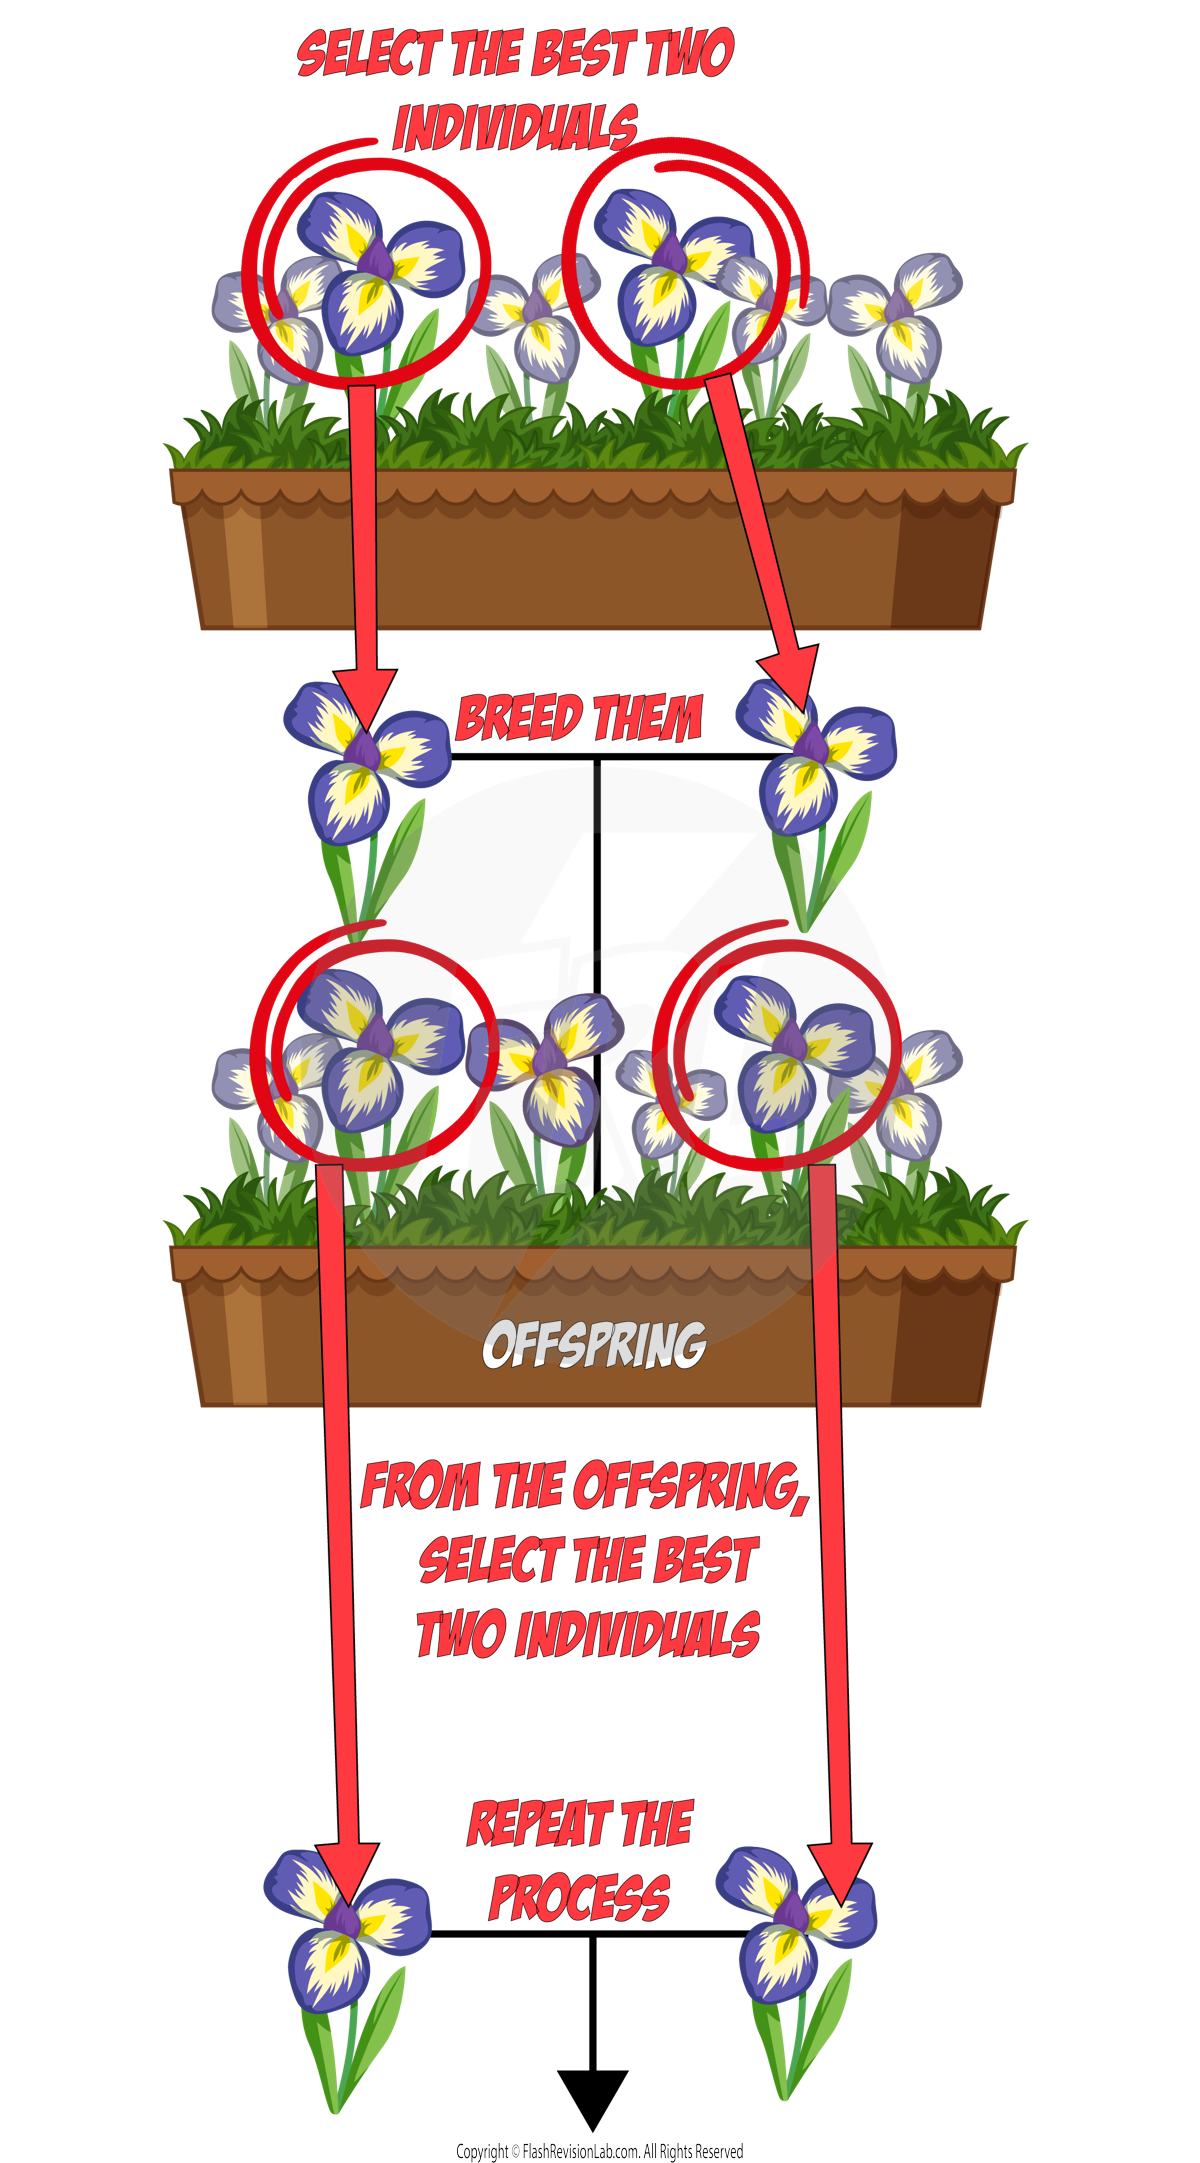
DOWNSIDES OF SELECTIVE BREEDING
A major drawback is the potential REDUCTION IN THE GENE POOL, leading to a decrease in genetic diversity.
The gene pool is the total number of DIFFERENT ALLELES present in a population.
The population of the selectively bred stock becomes INBRED as the humans chose two individuals which are CLOSELY RELATED.
INBREEDING can be problematic as
- It can result in increased HEALTH ISSUES and GENETIC DEFECTS.
- The lack of genetic variation can be dangerous if a new disease strikes. If one individual is not resistant to the disease, the WHOLE STOCK is also likely to NOT be RESISTANT to it as there's little to no variation within the closely related population. This means a new disease has the potential to KILL the WHOLE STOCK.
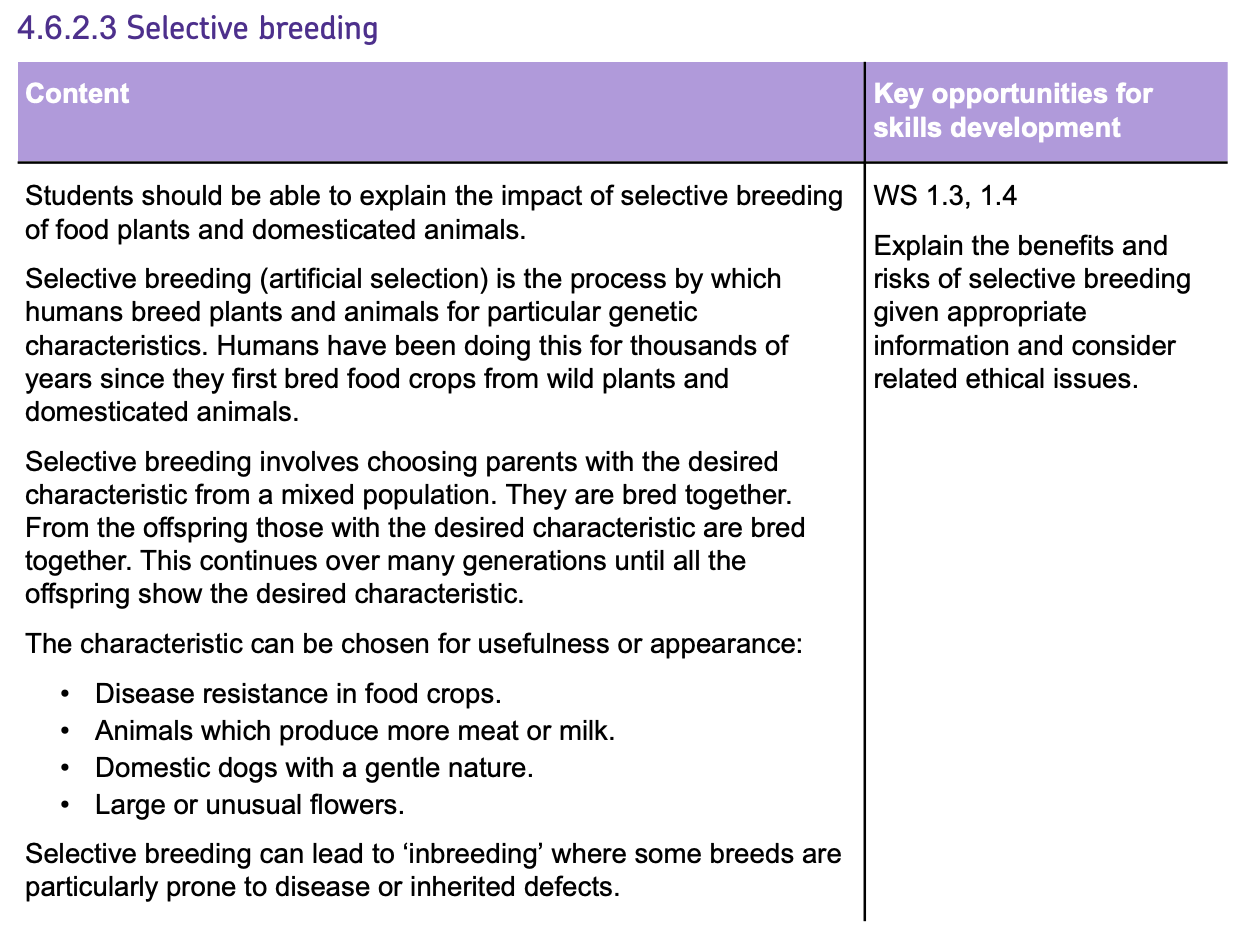
Genetic Engineering
- GENETIC ENGINEERING involves modifying the DNA (genome) of an organism by introducing a GENE that codes for a DESIRED CHARACTERISTIC from ANOTHER organism.
- The gene is inserted into the organism at an early stage in their development so that it develops with the DESIRED CHARACTERISTICS.
- This is done by transferring the gene using a VECTOR. The vector can either be a VIRUS or a PLASMID from a BACTERIA.
USES OF GENETIC ENGINEERING
1. Producing MEDICINES, such as INSULIN for DIABETES treatment.
2. Creating GENETICALLY MODIFIED (GM) CROPS with enhanced RESISTANCE to disease, herbicides and insects.
3. Creating GENETICALLY MODIFIED (GM) CROPS with BIGGER and BETTER FRUIT.
4. Modifying the genes of ANIMALS, so that they produce substances like drugs in their milk.
5. Carrying out GENE THERAPY which aims to correct GENETIC DISORDERS caused by FAULTY GENES by replacing them with WORKING GENES into patients' cells.
STEPS FOR GENETIC ENGINEERING
1. The beneficial gene is ISOLATED and 'CUT OUT' from an organism's genome using ENZYMES.
2. The gene is INSERTED into a VECTOR (virus or a bacterial plasmid).
3. The vector with the gene is then introduced into the target organism.
4. The target organism now expresses the BENEFICIAL CHARACTERISTICS coded by the inserted gene.
As an example, lets look at making insulin from bacteria. This involves using a BACTERIAL PLASMID and adding the gene responsible for making INSULIN from a HUMAN CELL.
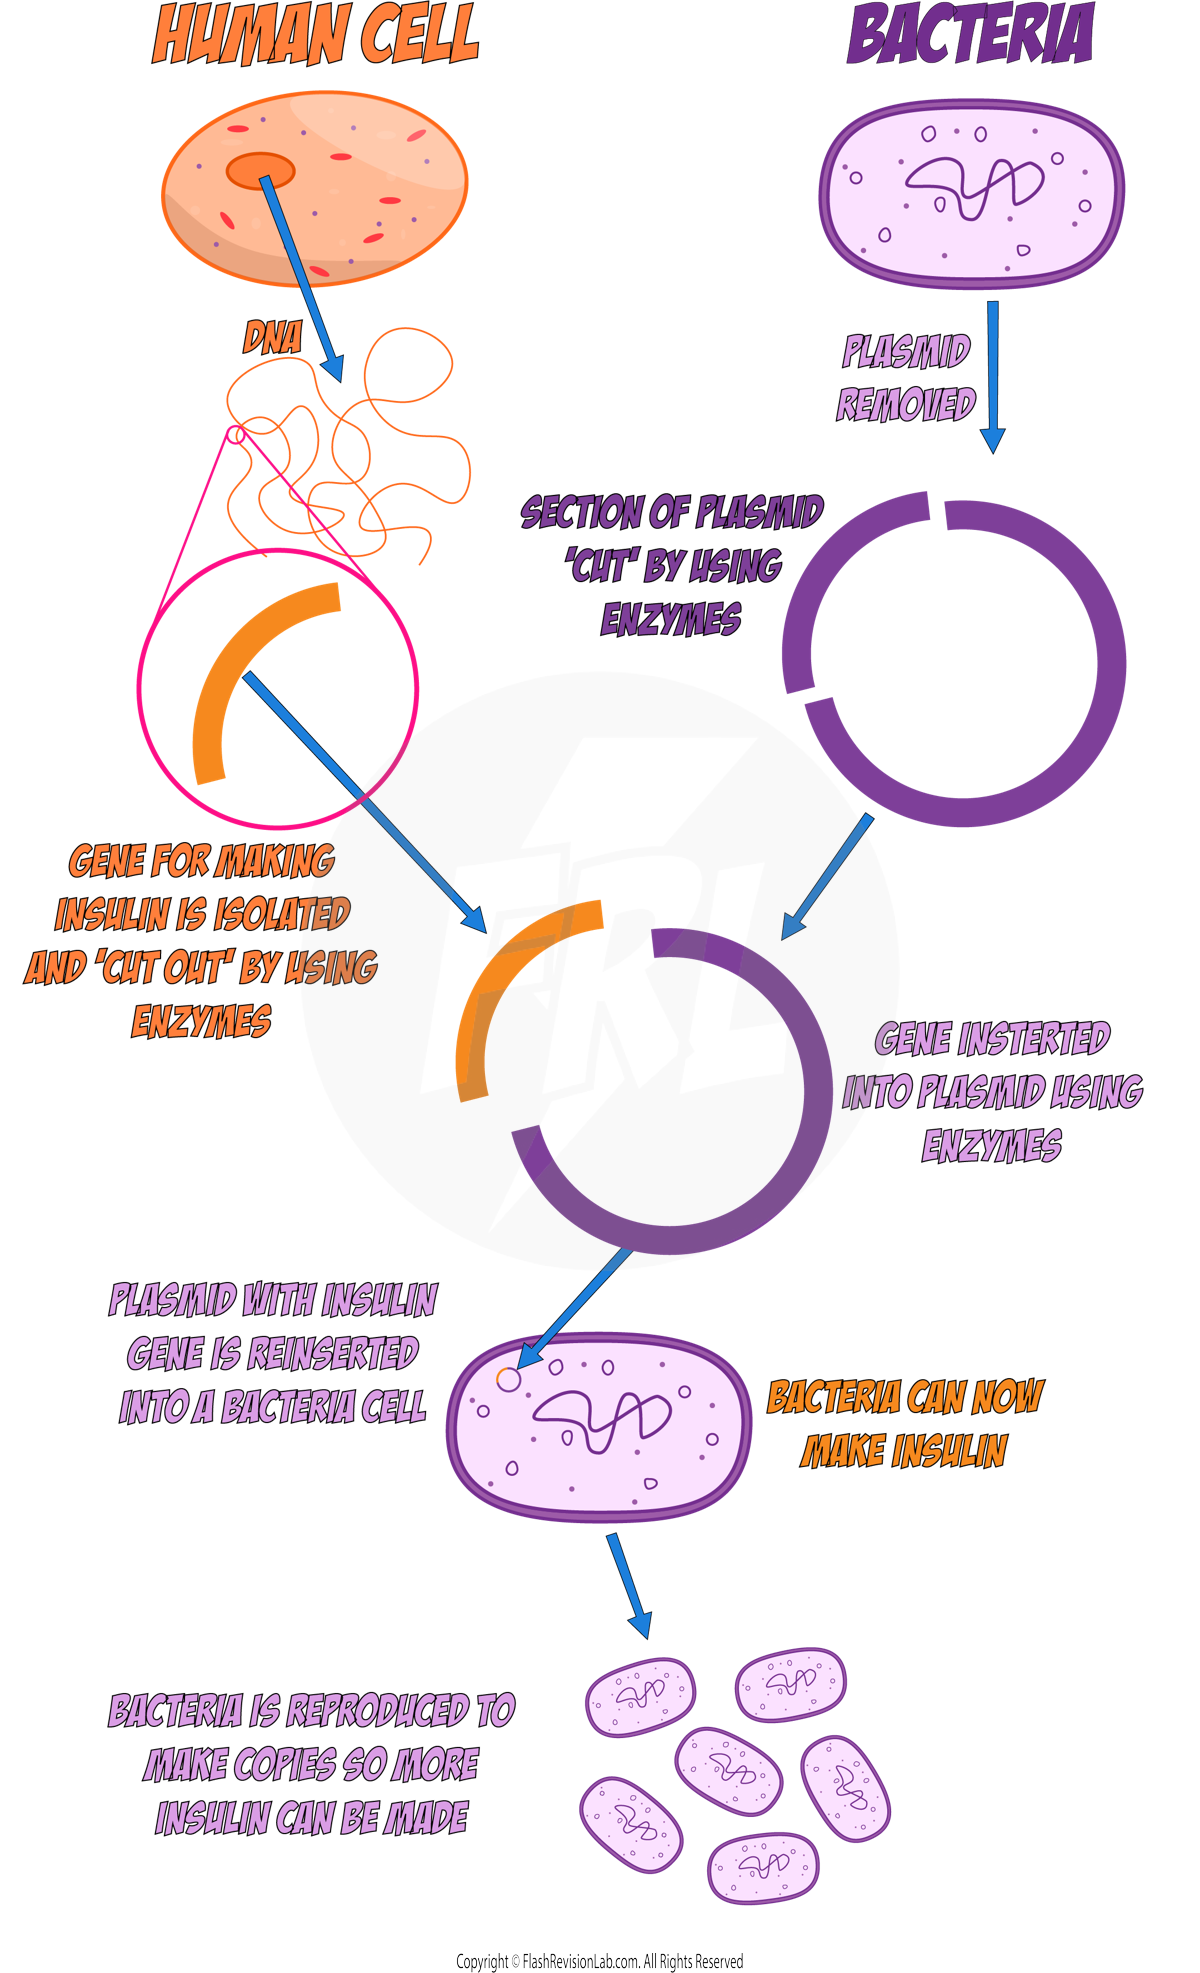
The bacteria cell are capable of making insulin and by reproducing them, you can make high volumes of insulin that can be used to treat DIABETES.
CONTROVERSY WITH GM CROPS
- There's a debate about the potential long-term effects of genetic engineering on organisms and ecosystems. Here are some of the advantages and disadvantages of using GENETICALLY MODIFIED CROPS.
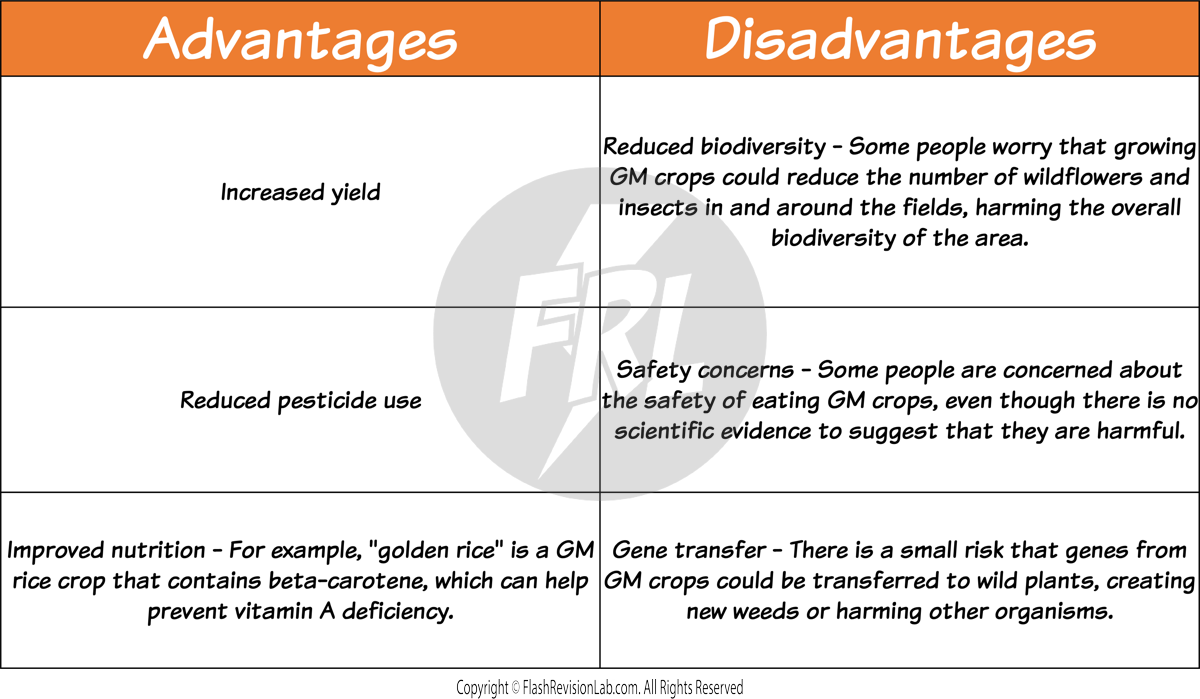
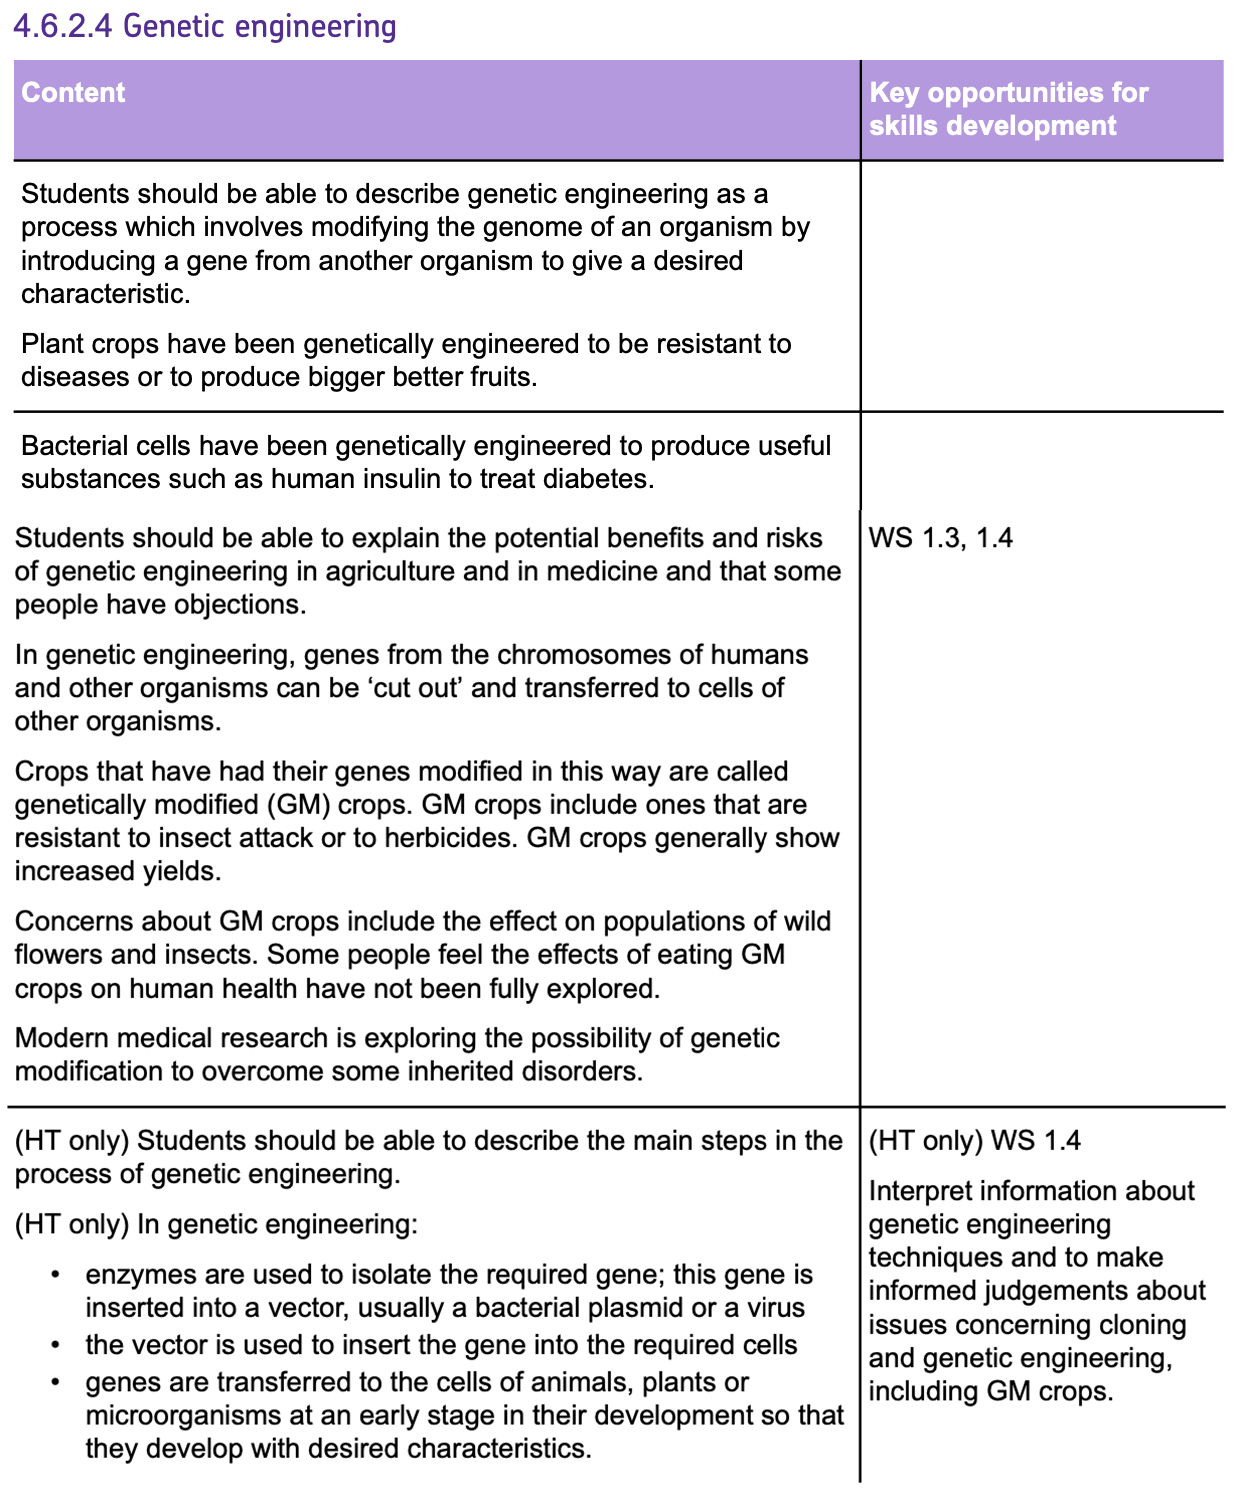
Evidence for Evolution
- CHARLES DARWIN developed the THEORY OF EVOLUTION by natural selection, which was NOT widely accepted during his time.
- Today, the theory of evolution is WIDELY ACCEPTED due to a large amount of supporting evidence.
- DARWIN'S THEORY suggested that traits beneficial for survival are passed on to offspring, and this is now understood to occur at the genetic level.
Evidence for Evolution
- Modern science has shown that CHARACTERISTICS are indeed passed on to offspring through GENES.
- FOSSIL RECORDS provides a huge amount of historical data about life on Earth, showing GRADUAL CHANGES in species over time. (see later in notes)
- How ANTIBIOTIC RESISTANCE evolves in bacteria is a prime example of natural selection in action and is a clear demonstration of how characteristics that offer a survival advantage can quickly become common within a population. (see later in notes)
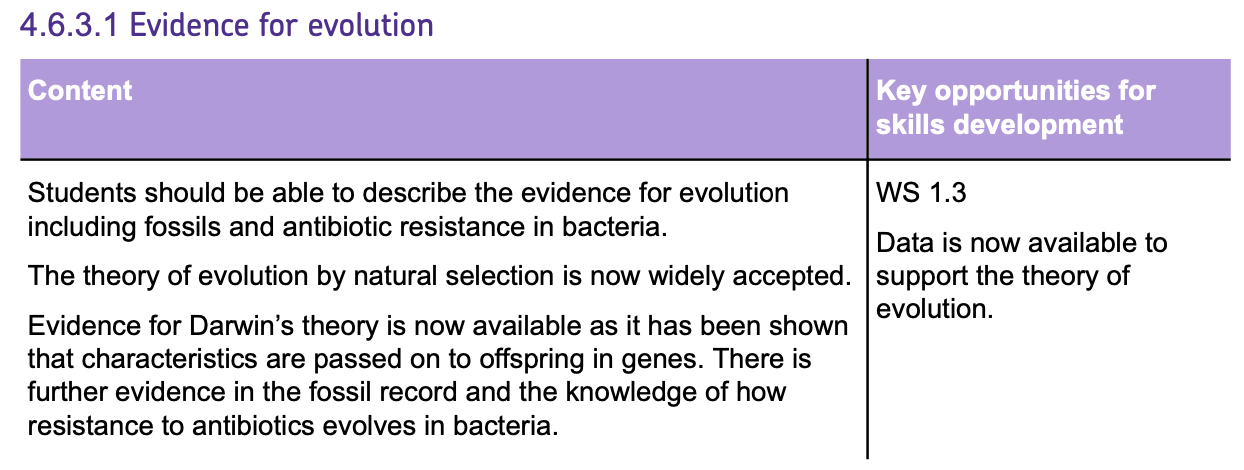
Fossils and Extinction
Fossils
FOSSILS are the preserved remains or impressions of organisms that lived millions of years ago.
They serve as EVIDENCE of how organisms have evolved over time.
There are THREE ways that FOSSILS form:
1. Gradual Replacement by Minerals:
Most fossils are formed when the hard parts of organisms, like TEETH or SHELLS, are gradually replaced by minerals, creating a rock-like model of the original part.
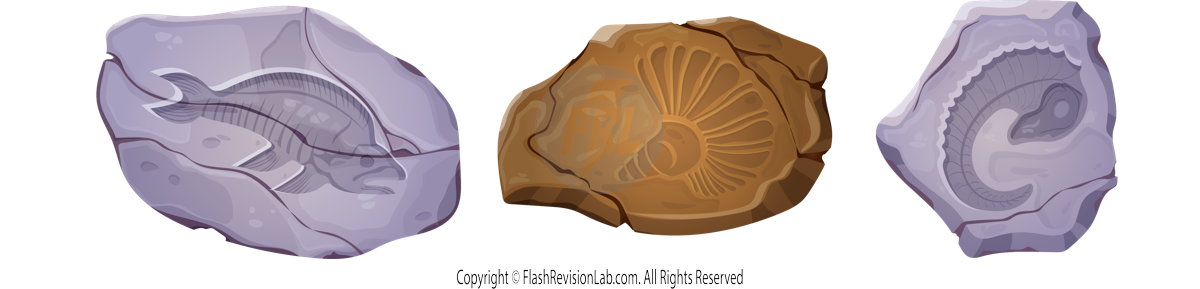
2. Preservation:
When organisms die, microorganism feed on their bodies to cause them to DECAY. Some dead organisms however do not decay and can be preserved in areas where:
- No oxygen or moisture is present like AMBER or TAR PITS.
- Temperatures are too low for microorganisms to work like GLACIERS.
- pH is too acidic for microorganisms to work such as in PEAT BOGS.

3. Casts and Impressions:
Not all fossils are of the organisms themselves. Some are TRACE FOSSILS, which record the ACTIVITY of organisms.
Examples of these include
- FOOTPRINTS of organisms in SOFT CLAY which later harden to preserve the shape
- ROOTLET TRACES that captures the imprint or remains of the fine, HAIR-LIKE ROOTS of ancient plants.
- BURROW TRACES which are tunnels and holes that record the ACTIVITY of animals (such as worms) that BURROWED into soft sediments in ancient environments.
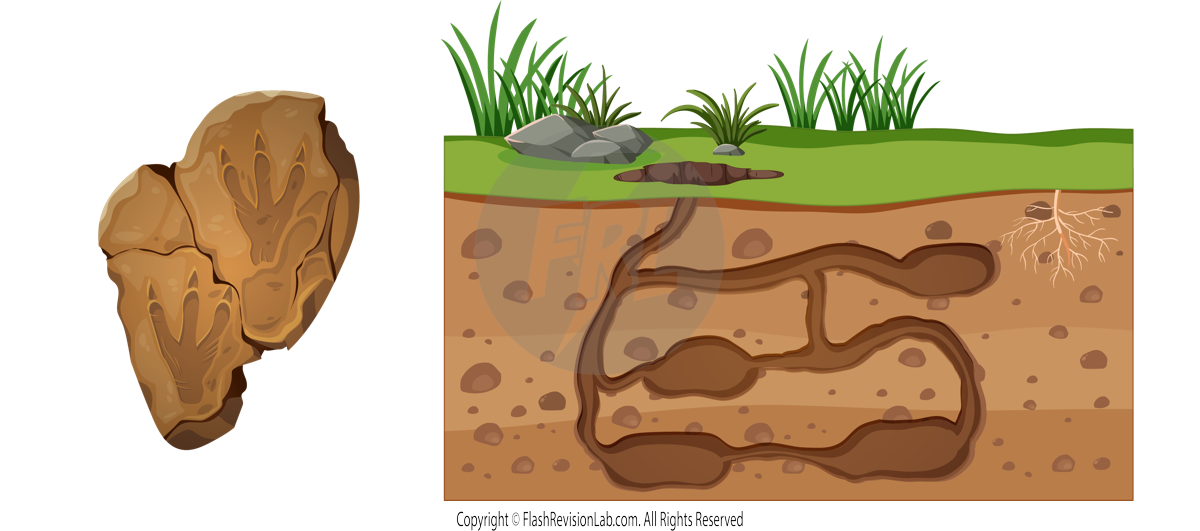
THE SIGNIFICANCE OF FOSSILS
- Fossils give us a RECORD of past life on Earth and can give us an idea into the physical structure and lifestyle of extinct organisms.
- By looking at the GRADUAL CHANGES in organisms over time, they help scientists understand the process of EVOLUTION and how current species have developed from their ancestors.
- We can learn from fossils how much or how little different organisms have changed as life developed on Earth.
CHALLENGES WITH FOSSILS
- The main challenge with fossils is that the fossil record we have is INCOMPLETE.
- Scientist can NOT be certain about how life began on earth because many of the early forms of life were SOFT BODIED.
- This meant pretty much all of their bodies decayed and they left VERY LITTE TRACES behind.
- Any traces that happened to stay behind were destroyed by GEOLOGICAL ACTIVITY (e.g. tectonic plate movement).
EVOLUTIONARY TREES:
- These are diagrams that show how different species are related to each other.
- They show COMMON ANCESTORS and RELATIONSHIPS between species.
- Two branches in a tree meeting in an evolutionary tree represents a COMMON ANCESTOR.
- This means the CLOSER that two species share a BRANCH, the MORE RECENTLY they SHARE a common ancestor.
- The MORE RECENT the common ancestor, the MORE CLOSELY RELATED the two species. This means the two species are more likely to share MORE CHARACTERISTICS.
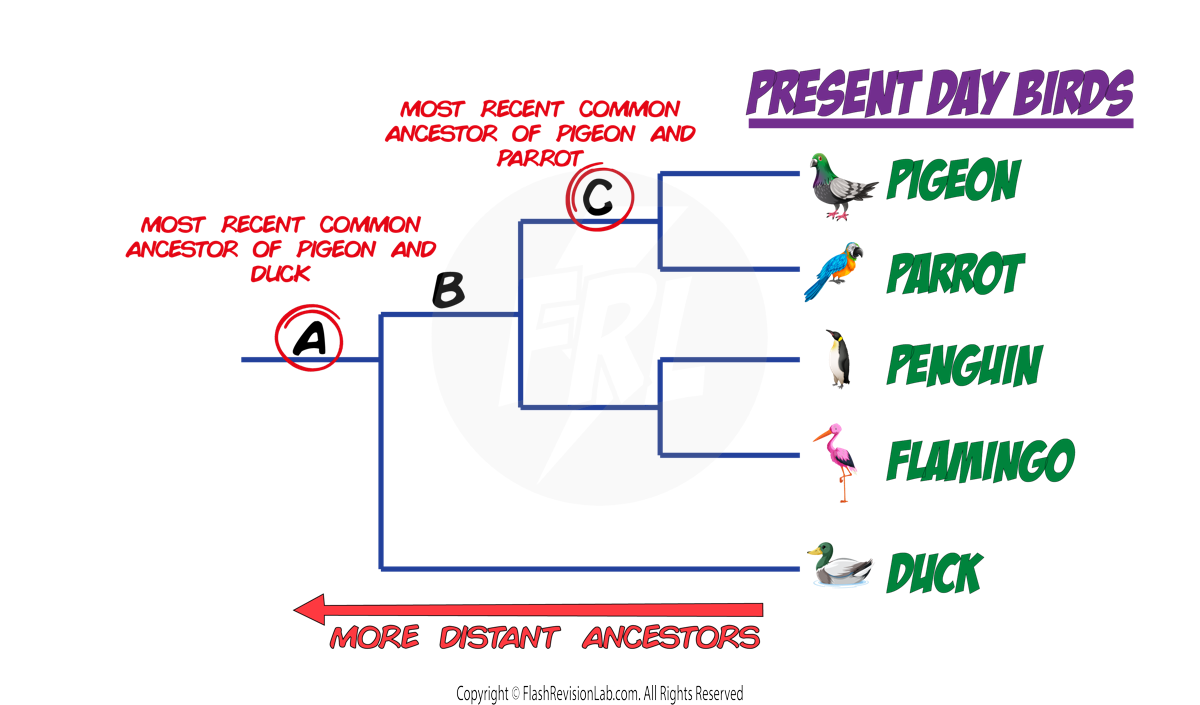
In this example, animals A, B and C are ancestors of the present day birds
PIGEONS are most closely related to PARROTS as they share the MOST RECENT ANCESTOR represented as animal C. This means they share MORE CHARACTERISTICS with each other (they are more similar).
PIGEONS will be LEAST related to DUCKS as their most recent common ancestor is more DISTANT (Animal A) so they will not share as many characteristic with them.
The bird in this diagram to evolve FIRST would be the DUCK as it branches off the EARLIEST compared to the other birds. It has directly evolved from animal A which is the earliest ancestor in the diagram.
EXTINCTION
EXTINCTION occurs when a species no longer has any surviving individuals. It can be caused by many different factors including:
- ENVIRONMENTAL CHANGES: A significant change in an organism's environment can lead to HABITAT LOSS.
- NEW PREDATOR: A new animal can eat and kill the organism.
- NEW DISEASE: A new disease can wipe out a species if they have no resistance to it.
- COMPETITION: Other species compete for food and resources and the less adapted species will not have enough to survive.
- HUMAN ACTIVITY: Overhunting, deforestation, and pollution are modern causes of extinction.
- NATURAL DISASTERS: Events like volcanic eruptions or asteroid impacts can lead to mass extinctions.
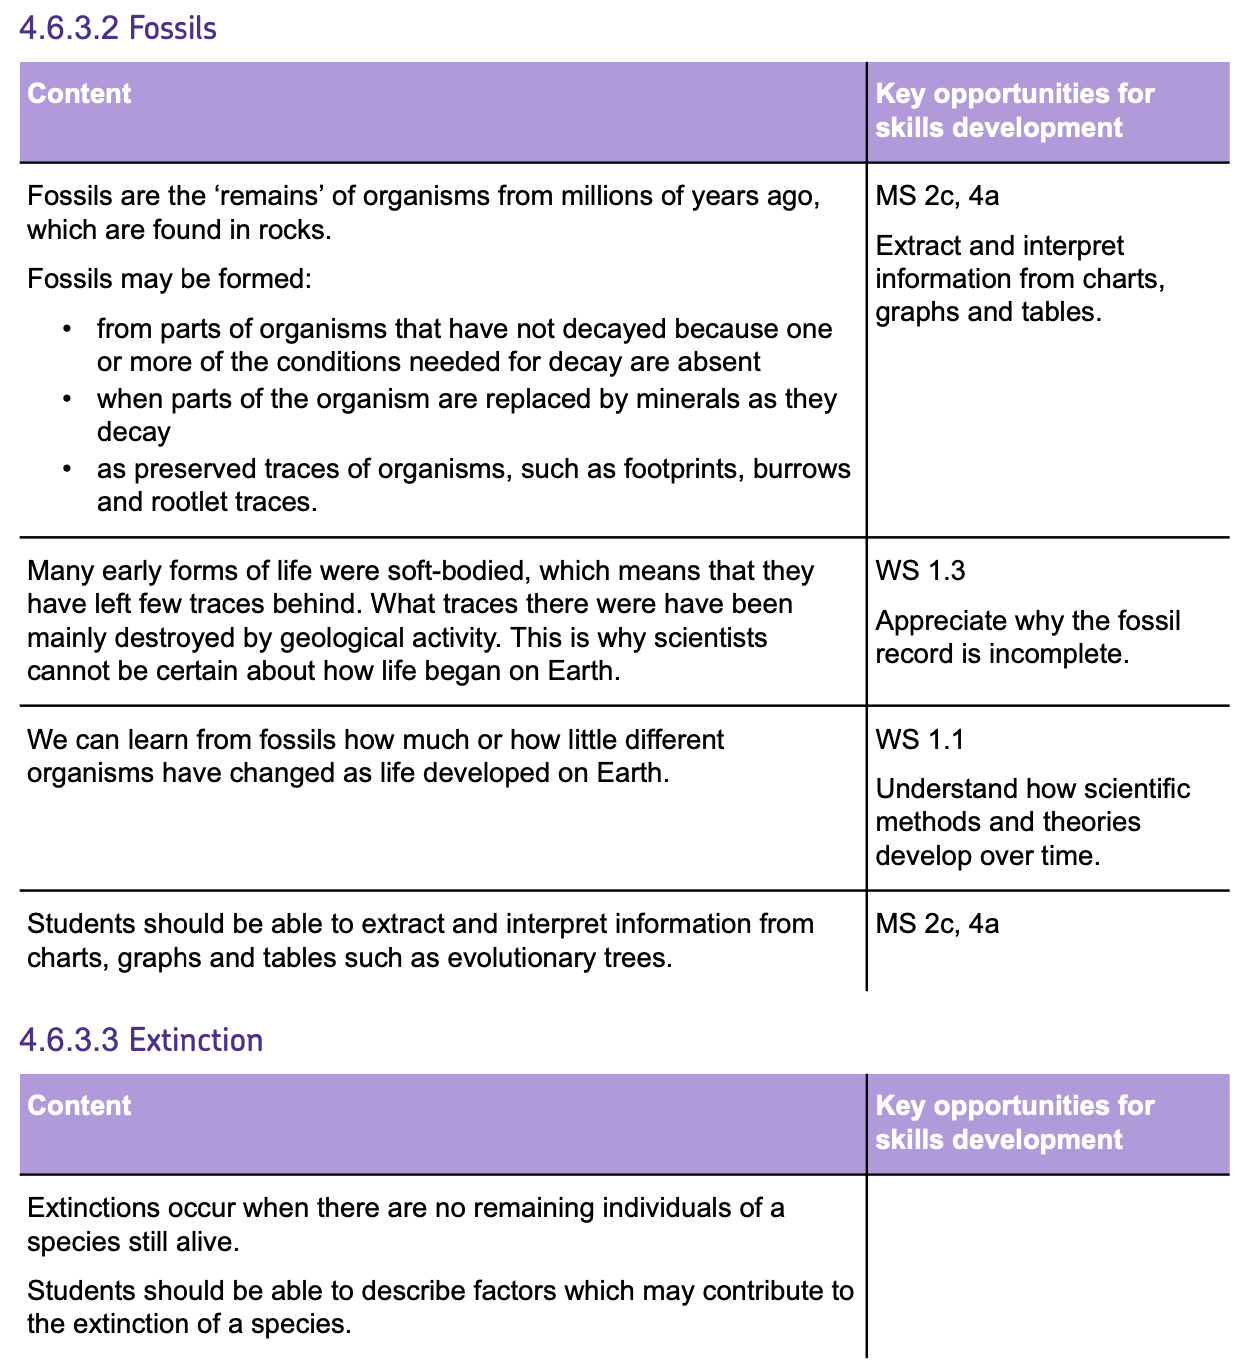
Antibiotic-Resistant Bacteria
Antibiotics are used to treat BACTERIAL infections, but the emergence of ANTIBIOTIC-RESISTANT BACTERIA poses a significant challenge to modern medicine.
HOW BACTERIA BECOME RESISTANT
- Bacteria can become resistance through RANDOM MUTATIONS in their DNA, leading to changes in their characteristics.
- These mutations may result in bacteria forming RESISTANT STRAINS that can survive even when exposed to antibiotics.

- Whenever antibiotics are introduced to bacteria, they will kill most of the cells, however the RESISTANT BACTERIA will SURVIVE and REPRODUCE.
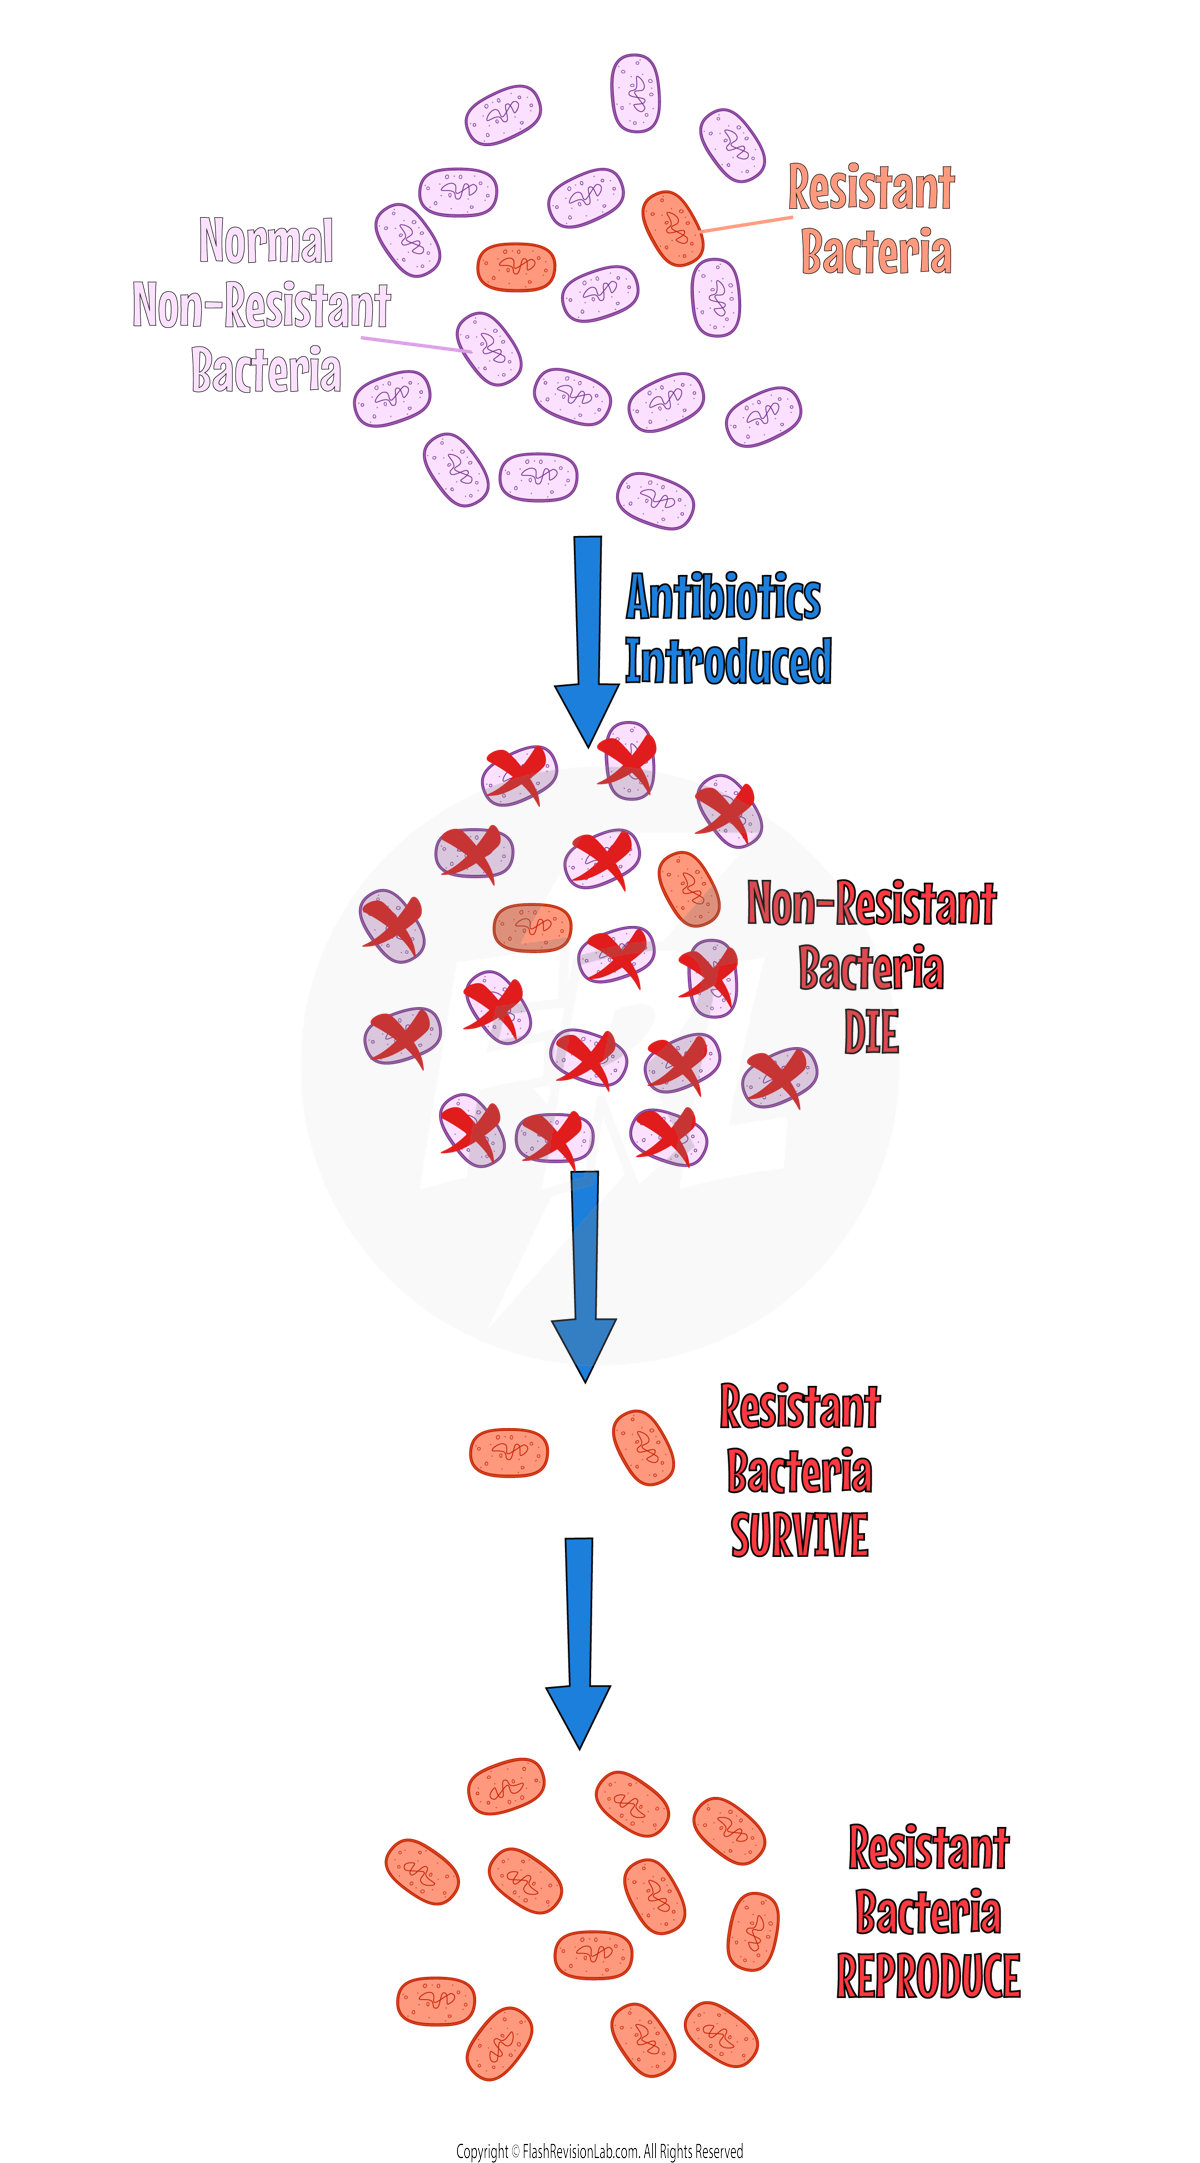
- Since bacteria reproduce RAPIDLY, these resistant traits can spread throughout their whole populations, outcompeting non-resistant strains. This is an example of EVOLUTION.
CONSEQUENCES OF ANTIBIOTIC RESISTANCE
- Resistant bacteria are HARDER to treat, as they will NO LONGER BE KILLED by the antibiotics.
- This leads to infections that can SPREAD EASILY between people as they are not immune it AND there is no longer any effective treatment for the bacteria. This makes these bacterial infections more difficult to manage.
- An example is MRSA, a notorious 'superbug' that is resistant to antibiotics.
There are several FACTORS that have contributed to ANTIBIOTIC RESISTANCE:
- The OVERUSE and MISUSE of antibiotics, such as prescribing them for non-bacterial infections, have made the issue worse.
- Inappropriate antibiotic use in AGRICULTURE to treat plant infections has also contributes to the rise in resistant strains.
- Scientists are trying develop new antibiotics to combat resistant strains but the process is very EXPENSIVE and SLOW, meaning it will NOT likely keep up with the emergence of new strains.
We can SLOW down the development of antibiotic resistant bacteria by doing the following:
- Doctors should encourage patients to complete the FULL COURSE of prescribed antibiotics, even if they are feeling better. This ensures that ALL bacteria are eliminated, and none survive to form resistant strains.
- Doctors should NOT prescribing antibiotic inappropriately, such as treating NON-SERIOUS infections and VIRAL infections.
- In FARMING, the use of antibiotics should be RESTRICTED.
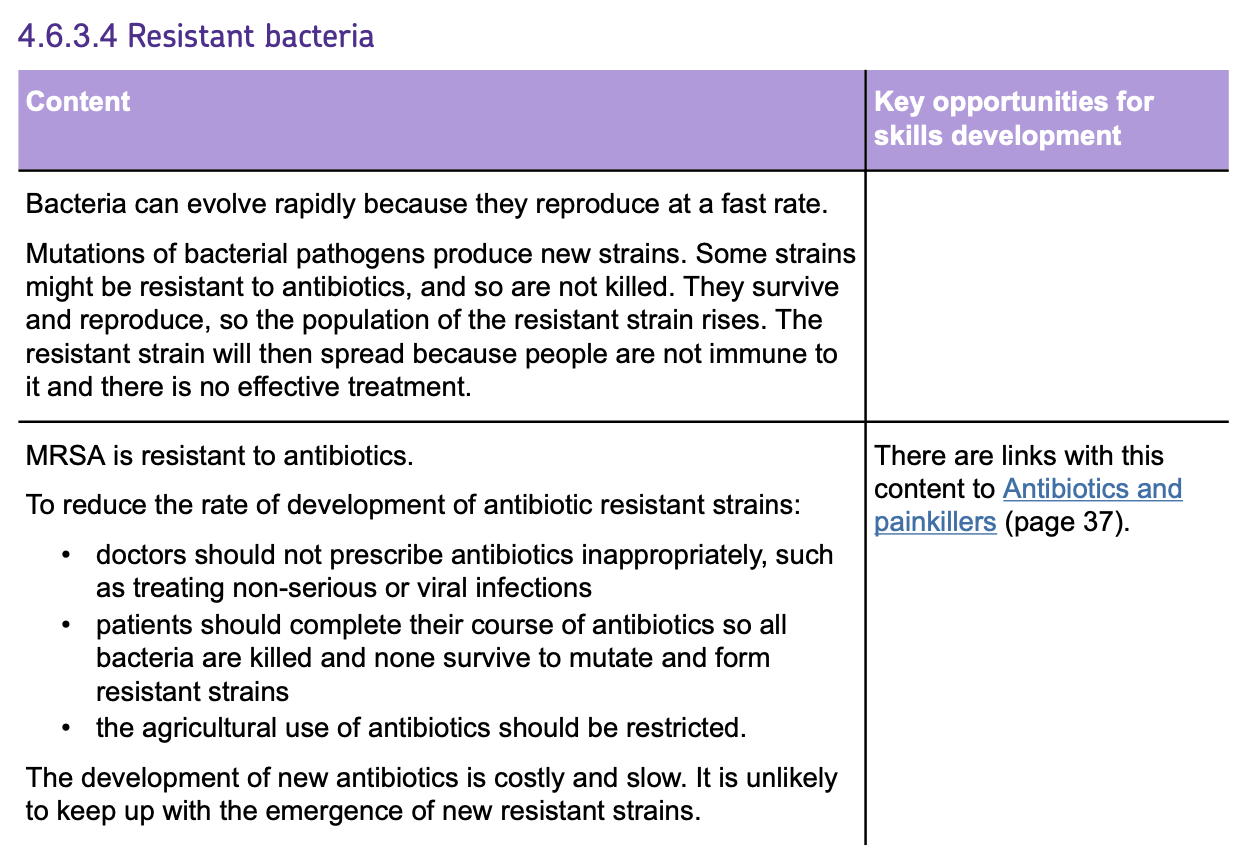
Biological Classification
- CLASSIFICATION is a systematic approach in biology to ORGANISE all living organisms into groups.
- There are several systems we have used to classify organisms. The most used systems have changed over time as our understanding of organisms have developed:
1. LINNAEAN SYSTEM
Traditionally since the 1700s, living things have been classified into groups depending on their structure and characteristics.
The LINNAEAN SYSTEM was developed by CARL LINNAEUS and it classified all the organisms into several stages of sub-divisions.
- Starting with broad KINGDOMS, organisms are classified into progressively specific categories: PHYLUM, CLASS, ORDER, FAMILY, GENUS, and SPECIES.
- Each level of classification, groups organisms that share a set of distinctive characteristics.
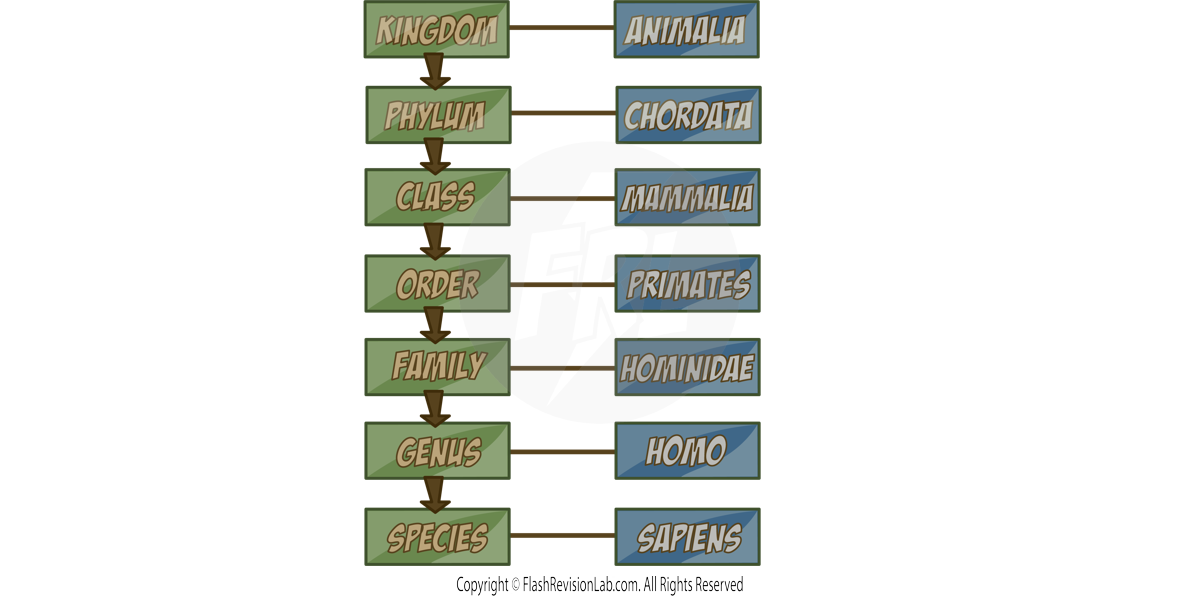
- The BINOMIAL SYSTEM is used to NAME each species by using a unique two-part Latin name, which is consistent across scientific studies and languages.
- The first part of the name is the GENUS and the second part is the SPECIES.
e.g. The binomial name for Humans is HOMO SAPIENS.
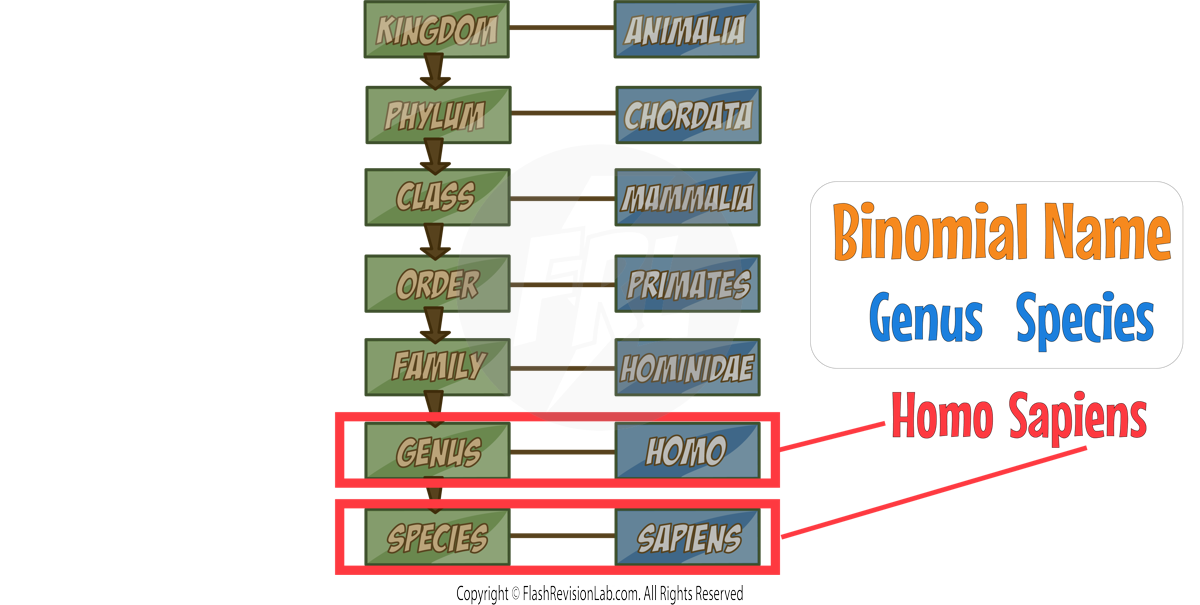
As evidence of INTERNAL STRUCTURES of cells became more developed due to improvements in MICROSCOPES, and the understanding of BIOCHEMICAL processes cells progressed, NEW MODELS of classification were proposed.
2.THE THREE-DOMAIN SYSTEM
This system was developed by CARL WOESE in 1990 and was based on evidence available from chemical analysis,
The THREE-DOMAIN SYSTEM recognises THREE fundamental groups of organisms:
- ARCHAEA: Primitive bacteria, often found in extreme environments.
- BACTERIA: True bacteria, including well-known species such as coli.
- EUKARYOTA: Diverse domain including fungi, plants, animals, and protists.
ARCHAEA and BACTERIA often look very similar but they have lots of BIOCHEMICAL DIFFERENCES.
UNDERSTANDING EVOLUTIONARY RELATIONSHIPS
- EVOLUTIONARY TREES, also known as phylogenetic trees, visualise the lineage and connections among different species.
- These diagrams illustrate how closely related different species are and imply the traits that may have been inherited from common ancestors.
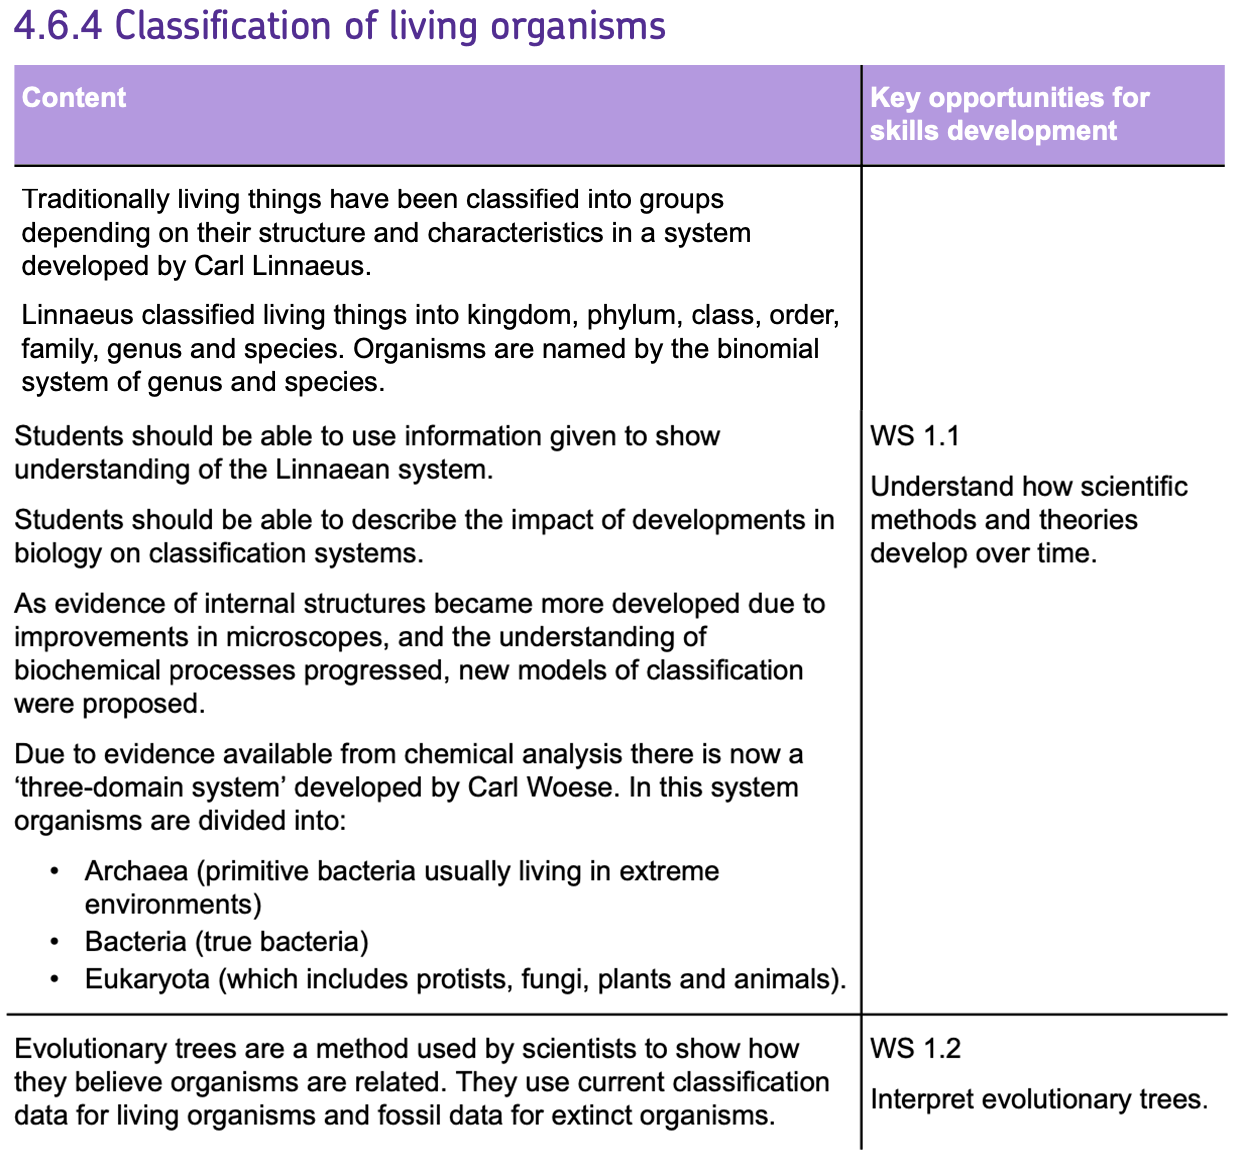
Communities
ECOLOGY is all about ORGANISMS and their INTERACTION with the ENVIRONMENT they live in.
KEY TERMINOLOGY IN ECOLOGY
- HABITAT: The specific area where an organism lives, which provides it with its resources.
- POPULATION: All the organisms of one species living in the same habitat.
- COMMUNITY: All the populations of different species that live in the same habitat and interact with each other.
- ABIOTIC FACTORS: The NON-LIVING factors of an environment.
- BIOTIC FACTORS: The LIVING factors of an environment, including all organisms.
- ECOSYSTEM: The interaction of a COMMUNITY of living organisms (BIOTIC) with the non-living (ABIOTIC) parts of their environment.
RESOURCE COMPETITION:
Organisms are ADAPTED to their environment, which allows them to survive, reproduce, and compete effectively in their given HABITAT.
But when RESOURCES in the environment are LIMITED, organism need to COMPETE with each other in order to SURVIVE and REPRODUCE.
This can be organisms competing with OTHER species or even their OWN species for the same resources.
Examples of resources include:
IN PLANTS: LIGHT, WATER, SPACE and MINERAL IONS.
IN ANIMALS: FOOD, WATER, MATES, and TERRITORY.
INTERDEPENDENCE AND COMPETITION:
INTERDEPENDENCE in a COMMUNITY, is all the organisms RELYING on each other in order to survive.
For example:
- PREDATORS need their PREY as FOOD SOURCES.
- FLOWERS need INSECTS for POLLINATION.
- PLANTS with fruit need ANIMALS for SEED DISPERSAL.
- HERMIT CRABS needing EMPTY SEASHELLS for SHELTER.
If one of these species is REMOVED from the community, it can have significant effects on the whole COMMUNITY.
A STABLE COMMUNITY is one where species and environmental factors are in equilibrium, allowing population sizes to remain fairly CONSTANT.
FOOD WEBS
Food webs show you what organisms eat what in a COMMUNITY and they can be used to show INTERDEPENDENCE.
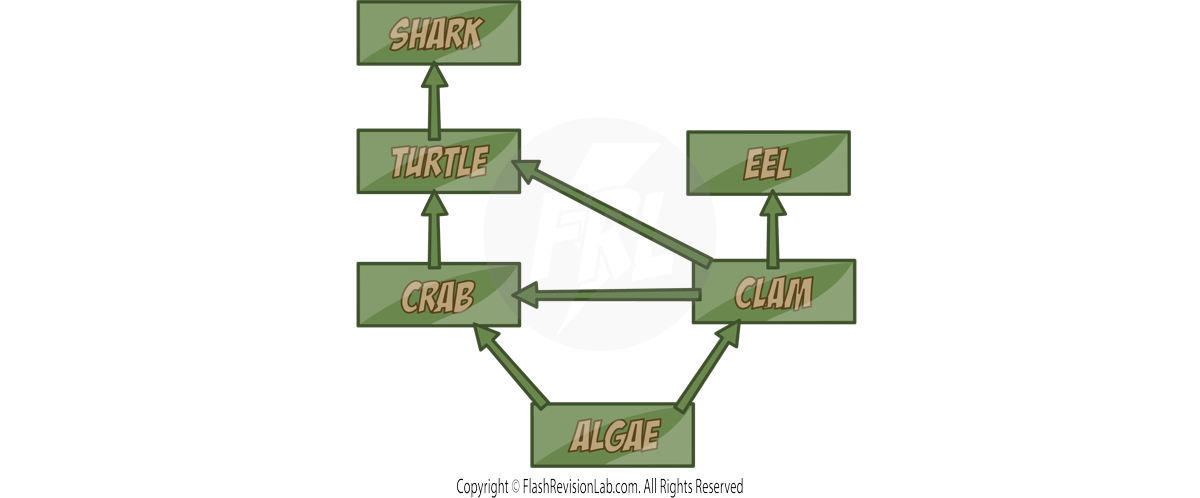
What would happen if the population of the CLAMS were to DECREASE?
- The population of EELS would DECREASE as they have less FOOD.
- The population of ALGAE would INCREASE as there are less CLAMS eating it.
- This could have knock on effects on the CRAB, TURTLE and SHARKS.
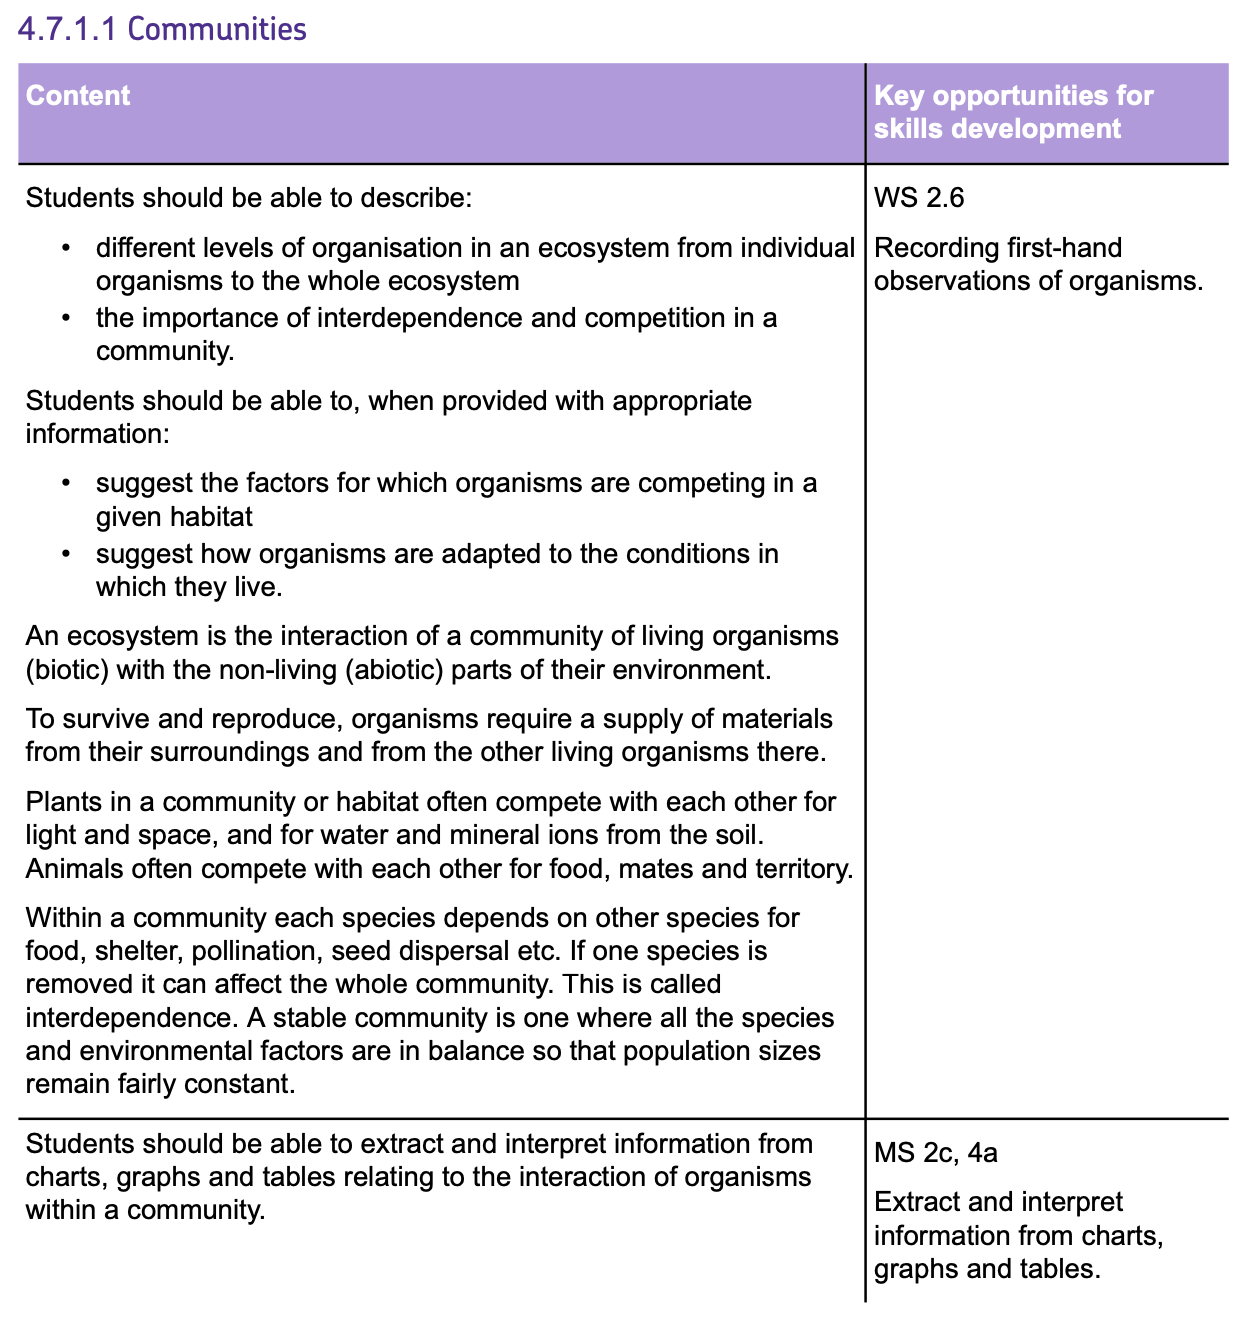
Abiotic and Biotic Factors
ABIOTIC FACTORS
ABIOTIC FACTORS are the NON-LIVING elements of an ecosystem that can influence the living organisms within it.
These factors include:
- MOISTURE LEVEL: Affects plant hydration and animal water sources.
- LIGHT INTENSITY: Influences photosynthesis in plants.
- TEMPERATURE: Impacts metabolic rates in organisms.
- CARBON DIOXIDE LEVEL: Essential for plant photosynthesis.
- WIND INTENSITY AND DIRECTION: Can spread seeds or pollen and affect animal movement.
- OXYGEN LEVEL (for aquatic animals): Vital for aquatic organisms' respiration.
- SOIL PH AND MINERAL CONTENT: Influences plant nutrient uptake and growth.
VARIABILITY IN ABIOTIC FACTORS
- Changes in abiotic factors, such as a shift in temperature, can lead to a change in the size and distribution of populations in an ecosystem.
BIOTIC FACTORS
BIOTIC FACTORS are the living parts of an ecosystem and include:
- NEW PREDATORS: Their arrival can alter the survival and reproduction rates of prey species.
- COMPETITION: Occurs when multiple species need the same limited resources. One species outcompetes another so the numbers are no longer sufficient to breed.
- NEW PATHOGENS: Can cause diseases that reduce population sizes.
- AVAILABILITY OF FOOD: Directly affects the growth and reproductive success of organisms.
ECOSYSTEM INTERACTIONS AND CHANGES
- An ecosystem's health and stability often depend on a delicate balance between its abiotic and biotic components.
- The introduction of new biotic factors, like a new predator or pathogen, can have cascading effects due to the interdependence of all organisms within the community.
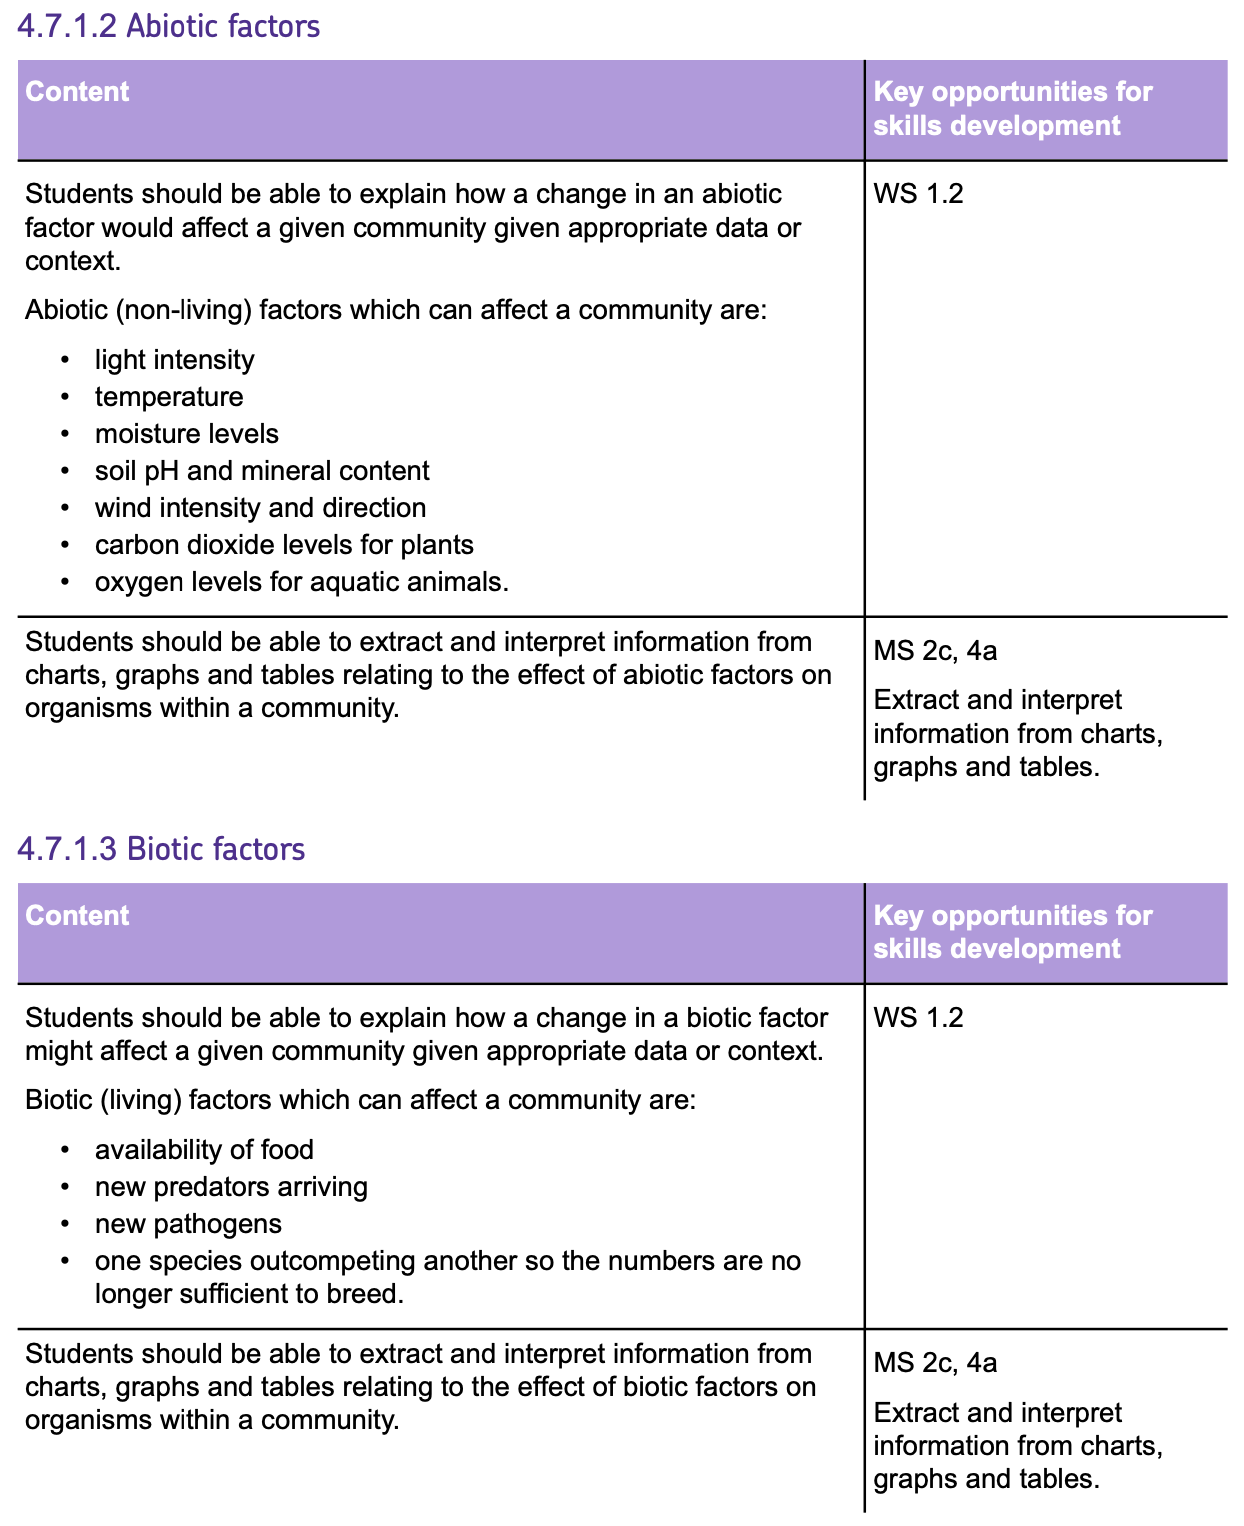
Adaptations
ADAPTATIONS are the special features that allow organisms, including MICROORGANISMS, to survive in their unique environmental CONDITIONS.
There are THREE types of ADAPTATIONS:
1. STRUCTURAL ADAPTATIONS:
These involve PHYSICAL ATTRIBUTES of an organism, such as body shape and colour, which aid in survival.
For example:
- POLAR BEARS have WHITE FUR for CAMOUFLAGE against SNOW.

- CACTI have SPINES instead of leaves to reduce WATER LOSS due to TRANSPIRATION in hot climates.
- CAMELS have a thin layer of FAT and a large SURFACE AREA TO VOLUME RATIO to dissipate heat in hot environments.
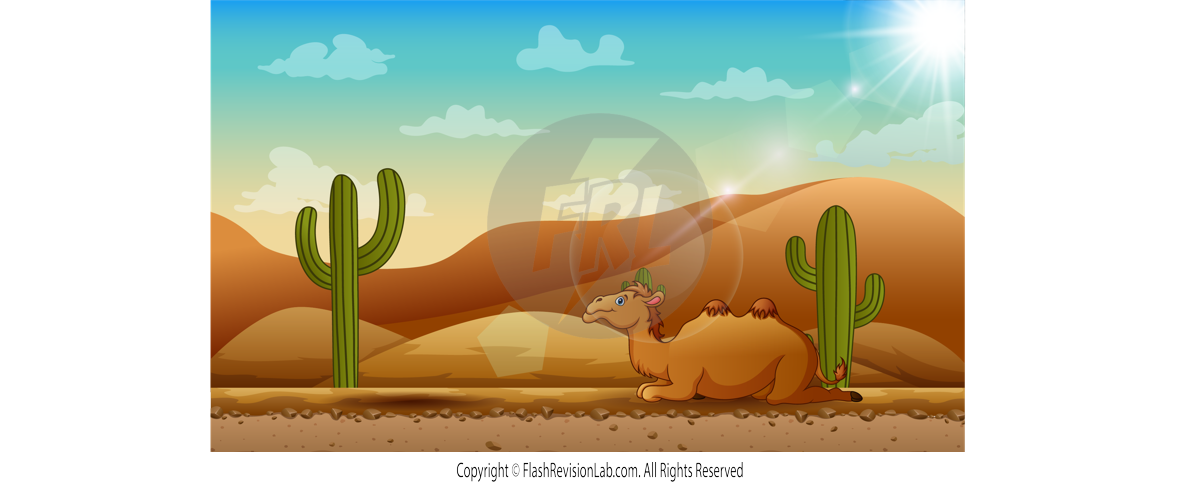
- WHALES possess a thick layer of BLUBBER and a low SURFACE AREA TO VOLUME RATIO for heat retention.

2. BEHAVIOURAL ADAPTATIONS:
These are ACTIONS organisms take to survive.
For instance:
- Many BIRDS MIGRATE to warmer regions during winter to escape cold conditions.
- Animals like bears HIBERNATE to conserve energy when food is scarce.

3. FUNCTIONAL ADAPTATIONS:
These are internal process adaptations related to an organism’s BODILY FUNCTIONS, such as metabolism and reproduction.
For example:
- DESERT ANIMALS conserve water by producing very LITTLE SWEAT and CONCENTRATED URINE.
EXTREMOPHILES
Some BACTERIA are known as EXTREMOPHILES and have adapted to live in extreme conditions.
Examples include:
- Bacteria living in VOLCANIC VENTS can survive in very HIGH TEMPERATURES.
- Bacteria living in DEEP SEA VENTS can survive in very HIGH PRESSURE.
- Bacteria living in SALINE LAKES can survive in very HIGH SALT CONCENTRATIONS.
Levels of Organisation
Food Chains
Food Chains describe the feeding relationships between species within an ecosystem, starting with producers and moving up to primary, secondary, and sometimes tertiary consumers.
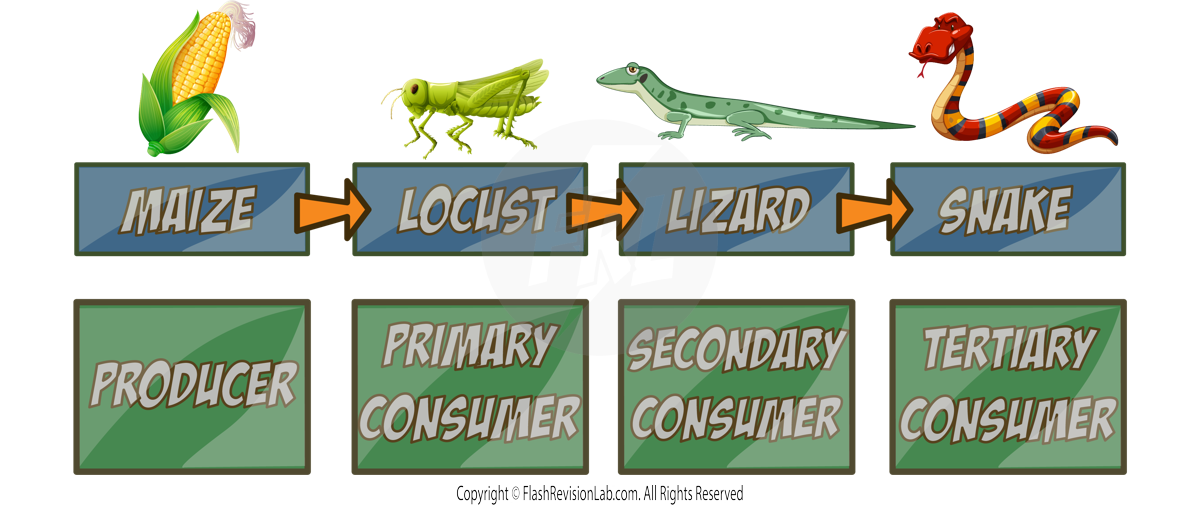
- Producers: plants and algae, are organisms that create their own food through PHOTOSYNTHESIS, using energy from the sun. They form the base of the food chain.
- Primary Consumers: are typically HERBIVORES that feed on producers.
- Secondary Consumers: are often CARNIVORES or OMNIVORES that eat the primary consumers.
- Tertiary Consumers: when present, are usually APEX PREDATORS at the top of the food chain and have no natural predators.
- Biomass refers to the total mass of LIVING MATERIAL at a particular stage of a food chain. It represents the amount of the energy available at that level, and it decreases after every stage. This means the organisms at the TOP of the food chain always receive the LEAST amount of biomass from their food.
Predators and Prey
PREDATORS are consumers that kill and eat OTHER ANIMALS and PREY are the animals that GET EATEN.
The numbers of predators and their prey in an STABLE ecosystem tend to fluctuate in cyclical patterns, known as PREDATOR-PREY CYCLES.
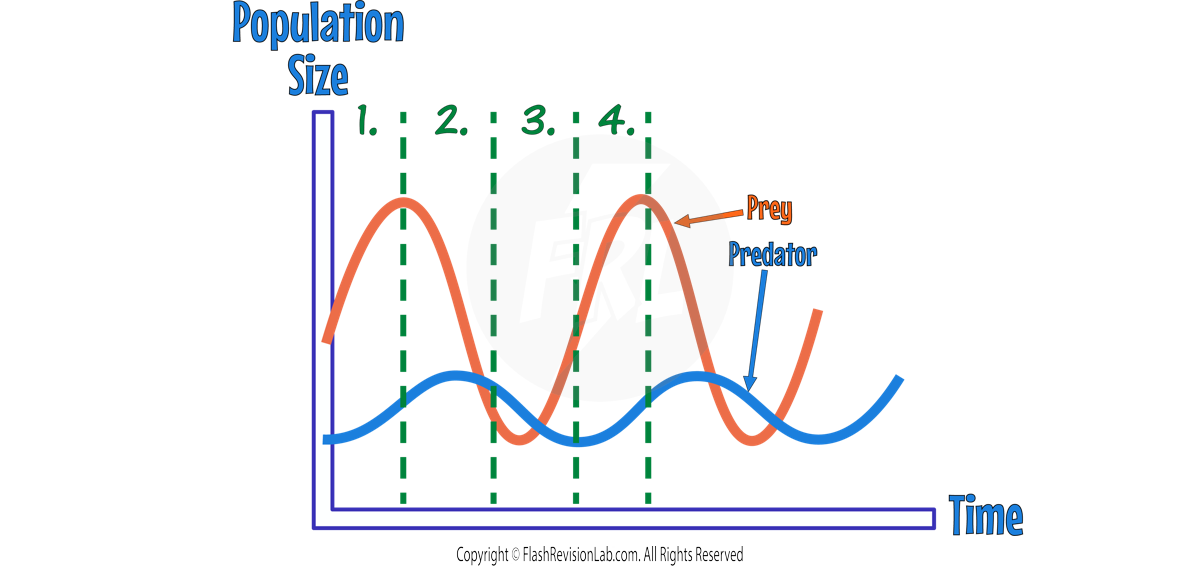
1. An INCREASE in PREY population typically leads to an INCREASE in PREDATORS since MORE FOOD is available.
2. As the PREDATOR population INCREASES, the PREY population begins to DECLINE as the prey get hunted and killed MORE.
3. This is followed by a DECREASE in PREDATORS, as they now have LESS FOOD to eat.
4. Fewer predators results in the population of PREY INCREASING once again and the whole cycle repeats again.
This cycle demonstrates that predators and prey are INTERDEPENDENT and the importance of each species in maintaining ecological stability.
Disruptions to this cycle can be bad for the ecosystem:
- For example, the REMOVAL of a specific PREDATOR can lead to an OVERPOPULATION of their PREY, which may result in plants being overeaten which can damage the habitat for ALL organisms living there.
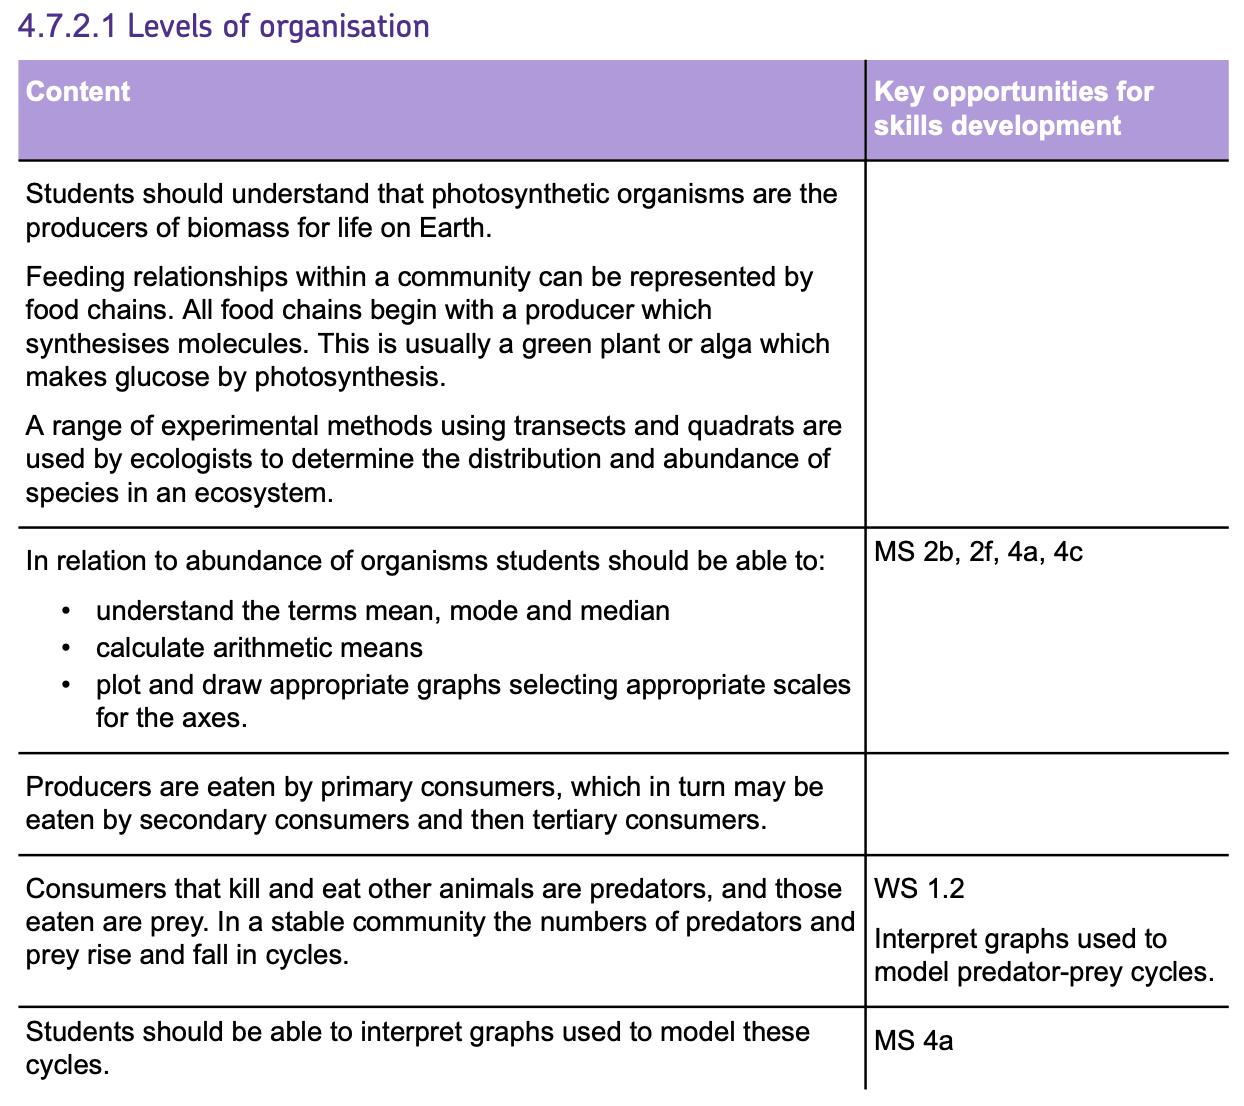
Required Practical: Quadrats and Transects
This practical is used to measure the POPULATION and DISTRIBUTION of species in a habitat.
DISTRIBUTION is how individuals of a species are SPATIALLY ARRANGED within a particular area.
E.g. if you have a large park, some species of plants may be more common near a pond because they survive better there.
There are THREE ways to measure the distribution of organisms:
1. QUADRAT Experiment
This involves using a QUADRAT to ESTIMATE the POPULATION size of a plant species in a specific area.
A QUADRAT is a SQUARE FRAME that is placed on the ground to measure the ABUNDANCE of certain small organisms in an area.
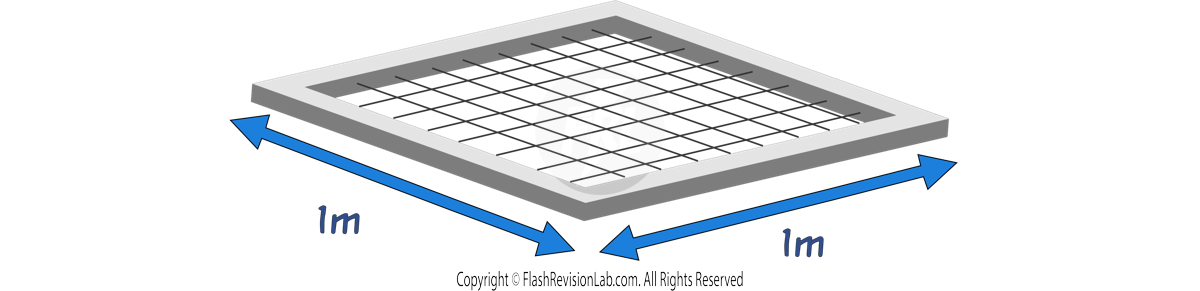
To use the quadrat, you place it on the ground and COUNT the number of organisms within the square.
E.g. if you were investigating the distribution of daisies in a field, you would place the quadrat on the ground and count the number of daisies within the quadrat.
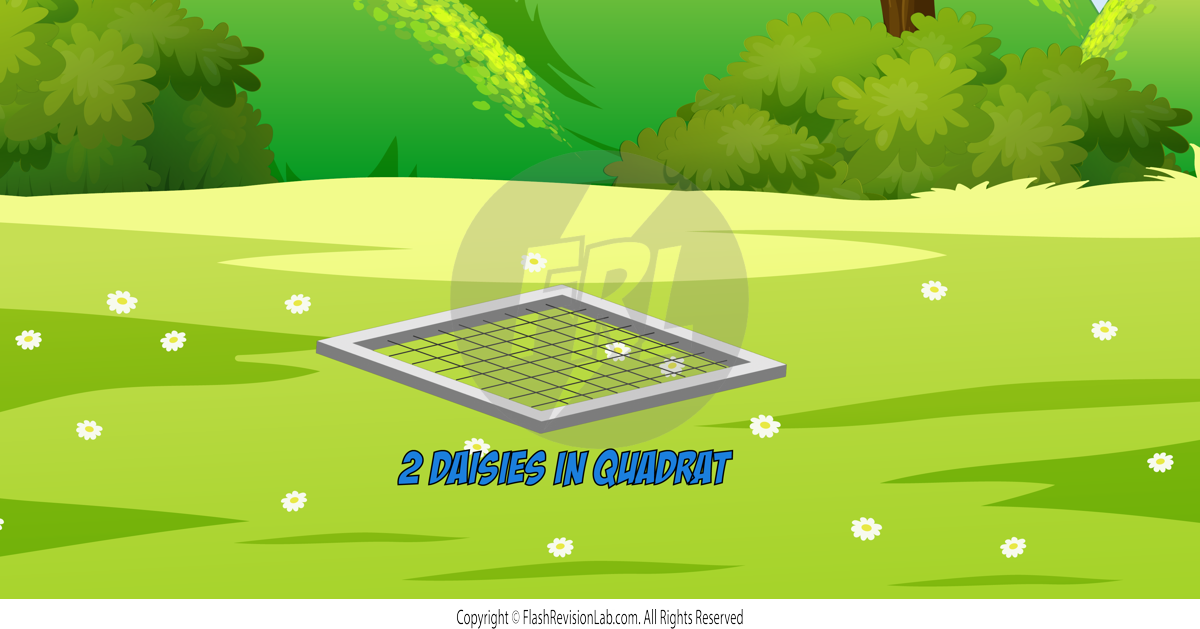
The quadrats need to be placed RANDOMLY within the location to ensure a fair test. To do this in a large area, you need to divide it into a grid with numbers
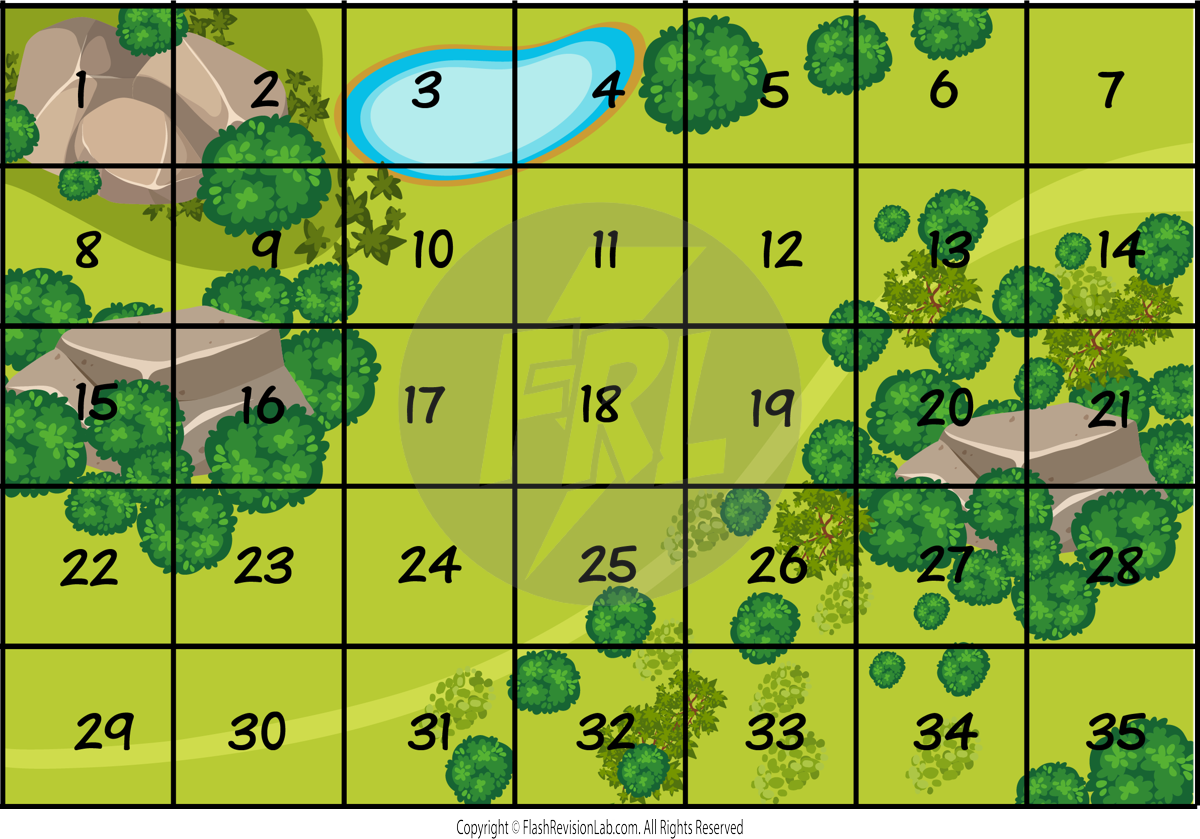
You can use a RANDOM NUMBER GENERATOR to pick a number in the grid to carry out the test.
You then go to the location of the number and throw the quadrat in a random direction.
Here are the steps to carry out an investigation of the distribution of DAISIES in a park:
- Place your quadrat at a RANDOM POINT within the area to be studied by dividing the park into a grid and using a random number generator to pick a location.
- Place the quadrat on the ground at that location.
- COUNT all the daisies within the quadrat.
- Repeat this process several times.
- Calculate the MEAN number of organisms per quadrat.

You can now compare your values with the MEAN from another park to see the differences in distributions in the two locations.
You can also estimate the POPULATION of daisies in the park by first finding the number of daisies per m2 (this is usually just the mean if the quadrat is 1m2).
You can then use the following equation:
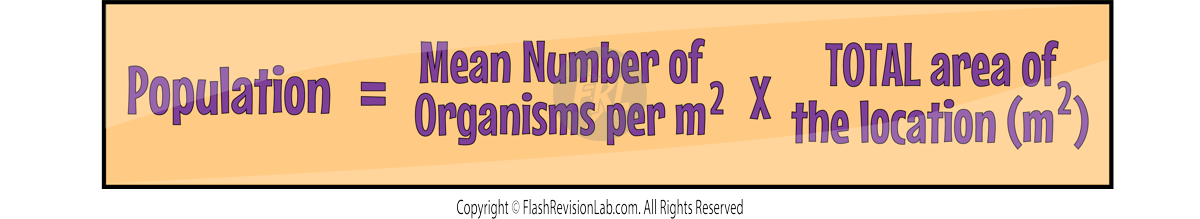
The data collected can also be used to calculate the MODE and MEDIAN.


2. Calculating Percentage Cover
Sometimes it’s difficult to measure the number of organisms within a quadrat (e.g. counting blades of grass)
You can instead estimate the PERCENTAGE COVER of the location by using the SMALL SQUARES within the quadrat.
If there are 100 squares in total, the number of squares in the quadrat containing the organism will give you the percentage cover of the organism.
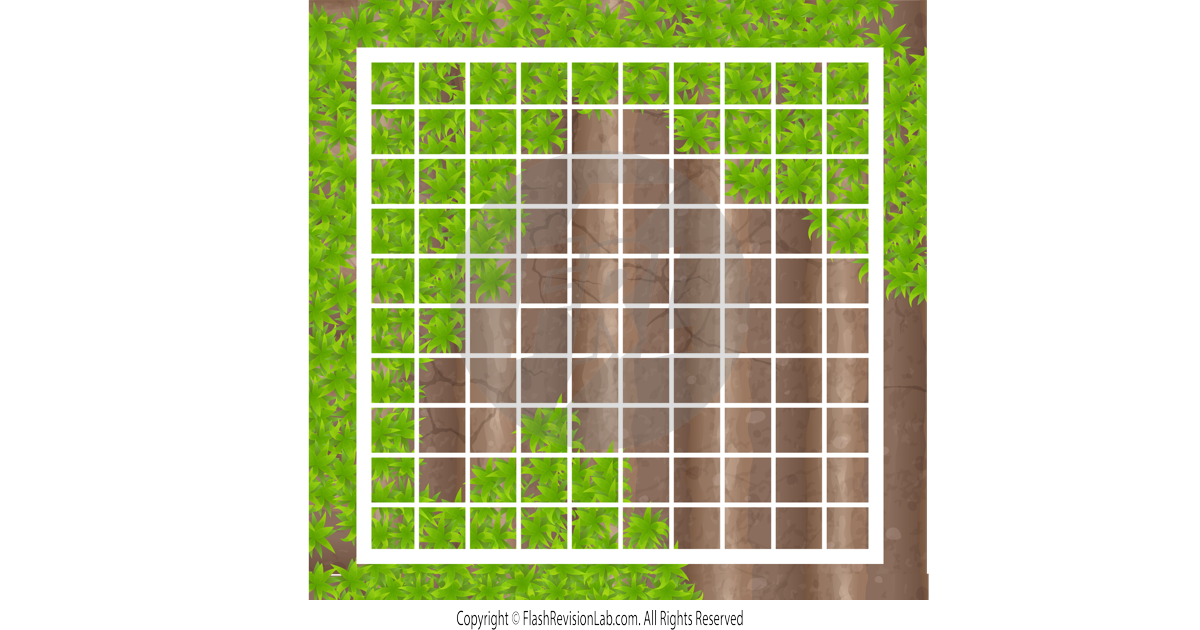
This quadrat roughly has 46 squares with grass in them, therefore the PERCENTAGE cover of this example would be 46%.
3. Transect Experiment
This involves using a TRANSECT LINE and a QUADRAT to investigate the effect of a factor on the number of plants in a survey area
TRANSECTS are LINES used to study organism distribution along it. They are usually made using a TAPE MEASURE.
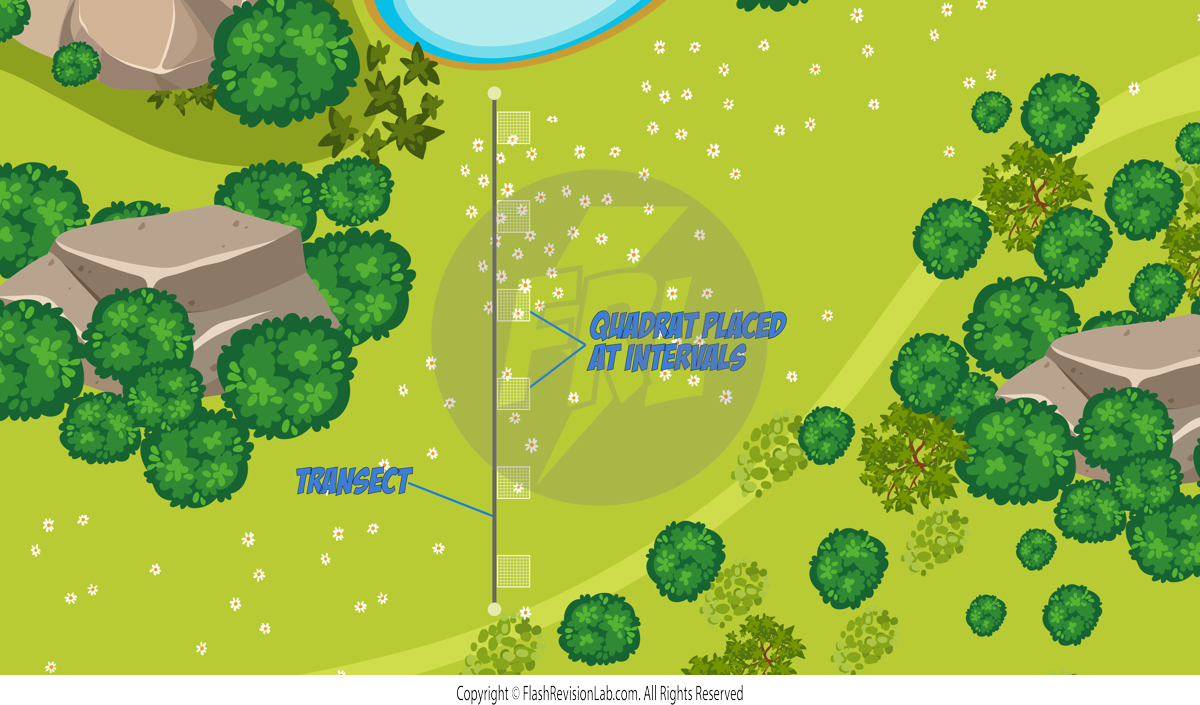
Steps:
- MARK OUT a line in the area of interest with a tape measure.
- COLLECT DATA by counting all the organisms along the line.
- You can use quadrats placed at INTERVALS, such as every 2 meters, alongside the line.
Here's an example calculation:
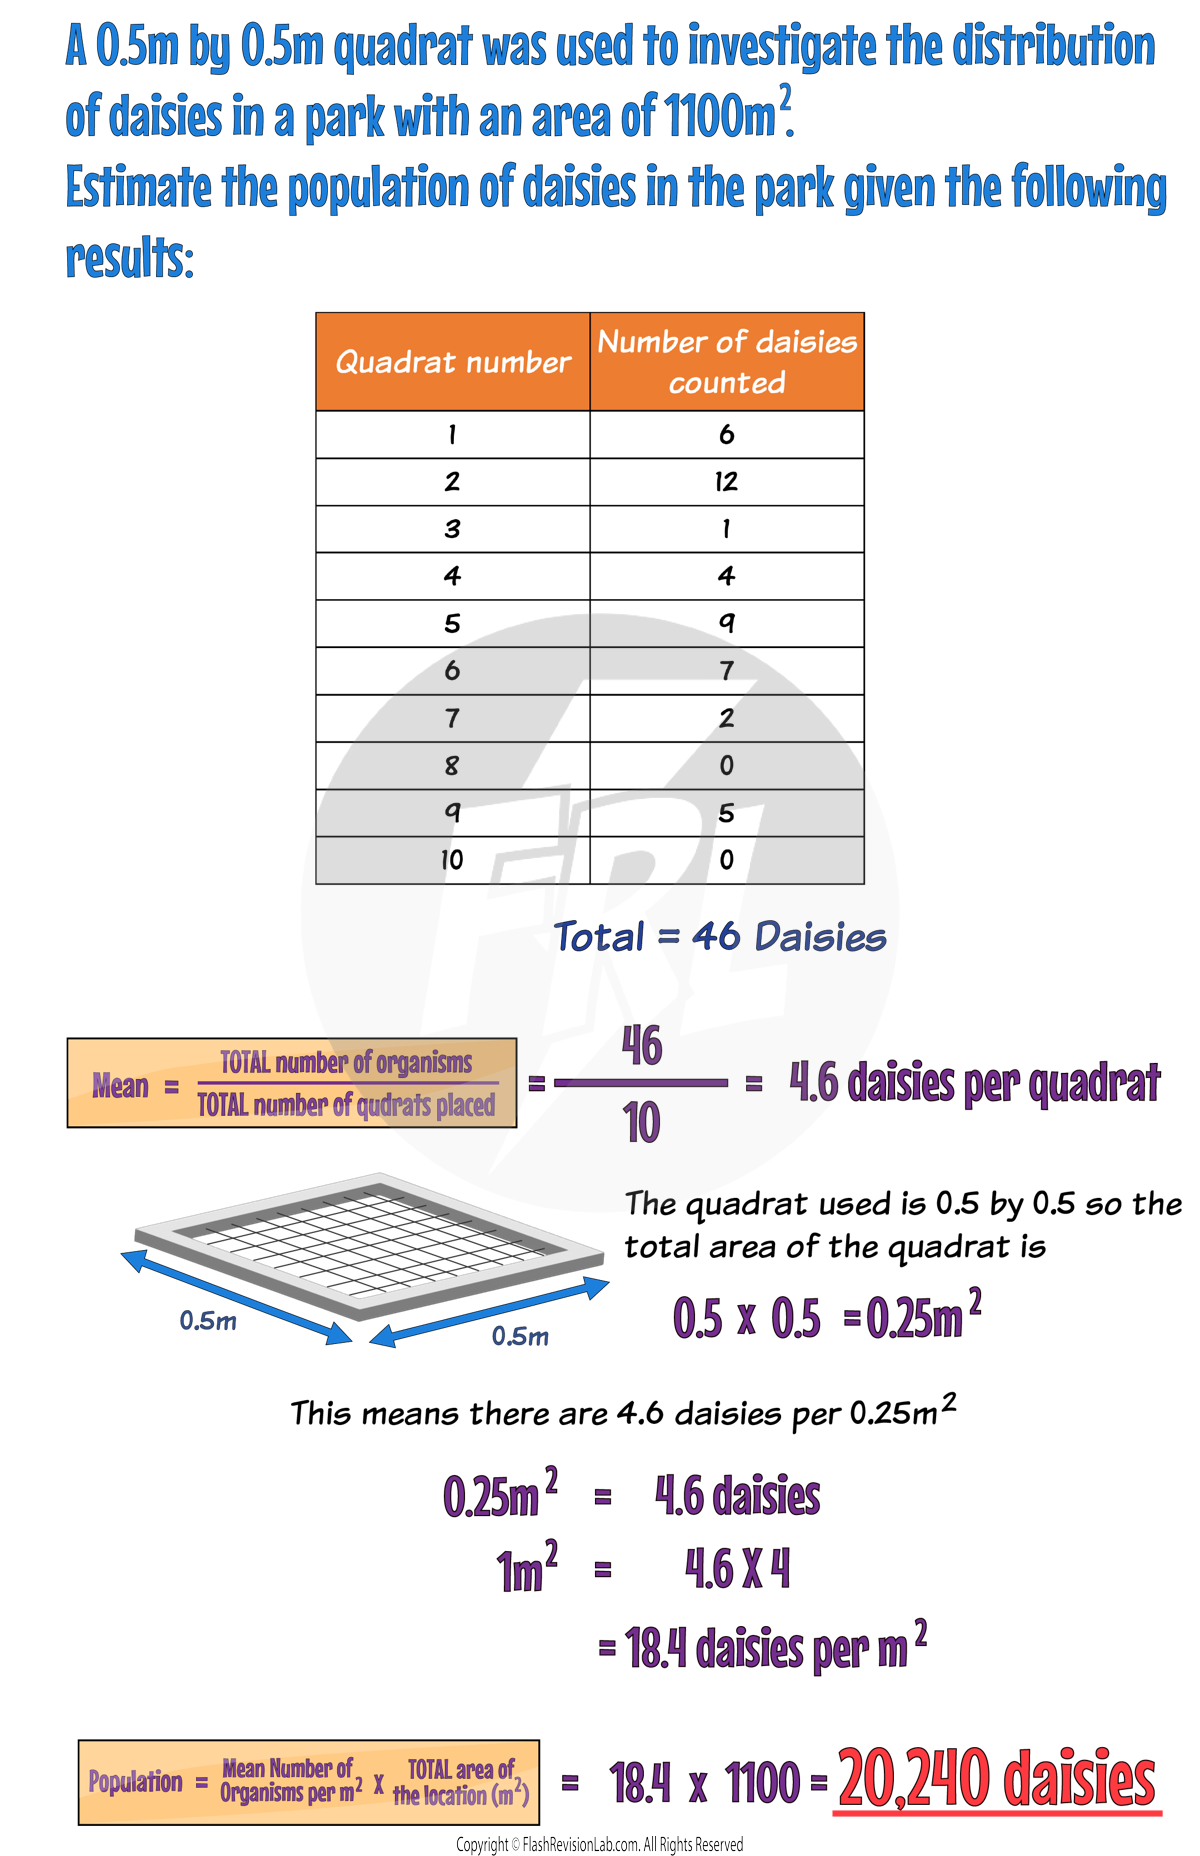

Many different materials such as WATER, CARBON and NITROGEN cycle through the abiotic and biotic components of an ecosystem.
All materials in the living world are recycled to provide the building blocks for future organisms.
In a stable COMMUNITY, there's a balance between the materials taken from and returned to the soil, maintaining a CONSTANT CYCLE.
The Water Cycle
The WATER CYCLE is Earth's way of recycling water. Here's how it works:
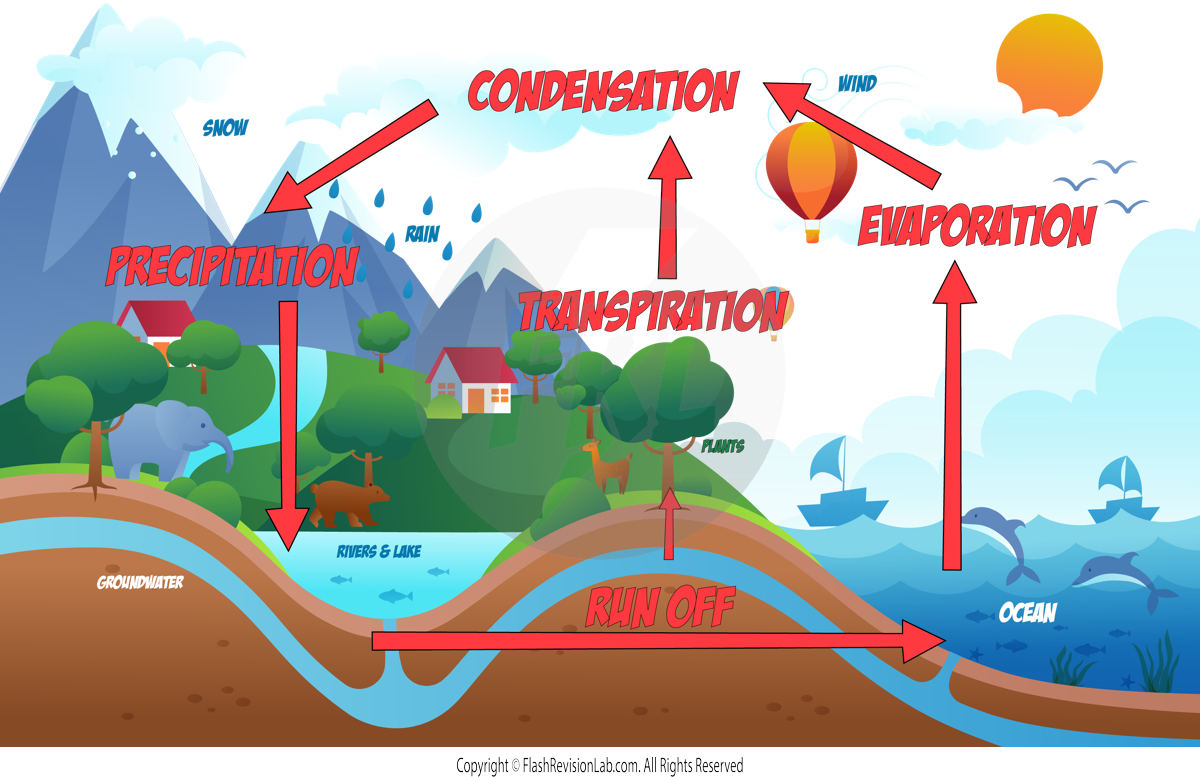
- ENERGY from the SUN heats water on land and sea, causing it to EVAPORATE and turn into WATER VAPOUR.
- TRANSPIRATION occurs when water evaporates from plants.
- The warm WATER VAPOUR rises and CONDENSES into clouds as it cools down.
- PRECIPITATION happens when water falls from clouds as rain, snow, or hail, providing FRESH WATER for plants and animals.
- Water is ABSORBED by the soil and taken in by PLANT ROOTS, aiding in PHOTOSYNTHESIS. This water can also become part of the plants' TISSUES and move through food chains to animals.
- Animals and plants use water for CHEMICAL REACTIONS necessary for life. They RETURN water to the soil and atmosphere through EXCRETION (like sweating and urinating).
- RUN OFF occurs when water that isn't absorbed by soil flows into STREAMS and RIVERS.
- Eventually, all this water DRAINS back into the SEA, and the cycle starts again with more EVAPORATION.
The Carbon Cycle
The CARBON CYCLE is nature's way of reusing carbon atoms, which are vital for life on Earth.
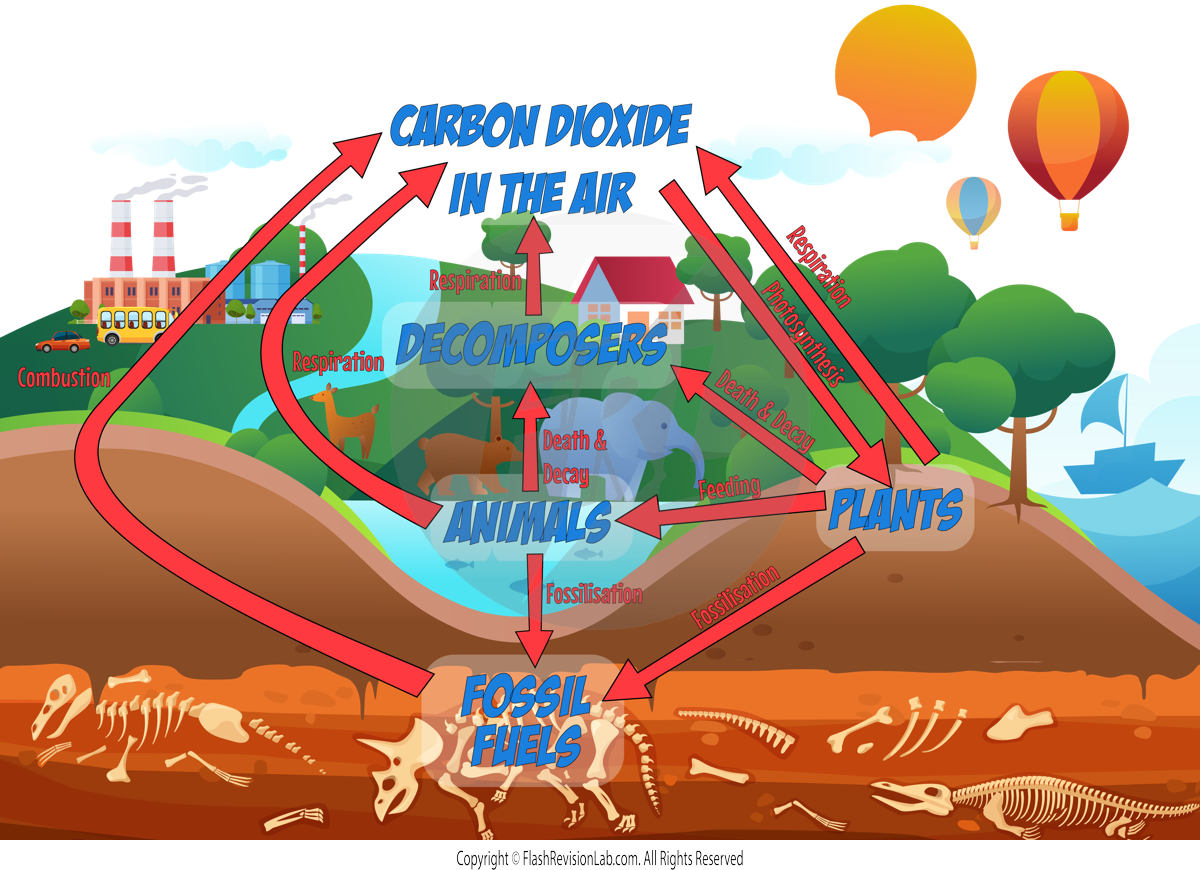
- CO₂ is removed from the ATMOSPHERE by plants and algae during PHOTOSYNTHESIS. Carbon is then used to make GLUCOSE and is turned into other organic materials like carbohydrates and fats.
- Plants and algae RESPIRE, returning some carbon to the atmosphere as CO₂.
- When plants and algae are consumed by ANIMALS, carbon becomes part of the animals' bodies and moves through the food chain.
- Through ANIMAL RESPIRATION, carbon is returned to the atmosphere as CO₂.
- Upon death, PLANTS, ALGAE, and ANIMALS are broken down by microorganisms known as DECOMPOSERS, which release CO₂ during RESPIRATION. The decomposers also return some of the carbon as MINERAL IONS in the soil.
- When plants and animals are buried and subjected to HIGH TEMPERATURES and PRESSURES for millions of years, they turn into FOSSIL FUELS.
- BURNING the fossil fuels (COMBUSTION) releases CO₂ back into the atmosphere.
- The whole cycle keeps REPEATING.
Biodiversity and Waste Management
BIODIVERSITY is the VARIETY of different organisms on EARTH, or in an ECOSYSTEM.
- HIGH BIODIVERSITY is crucial for the STABILITY of ECOSYSTEMS so that they can function effectively.
- It reduces the DEPENDENCE of one species on another for FOOD and SHELTER.
- Maintaining biodiversity is vital for HUMAN SURVIVAL. It affects resources like clean air and water, fertile soil for crops, and materials for shelter and clothing.
- Human activities have caused us to face ENVIRONMENTAL CHALLENGES such as GLOBAL WARMING and DEFORESTATION.
- These are major threats to biodiversity, but efforts are being made to mitigate these impacts.
Population Growth and Environmental Impact
- The global HUMAN POPULATION is increasing rapidly due to advancements in MEDICINE, FARMING and STANDARD OF LIVING.
- While this has benefits like reduced DEATHS from disease and hunger, it also puts pressure on the ENVIRONMENT as people consume more resources to meet these survival needs and improve the STANDARD OF LIVING.
- The demand for RAW MATERIALS for luxuries (such as cars and devices) and necessities is increasing, which includes the EXTRACTION and use of METALS, FOSSIL FUELS, and other NON-RENEWABLE resources.
- Thes materials are being used up faster than they are being replaced, making them the NOT SUSTAINABLE.
Escalating Waste Production
With more goods being produced for a increasing human population, there is also an increase in WASTE, including hazardous CHEMICALS.
If not managed properly, this waste can cause POLLUTION, which has harmful effects on plants and animals, and can severely reduce BIODIVERSITY.
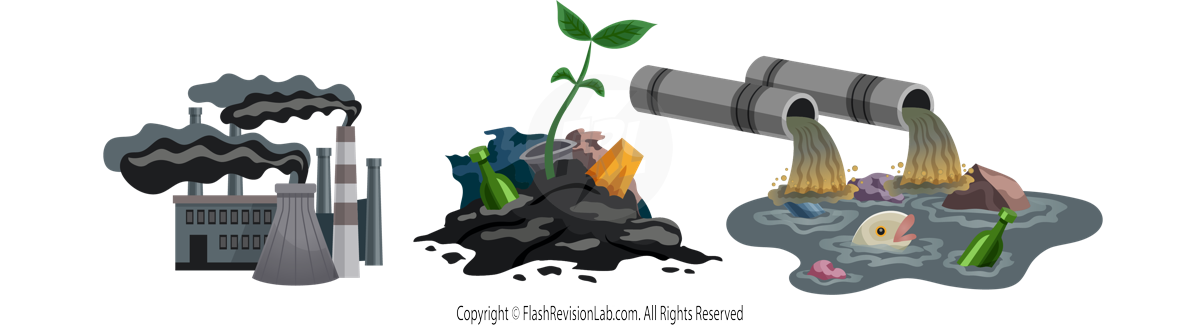
Examples include:
- INDUSTRIAL WASTE can pollute lakes and rivers and affect aquatic life.
- AGRICULTURAL CHEMICALS, such as fertilisers and pesticides, may lead to water pollution if not managed properly.
- SOLID WASTE management is becoming more challenging, with landfills filling up and the need for recycling becoming even more critical.
- AIR POLLUTION from industrial emissions, including SMOKE and ACIDIC GASES, has global impacts such as ACID RAIN, which can damage ecosystems far from the pollution source.
Deforestation and Land Use
Humans use land for BUILDING, QUARRYING, FARMING, and DISPOSING OF WASTE.
This reduces the land available for OTHER ORGANISMS and can lead to negative environmental effects, such as DEFORESTATION and the destruction of PEAT BOGS.
Deforestation
DEFORESTATION involves the cutting down of FORESTS and is particularly problematic when done on a large scale, like in tropical areas.
Reasons for deforestation include clearing land for FARMING (cattle and rice fields) to produce more food, and for growing crops for BIOFUELS like ethanol.
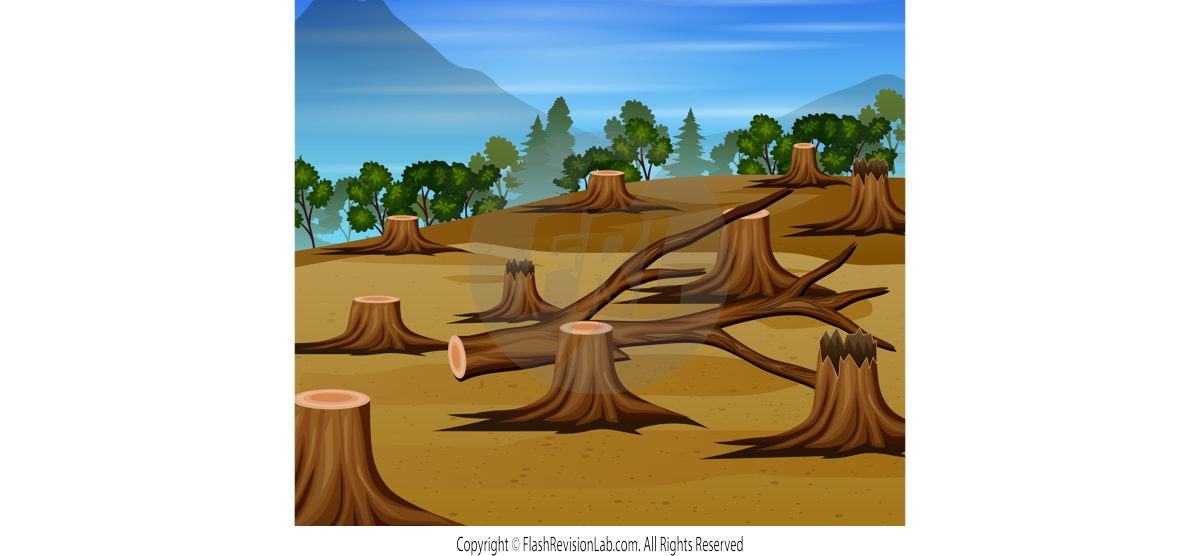
Problems from Deforestation
- LESS CARBON DIOXIDE TAKEN IN: Trees absorb carbon dioxide during PHOTOSYNTHESIS. Cutting them down means less CO₂. is removed from the atmosphere.
- MORE CARBON DIOXIDE IN THE ATMOSPHERE: Trees store carbon in their wood for centuries. When trees are burnt, the carbon they stored is released as CO₂. Also, MICROORGANISMS decompose dead wood, releasing CO₂.
- LESS BIODIVERSITY: Forests are home to many species, so deforestation can cause the EXTINCTION of species and REDUCES BIODIVERSITY.
PEAT BOGS
PEAT BOGS are unique areas of land found in waterlogged and acidic areas.
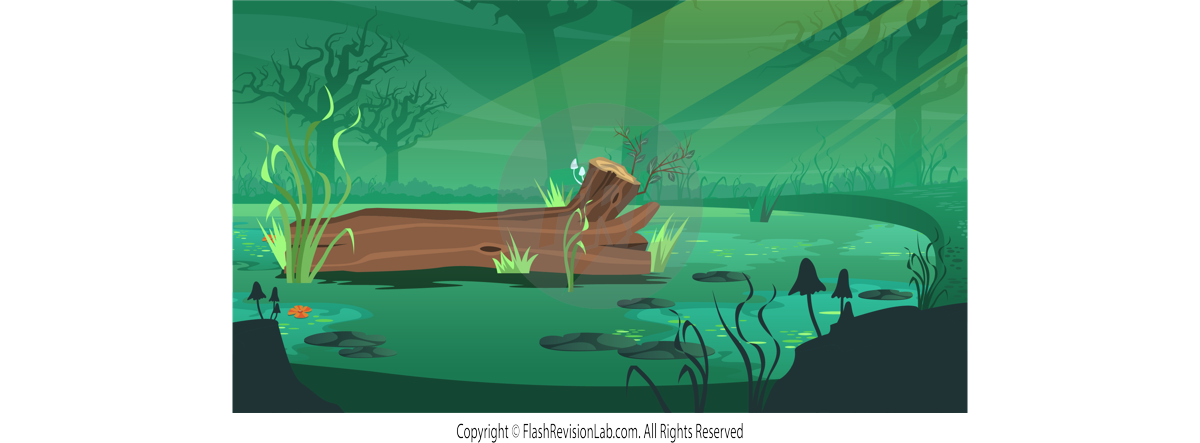
They are essential for several reasons:
- Unlike other environments, the acidic and waterlogged conditions in peat bogs mean that plant material does NOT FULLY DECAY due to a lack of oxygen.
- Over time, this partially decomposed plant matter becomes PEAT, which is a significant CARBON STORE. Instead of releasing carbon dioxide into the atmosphere during decay, peat locks it away.
- These bogs are crucial habitats for a diversity of species, including birds, and play a role in maintaining BIODIVERSITY.
However, peat bogs face threats due to HUMAN ACTIVITIES:
- They are drained for FARMING, which dries out the peat and leads to its decay, RELEASING STORED CARBON.
- Peat is also harvested as a FUEL source and for producing COMPOST, which is used to enhance soil for agricultural production.
The destruction of peat bogs has several negative impacts:
- Drained and decaying peat bogs contribute to GLOBAL WARMING by releasing carbon dioxide.
- As peat is a non-renewable resource formed over millennia, its extraction is NOT SUSTAINABLE.
- The reduction of peat bog areas leads to loss of habitats, reducing BIODIVERSITY.
- The rate of destruction often outpaces the natural formation of peat, leading to unsustainable use.
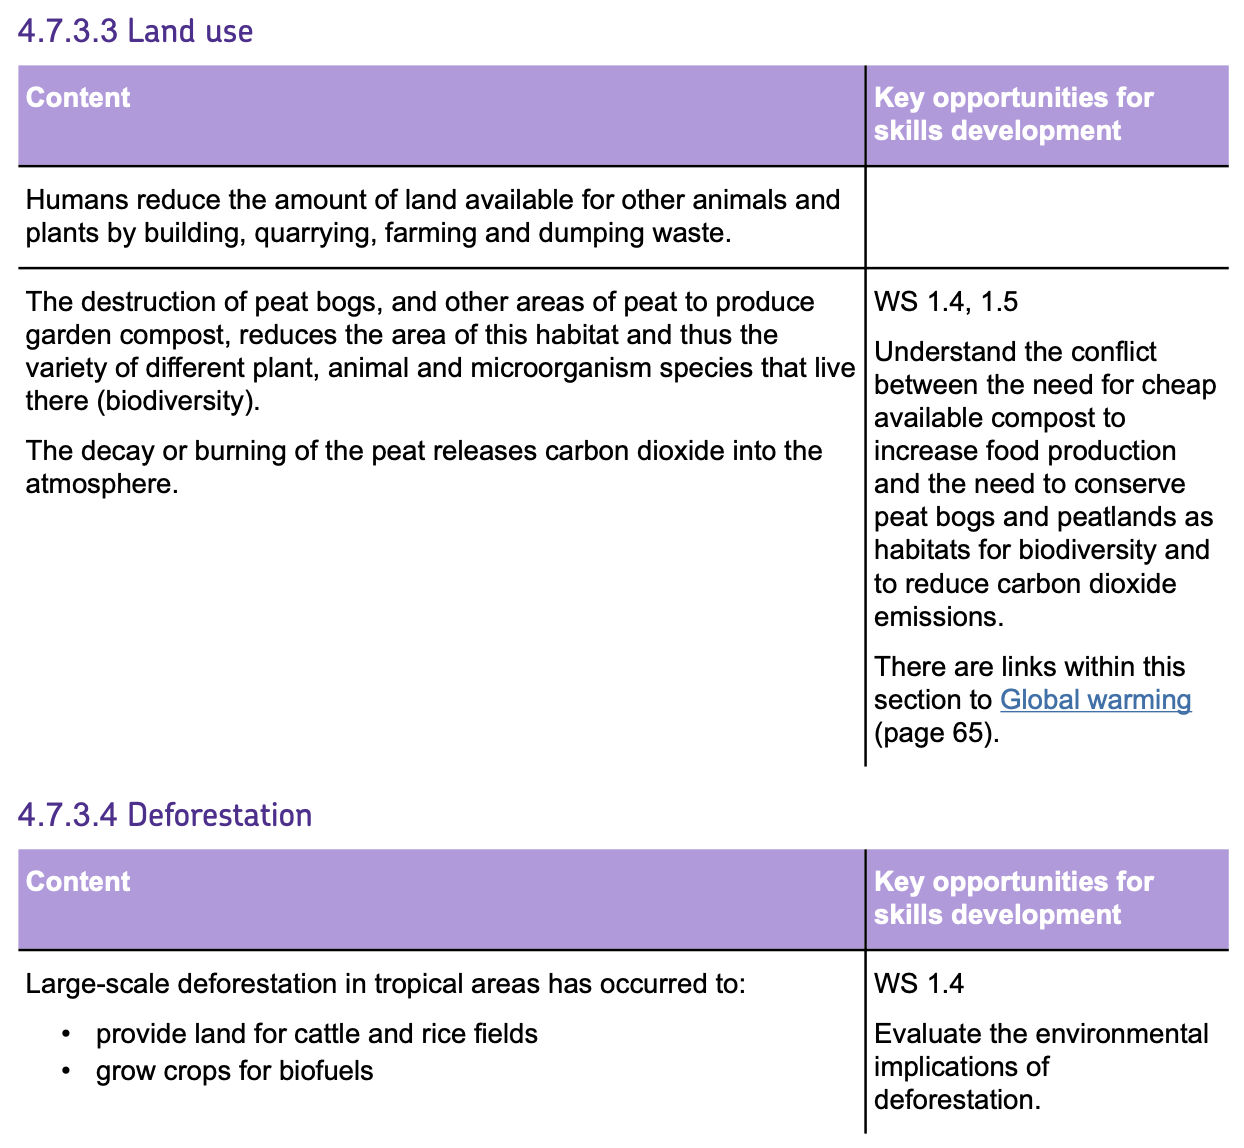
Global Warming
- GLOBAL WARMING occurs when CARBON DIOXIDE (CO₂), METHANE (CH₄), and other GREENHOUSE GASES accumulate in the atmosphere and trap the Sun's heat.
- The Earth's climate is a balance of the ENERGY it receives from the SUN and the energy it radiates back into space. When this balance is upset by excess greenhouse gases, global TEMPERATURES RISE.
- These gases act as an INSULATING LAYER, similar to the glass of a greenhouse, allowing sunlight in but preventing the heat from escaping, hence the term GREENHOUSE EFFECT.
- Without this natural greenhouse effect, Earth would be too cold for most forms of life. However, human activities have increased this effect, leading to climate change.
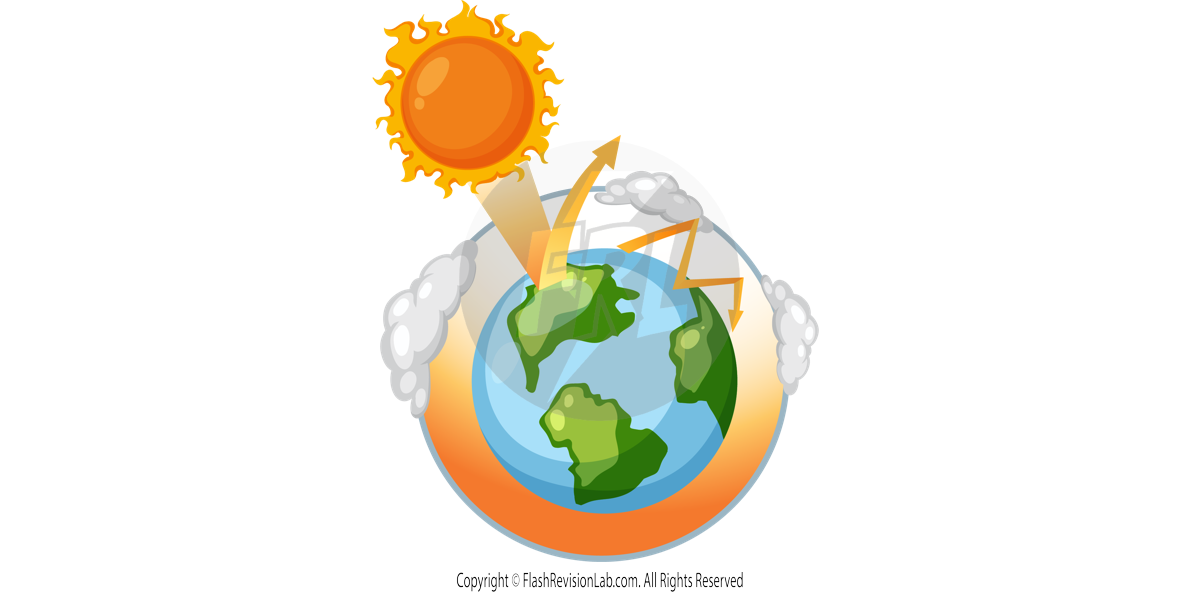
Consequences of an Enhanced Greenhouse Effect
- SEA LEVEL RISE: The melting of ice caps and glaciers contribute to rising sea levels, threatening coastal communities and ecosystems.
- INCREASED FLOODING: A higher sea level increases the likelihood of severe flooding. This can result in damage to infrastructure, loss of habitat for wildlife, and destructive effects on human settlements.
- SHIFTING ECOSYSTEMS: As global temperatures rise, ecosystems can change. Some species may find their current habitats unsuitable and move to cooler areas, if available.
- ALTERED SPECIES DISTRIBUTION: Many species are shifting to higher altitudes where temperatures are cooler, altering ecosystems and food webs.
- CHANGES IN AGRICULTURE: Some regions may become more suitable for agriculture, while others may become less so, affecting food security and economies.
- HEALTH IMPACTS: Higher temperatures can lead to increased incidences of heat-related illnesses and can affect disease patterns globally.
- BIODIVERSITY LOSS: Species that cannot adapt or migrate to new habitats may face extinction. This loss of biodiversity can disrupt ecosystems.
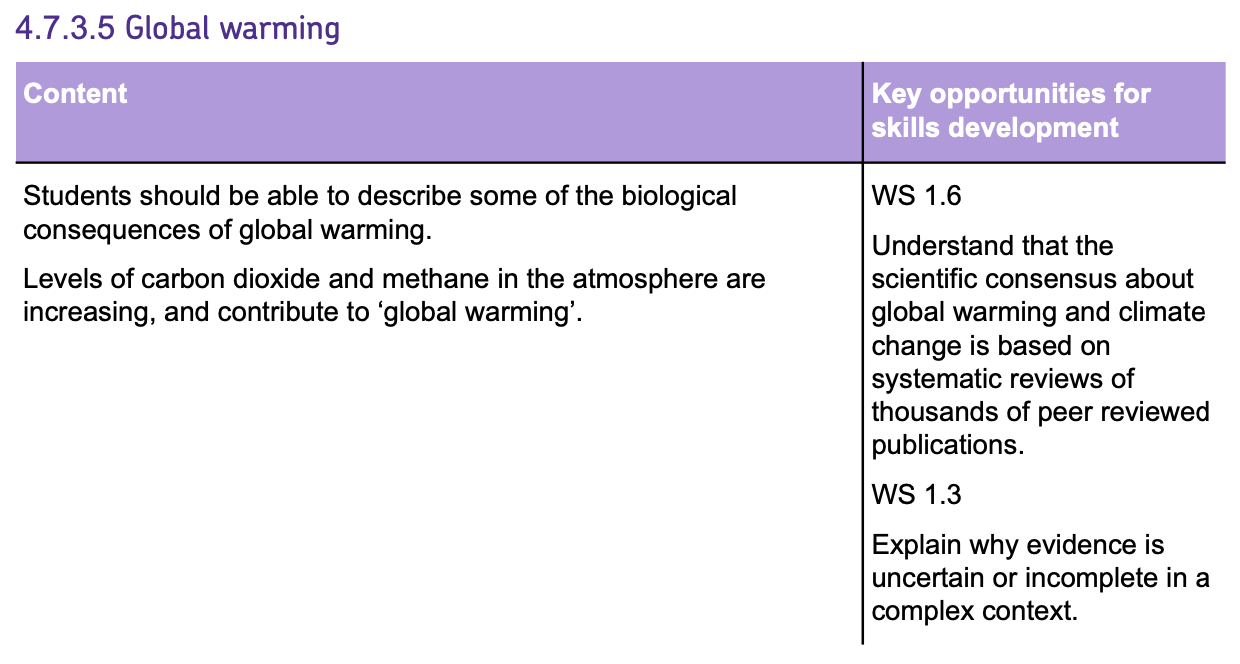
Maintaining Biodiversity
BIODIVERSITY is the variety of different species that live in an ECOSYSTEM and is crucial for an ecosystem’s stability.
Biodiversity is often reduced by HUMAN ACTIVITIES such as DEFORESTATION, incorrect WASTE DISPOSAL and destruction of PEAT BOGS.
To minimise the effects on ECOSYSTEMS and BIODIVERSITY, various PROGRAMMES have been initiated by scientists and concerned citizens:
- BREEDING PROGRAMMES: These help prevent ENDANGERED SPECIES from becoming extinct by breeding them in captivity and sometimes releasing them back into the wild.
- HABITAT PROTECTION: Efforts like regenerating coral reefs and rainforests aim to protect rare habitats, thus preserving biodiversity.
- REINTRODUCTION PROJECTS: Establishing HEDGEROWS and FIELD MARGINS on farms where only a single crop is grown helps reintroduce a range of plant species, offering habitats for a larger variety of organisms.
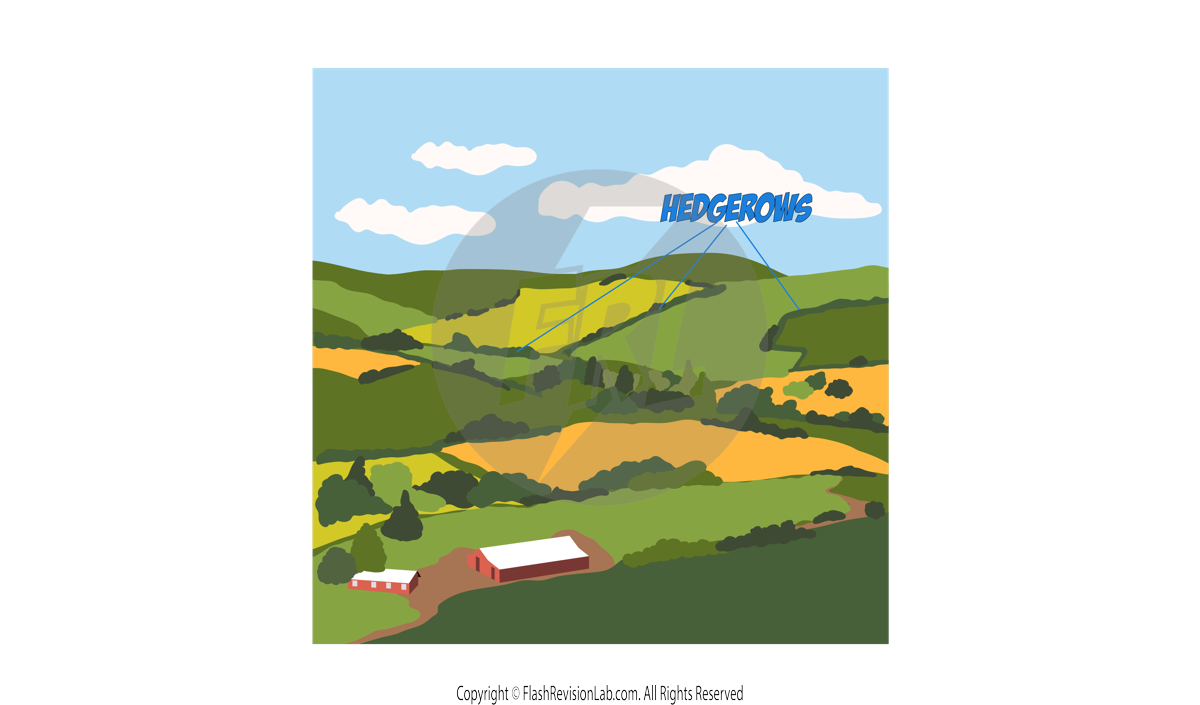
- REGULATIONS: Governments may implement laws to reduce deforestation and carbon dioxide emissions, combating GLOBAL WARMING.
- RECYCLING: Encouraging recycling can decrease waste in landfills, conserving land for ecosystems.
Balancing Biodiversity with Human Needs
Maintaining biodiversity can be difficult due to CONFLICTING PRESSURES:
- ECONOMIC FACTORS: Protecting biodiversity can be EXPENSIVE.
- FOOD SECURITY: Sometimes, biodiversity must be balanced against the need to protect crops and livestock for food for humans. This can result in habitat loss.
- DEVELOPMENT: While many support environmental protection, high-demand land use for housing and agriculture can make it difficult to maintain biodiversity.